

Abstract
Fetal body composition is an important determinant of body composition at birth, and it is likely to be an important determinant at later stages in life. The purpose of this work is to provide a comprehensive overview by presenting data from previously published studies that report on body composition during fetal development in newborns and the infant/child through 5 years of age. Understanding the changes in body composition that occur both in utero and during infancy and childhood, and how they may be related, may help inform evidence-based practice during pregnancy and childhood. We describe body composition measurement techniques from the in utero period to 5 years of age, and identify gaps in knowledge to direct future research efforts. Available literature on chemical and cadaver analyses of fetal studies during gestation is presented to show the timing and accretion rates of adipose and lean tissues. Quantitative and qualitative aspects of fetal lean and fat mass accretion could be especially useful in the clinical setting for diagnostic purposes. The practicality of different pediatric body composition measurement methods in the clinical setting is discussed by presenting the assumptions and limitations associated with each method that may assist the clinician in characterizing the health and nutritional status of the fetus, infant and child. It is our hope that this review will help guide future research efforts directed at increasing the understanding of how body composition in early development may be associated with chronic diseases in later life.
INTRODUCTION
The clinical importance of fetal and pediatric body composition merits re-emphasizing. Although it is still widely underused in the clinical setting, pediatric body composition can aid the clinician in monitoring disease progress of the underweight or overweight infant, treatment efficacy for certain metabolic diseases and body fat change of patients receiving enteral versus parenteral nutrition interventions, for example.1 Monitoring body composition changes could shed light on risk or outcome of survival for the small fetus and underweight or obese child (for example, risk for diabetes, cardiovascular disease and metabolic syndrome).1 Ultrasound and magnetic resonance imaging (MRI) can detect abnormal subcutaneous adipose tissue thicknesses related to compromised fetal health (the small or large fetus).2–4 Research efforts should concentrate on identifying the importance of monitoring fetal and infant body composition for the tailoring of nutrition during pregnancy and postpartum (energy, nutrient and fluid requirements of the premature infant) and treatment interventions of the infant or child (drug dosing).
Fetal body composition is a likely determinant of body composition and other markers of health status in the infant and child. However, during fetal development, validation studies of lean and fat tissue accretions are lacking. Body composition assessment during infancy and childhood (ex utero) has unique challenges. Measurement error can arise from inaccurate prediction equations, excess movement from the infant or child, equipment that is not designed for small bodies, and others.
Imaging techniques such as MRI and ultrasound are used to assess body composition in the fetus. During childhood, the only established body composition measurement techniques include anthropometry5–8 and air displacement plethysmography9 (ADP; it measures the body’s density from volume and weight by displacing water or air).10 Other commonly used techniques in childhood include hydrometry (the measurement of total body water (TBW) by using a tracer, in which the compartment’s volume is equal to the amount of tracer added to the compartment divided by the concentration of tracer in that compartment)11 and dual-energy X-ray absorptiometry (DXA; it measures the density of body tissues by comparing their absorption of X-rays of two different energies). Such techniques are used alone or incorporated into multicompartment models for children.
These body composition techniques have been used to produce the data that are used to define the reference fetus, infant and child. The fetus is reported to have minimal fat until 24 weeks of gestation. Percent lipid is approximately 6.25% in a 2.4-kg fetus and 13.9% in a 3.6-kg fetus (chemical analysis).12 Percent fat (%fat) by maternal abdominal MRI of the normal 40-week fetus is 17.2% in normal pregnancies versus 27.5% in gestational diabetes pregnancies.13 At birth, Fomon’s reference girl has 14.9% fat while boys have 13.7% fat (multicompartment model).14 As presented in Tables 1 and 2, studies using a variety of body composition techniques in infants at birth have reported between 7 and 23% fat. Percent fat from 3 to 12 months, for example, ranges from 23.7 to 31.5% fat in girls and 22.5 to 31.1 in boys. Marked reductions in fat percentage are then observed between 2 and 5 years, where girls have approximately 21.7% fat and boys have 17.2% fat (Table 3).15 Noting that certain ethnic/racial and gender body composition characteristic differ at birth, accurate assessment of body composition during and across key phases of development is important for intervention studies and chronic disease prevention strategies.
Table 1.
Body composition changes from birth to 1 year in girls
| Girls | |||||||||||
|---|---|---|---|---|---|---|---|---|---|---|---|
|
| |||||||||||
| Age (months) | Authora | Method | Ethnicity | Weight (kg) | FM (g) | % FM | TATV (ml) | TBW (%) | TBW (% of FFM) | FFM (g) | % Protein |
| Birth | Moulton | Chemical analyses | 81.9 | ||||||||
| Birth | Fomon | Multicompartment | 3.35 | 495 | 14.9 | 68.6 | 80.6 | 2830 | 12.8 | ||
| Birth | Hull | Peapod | Multiethnic/American | 3.25 | 409 | 12.3 | 2842 | ||||
| Birth | Au | Peapod | Multiethnic | 3.42 | 9.2 | 2947 | |||||
| Birth | Andersern | Peapod | Ethiopian | 3 | 7.8 | ||||||
| Birth | Harrington | MRI | Multiethnicb | 3.3 | 757 | 23.4 | |||||
| Birth | Olhager | MRIvDoubly labeled water | Swedish | 3.9 | 574 | 14 | 1107.4 | 66.4 | |||
| 0.5 | Butte | Multicompartmentc | Multiethnicd | 3.64 | 520 | 14.2 | 73.2 | 83.1 | 3350 | 12.2 | |
| 1 | Fomon | Multicompartment | 4.13 | 668 | 16.2 | 67.5 | 80.5 | 3780 | 12.7 | ||
| 1 | Olhager | MRI/Doubly labeled water | Swedish | 3.84 | 613 | 16 | 1014 | 64.2 | |||
| 1.5 | Andersen | Peapod | Ethiopian | 4.54 | 21.1 | ||||||
| 2 | Olhager | MRI/Doubly labeled water | Swedish | 5 | 1134 | 22.6 | 1693 | 61 | |||
| 3 | Fomon | Multicompartment | 5.74 | 1367 | 23.8 | 60.9 | 79.9 | 12 | |||
| 3 | Butte | Multicompartmentc | Multiethnicd | 6.03 | 1900 | 31.5 | 55.3 | 81.1 | 4370 | 10.2 | |
| 3 | Olhager | MRI/Doubly labeled water | Swedish | 5.57 | 1399 | 25 | 2088 | 57.4 | |||
| 3.5 | Andersen | Peapod | Ethiopian | 6.05 | 28.7 | ||||||
| 4 | Moulton | Chemical analyses | 77.8 | ||||||||
| 4 | Fomon | Multicompartment | 6.3 | 1585 | 25.2 | 59.6 | 79.7 | 11.9 | |||
| 4 | Olhager | MRI/Doubly labeled water | Swedish | 6.95 | 1796 | 25.8 | 2681 | 58.6 | |||
| 6 | Fomon | Multicompartment | 7.25 | 1915 | 26.4 | 58.4 | 79.4 | 12.9 | |||
| 6 | Butte | Multicompartmentc | Multiethnicd | 7.6 | 2440 | 28.8 | 54.9 | 80.7 | 5210 | 10.4 | |
| 6 | Andersen | Peapod | Ethiopian | 7.29 | 27.7 | ||||||
| 6 | Fields | Peapod | 7.12 | 1921 | 26.7 | 5188 | |||||
| 6 | Fields | DXA | 7.12 | 2284 | 31.1 | 5022 | |||||
| 12 | Fomon | Multicompartment | 9.18 | 2175 | 23.7 | 60.1 | 78.8 | 7860 | 12.9 | ||
| 12 | Butte | Multicompartmentc | Multiethnicd | 9.5 | 2620 | 27.6 | 56.9 | 78.8 | 6880 | 12.2 | |
Abbreviations: DXA, dual-energy X-ray absorptiometry; FFM, fat-free mass; FM, fat mass; MRI, magnetic resonance imaging; TATV, total adipose tissue volume; TBW, total body water.
20 Caucasian, 8 African/Afro-Caribbean, 2 Asian and 8 mixed-race infants.
Includes TBW by deuterium dilution, total body potassium counting and bone mineral content by DXA.
55 Caucasian, 7 African-American, 11 Hispanic and 3 Asian children.
Table 2.
Body composition changes from birth to 1 year in boys
| Boys | |||||||||||
|---|---|---|---|---|---|---|---|---|---|---|---|
|
| |||||||||||
| Age (months) | Authora | Method | Ethnicity | Weight (kg) | FM (g) | % FM | TATV (ml) | TBW (%) | TBW (% of FFM) | FFM (g) | % Protein |
| Birth | Moulton | Chemical analyses | 81.9 | ||||||||
| Birth | Fomon | Multicompartment | 3.5 | 468 | 13.7 | 69.6 | 80.6 | 3059 | 12.9 | ||
| Birth | Hull | Peapod | Multiethnic/American | 3.25 | 409 | 12.3 | 2842 | ||||
| Birth | Au | Peapod | Multiethnic | 3.42 | 9.2 | 2947 | |||||
| Birth | Andersern | Peapod | Ethiopian | 3.11 | 7.3 | ||||||
| Birth | Harrington | MRI | Multiethnicb | 3.3 | 757 | 23.4 | |||||
| Birth | Olhager | MRI/Doubly labeled water | Swedish | 3.8 | 495 | 12.8 | 961 | 69.9 | |||
| 0.5 | Butte | Multicompartmentc | Multiethnicd | 3.76 | 440 | 11.4 | 73.9 | 82.7 | 3350 | 12.5 | |
| 1 | Fomon | Multicompartment | 4.45 | 671 | 15.1 | 68.4 | 80.5 | 3780 | 12.9 | ||
| 1 | Olhager | MRI/Doubly labeled water | Swedish | 4.16 | 718 | 17 | 1114 | 66.6 | |||
| 1.5 | Andersen | Peapod | Ethiopian | 4.78 | 21.6 | ||||||
| 1.5 | Olhager | MRI/Doubly labeled water | Swedish | 5.2 | 1122 | 21.5 | 1675 | 62.6 | |||
| 2 | Olhager | MRI//Doubly labeled water | Swedish | 5.54 | 1320 | 23.8 | 1971 | 61.1 | |||
| 3 | Fomon | Multicompartment | 6.44 | 1495 | 23.2 | 61.4 | 80 | 12 | |||
| 3 | Butte | Multicompartmentc | Multiethnicd | 6.33 | 1910 | 30.2 | 56.5 | 81 | 4370 | 10.6 | |
| 3 | Olhager | MRI/Doubly labeled water | Swedish | 6.45 | 1582 | 24.3 | 2362 | 59 | |||
| 3.5 | Andersen | Peapod | Ethiopian | 6.3 | 26.7 | ||||||
| 4 | Moulton | Chemical analyses | 77.8 | ||||||||
| 4 | Fomon | Multicompartment | 7.06 | 1743 | 24.7 | 60.1 | 79.9 | 11.9 | |||
| 4 | Olhager | MRI/Doubly labeled water | Swedish | 6.74 | 1659 | 24 | 2476 | 57.2 | |||
| 6 | Fomon | Multicompartment | 8.03 | 2037 | 25.4 | 59.4 | 79.6 | 12 | |||
| 6 | Butte | Multicompartmentc | Multiethnicd | 8.04 | 2320 | 29.1 | 57.2 | 80.7 | 5630 | 10.9 | |
| 6 | Andersen | Peapod | Ethiopian | 7.52 | 26 | ||||||
| 6 | Fields | Peapod | 7.12 | 1921 | 26.7 | 5188 | |||||
| 6 | Fields | DXA | 7.12 | 2284 | 31.1 | 5022 | |||||
| 12 | Fomon | Multicompartment | 10.15 | 2287 | 22.5 | 61.2 | 79 | 7860 | 12.9 | ||
| 12 | Butte | Multicompartmentc | Multiethnicd | 10.03 | 2560 | 25.6 | 59 | 79.3 | 7400 | 12.3 | |
Abbreviations: DXA, dual-energy X-ray absorptiometry; FFM, fat-free mass; FM, fat mass; MRI, magnetic resonance imaging; TATV, total adipose tissue volume; TBW, total body water.
20 Caucasian, 8 African/Afro-Caribbean, 2 Asian and 8 mixed-race infants.
Includes TBW by deuterium dilution, total body potassium counting and bone mineral content by DXA.
55 Caucasian, 7 African-American, 11 Hispanic and 3 Asian children.
Table 3.
Reference values in multiethnic girls and boys, 3–5 yearsa
| Ethinicity | FM (kg) | %FM | FFM (kg) | BMC (g) |
|---|---|---|---|---|
| Girls | ||||
| White/European-American | 3.5 | 20.2 | 13.3 | 447 |
| Black/African-American | 3.8 | 21.1 | 12.8 | 430 |
| Hispanic/Mexican-American | 4.6 | 23.7 | 12.7 | 413 |
| Boys | ||||
| White/European-American | 2.92 | 17.6 | 13.25 | 423 |
| Black/African-American | 2.43 | 13.7 | 14.7 | 456 |
| Hispanic/Mexican-American | 3.28 | 20.4 | 12.1 | 403 |
Abbreviations: BMC, bone mineral content; FFM, fat-free mass; FM, fat mass.
Ellis.15
This review presents data from previously published studies that report on body composition during fetal development and what is known on body composition in newborns and the infant/child through 5 years. We also examine existing pediatric body composition measurement techniques beginning during fetal development, an understudied area of body composition, to 5 years of age and highlight new methods that are being developed to measure body composition. Gaps in knowledge are identified with respect to where information is needed so as to direct future research efforts.
SEARCH STRATEGY
Several text books were consulted to determine the appropriate terminology to use as search keywords to ensure that the appropriate and full array of relevant studies were discovered.16–20 PubMed searches up to June 2014 using the terms ‘fetal adiposity’, ‘fetal body composition’, ‘newborn adiposity’, ‘newborn body composition’, ‘infant adiposity’ and ‘infant total body water’ were conducted with limits of healthy human studies and English language, identifying 755 articles, excluding duplicates. Additional PubMed searches were conducted by adding key terms for cadaver body composition, imaging (ultrasound and MRI), anthropometry, air displacement plethysmography, hydrometry, dual-energy X-ray absorptiometry, 4-compartment model and quantitative magnetic resonance (EchoMRI Infants), with age limits from the fetus to 5 years. Predictors and outcomes of body composition changes of the fetus in utero and the infant/child ex utero were also identified. Papers were reviewed when they reported on changes in body composition during fetal development and after birth up to 5 years with reliable methods (high precision or low coefficient of variation based on repeated measures). Seminal papers related to the development and validation of assessment methods were also reviewed. The search process resulted in 121 sources that were incorporated in this review.
BODY COMPOSITION IN THE FETUS, NEWBORN AND INFANT
Fetal body composition
During the early fetal period, TBW or the hydration of fat-free mass (FFM) is relatively high, and it decreases slowly until term. Body fat and protein accretion of the fetus are slow during the first half of gestation (approximately weeks 1–20) and accelerate thereafter until term. Several published works (1923–1983) have summarized body composition data based on fetal cadaver analyses.12,20–23 Over the past 10 years, the first in vivo studies involving MRI-derived measures of tissue and organ masses were published.24–26 With the advent of this new technology, the characterization of fetal body composition in the clinical setting with high accuracy to diagnose the lean, overfat (mid-thigh or mid arm fat mass (FM) >95th percentile),27 small or large fetus and other body composition-related diseases is possible. Historical body composition studies of the fetus are described below.
Moulton coined the term chemical maturity to explain the age at which water, nitrogen and minerals (ash) reach constant levels in the body, which Moulton estimated to be between 500 and 1000 days of life.21 Moulton used data from chemical analyses by Fehling and Michel to study the composition of the human from gestation to adulthood, and noted that hydration of FFM rapidly decreased after conception (from 97.34% at 35 days in utero to 81.52% at term).21 Body nitrogen (0.30% nitrogen at 35 days in utero to 2.08% at term) and ash content (from 0.001 at 35 days in utero to 2.81 at term) increased21 (Figure 1). In humans, chemical and anatomical analysis of cadavers is the only direct method to measure body composition and the most reliable method for validation of new body composition instrumentation.17 However, because of the destructive nature of the technique, chemical analyses are either used in vitro with tissue samples or with the analysis of cadavers.
Figure 1.
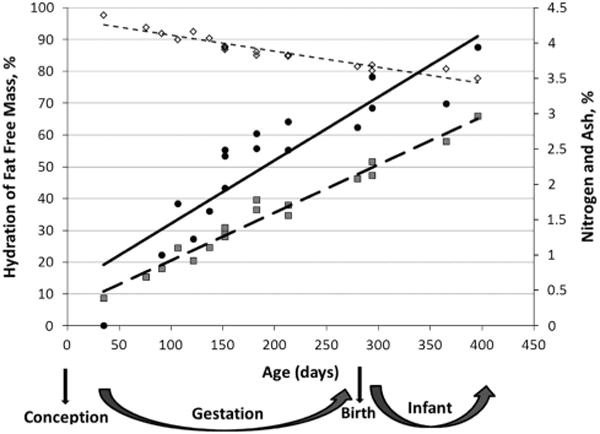
*Moulton:21 Effect of age on the composition of man. ◇ ([image]) Hydration of fat-free mass (%) = −0.05 × Age (days) + 96.31, R2 = 0.91 (SEE = 1.63%); ● ([image]), Ash (%) = 0.009 × Age (days) + 0.55, R2 = 0.81 (SEE = 0.443%); [image] ([image]), Nitrogen (%) = 0.007 × Age (days)+0.25, R2 = 0.97 (SEE = 1.123%).
Friis-Hansen22 reported that the hydration in early fetal life was ~ 92%, and Widdowson and Dickerson20 showed that it remained above 80% at term (shown as a function of body weight, Figure 2). Ziegler et al28 (Figure 3) reported similar values for hydration of FFM between 93 and 83%. Deposition of body fat in the fetus begins at around 25 weeks of gestation and continues until term. Ziegler et al28 showed the composition of gain of the reference fetus in 1-week intervals from 24 to 40 weeks. Water decreased from 82.1 to 51.7%, protein increased from 10.9 g at 24 weeks to 14.6 g at 40 weeks per week per 100 g gained and lipid increased from 4.7 to 28.9 g per week per 100 g gained, where protein and fat have similar accretion rates (Figure 3). Ziegler et al28 further described the composition of weight gain of the reference fetus at 4-week intervals, where protein increased at a rate of 10.8 g/day at 24–28 weeks, 12.2 g/day at 28–32 weeks, 13.3 g/day at 32–36 weeks and 13.9 g/day at 36–40 weeks. Lipid increased at a similar rate with 7.8 g/day at 24–28 weeks, 11.4 g/day at 28–32 weeks, 13.9 g/day at 32–36 weeks and 19.8 g/day at 36–40 weeks.
Figure 2.
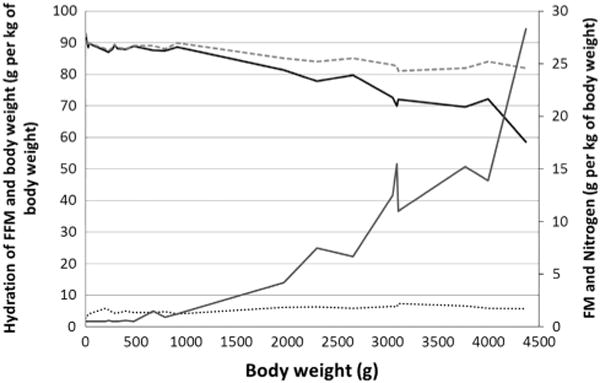
*Widdowson and Dickerson:20 Chemical composition of human fetuses and full-term babies. --- Hydration of fat free mass (g per kg of body weight); [image]Hydration of body weight (g/kg of body weight); □Fat mass (g/kg of body weight); …Nitrogen (g/kg of body weight), an index of protein.
Figure 3.
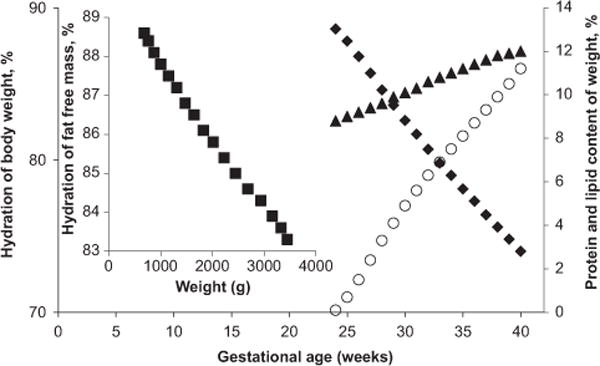
*Ziegler:28 Body composition of the reference fetus, ■, Hydration of fat-free mass (%, g/100 g FFM); ◆, Hydration of body weight (%, g/100 g of body weight); ▲, Protein content of body weight (%, g/100 g of body weight); ○, Lipid (%, g/100 g of body weight).
Fetal adipose tissue thickness by MRI at the trunk, lower and upper back and above the umbilical cord ranged from 2 mm at 29 weeks to 4.5 mm at 39–40 weeks of gestational age.4 Adipose tissue thickness of the extremities ranged from 2 mm at 29 weeks to 6 mm at 39–40 weeks of gestational age.4 Therefore, the ratio of extremity to trunk adipose tissue thickness was close to 1:1 at 29 weeks and 1.5:1 at 39–40 weeks of gestational age.4 Adipose tissue thickness between 18 and 26 weeks was visible but unquantifiable.4 These data are in agreement with fetal FM accretion and fast rate of increase, especially after 25 weeks of gestation.28 Adipose tissue thickness smaller than 5 mm, indicative of a small fetus by ultrasound, may be because of higher resolution by MRI.4 Using MRI at 40 weeks of gestation, Deans13 estimated that fetal %fat was 17.15 ± 3.83% (range 11.8–25%) for an average birth weight of 3.48 kg (range 2.94–4.30 kg).
The newborn
Rapid changes in body composition occur soon after birth.29 During the initial 24-h period, a newborn loses weight. Hull30 reported that the mean weights at 25–48 h and at 48–72 h after birth did not differ but were significantly less than the mean weight at <24 h (P < 0.0001). Others have reported a weight loss of 5–10% in the neonate during the first week after birth.16 This weight loss is attributed to a loss in body water but not FM.
The loss of water during the first days of life is an adaptation to the extrauterine environment in which the newborn’s skin is still maturing (keratinizing),19 and there is contraction of the extracellular water compartment soon after birth controlled by atrial natriuretic peptide and antidiuretic hormone.31,32 Such mechanisms of water equilibrium in the body have been described elsewhere.16 From over 100 years of cadaver studies, it is known that the newborn has higher TBW relative to body weight, which equates to a higher hydration of FFM than an older child at 1 year. Moulton21 noted that hydration of FFM rapidly decreased after birth (Tables 1 and 2). Comparisons of TBW and hydration of FFM can be found in Tables 1 and 2 for girls and boys, respectively.
Fomon14 described the body composition of the reference newborn using data and assumptions based on previous studies, specifically Widdowson33 (calcium, fat and protein (nitrogen × 6.25)), Brozek34 (osseous minerals as Ca/0.34), McGowan35 (assumed that the ratio of fat to body weight was the same as truncal skinfold thickness to body weight), Yssing and Friis-Hansen36 (TBW by deuterium dilution) and Burmeister37 (extracellular water). Carbohydrate was assumed to be 0.6% of FFM to estimate body composition of boys and girls during the newborn period and infancy. At birth, Fomon14 assumed that boys weighed on average 3.5 kg, whereas girls weighed 3.35 kg. Interpolation based on three ages (birth, 6 months and 9 years for boys and 10 years for girls) was done to obtain values for other ages.14
Tables 1 and 2 also summarize FM and FFM values from Fomon,14 Butte,38 Hull30 (PeaPod, multiethnic), Au39 (Peapod, multiethnic), Andersen40 (Peapod, Ethiopian), Harrington41 (MRI) and Olhager (MRI).42 Harrington41 showed that newborns have little intra-abdominal adipose tissue (10 g, s.d. 0.11 g), with most body fat being subcutaneous (693 (295) g or 21.44 (3.81) %)) (Supplementary Figure 1). Using MRI, others43 showed that subcutaneous body fat is predominant at birth and intra-abdominal adipose tissue is scarce. However, significant ethnic differences were apparent in adipose tissue distribution, indicating that abdominal obesity propensity may be detectable at birth (Supplementary Figure 2).43 At 2 weeks, Butte reported values of 440 g or 11.4% for FM in boys and 520 g or 14.2% body fat for girls.38 Recently, Andres44 reported %fat values, estimated using the Peapod, of 11.9 (4.6) % for White and African-American healthy breastfed boys and girls at 2 weeks after birth in the United States. Early-life reference body composition data are important in the diagnosis of the underfat or overfat infant and the effectiveness of obesity prevention efforts.
The first-year period
The most comprehensive works describing the body composition of the reference infant have been by Fomon14 and Butte.38 A limitation of Fomon’s reference infant is that his results were based on data from different published reports and made many assumptions and extrapolations (as described above) for the different ages reported.14 Butte38 conducted a longitudinal study using a multicompartment model involving TBW by deuterium dilution, total body potassium counting and bone mineral content (BMC) by DXA. Butte’s assumptions were as follows:38 TBW by deuterium dilution and total body potassium counting were used with the known concentrations of potassium in the intracellular (4 mEq/kg) and extracellular (150 mEq/kg) water compartments to calculate both intracellular and extracellular water. Protein mass was based on 16% nitrogen content in protein and on the ratio of nitrogen to potassium (461 mg/mEq). Glycogen was assumed to be 0.45% of body weight. BMC was calculated from DXA scans at 0.5, 12 and 24 months, whereas at 3, 6, 9 and 18 months the following equation was used for BMC:
From birth to 1 year, Fomon14 and Butte38 showed that TBW (as a percentage of body weight and as percentage of FFM) decreased, whereas FFM increases steadily from birth to 1 year (Tables 1 and 2).14,38 Compared with Fomon, Butte reported slightly lower values for protein as a percentage of body weight.38 At birth, different studies using the Peapod, MRI or multicompartment models have reported variable fat percentages in boys and girls that may be attributable to the different ethnicities studied (Tables 1 and 2). Butte reported higher %fat values in boys and girls compared with Fomon at 3 months, whereas Andres44 reported values in between (%fat in boys and girls of 24.1%). At 6 months, Butte reported higher %fat values compared with Fomon and Andersen, whereas Andersen reported higher %fat in their Ethiopian population using the Peapod compared with Fomon. Similar to Fomon, Olhager reported lower body fat values than Butte in boys and girls at 3 months.42 Using the Peapod, Fields et al reported the lowest average %fat of boys and girls at 26%, whereas they also reported the highest average %fat at 31% using DXA in the same study (Tables 1 and 2).45 At 1 year, Butte continued to report higher %fat values than Fomon.
DYNAMICS OF MACRONUTRIENT INTERACTIONS FROM INTAKE TO DEPOSITION
Although relationships between lean and fat tissue with weight change were first described by Forbes in adults,46 the dynamic interactions of energy intake, energy expenditure and tissue deposition in infants, in which lean mass is a smooth function of FM, were further modeled by Jordan and Hall.47 Using data from Butte et al,38,48 Jordan and Hall47 developed models that predicted significant adaptations in macronutrient use up to 2 years of age. They showed low-fat oxidation during the period of fastest growth (initial 6 months of life) and in the presence of positive energy balance, resulting in fat deposition. After this initial period, mathematical simulations estimated a constant level of fat intake during the first 2 years and increasing intake and oxidation of protein and carbohydrate.47 Thus, beyond the first 6 months, with fat intake remaining unchanged, the growth of lean body mass relative to body weight accelerates. Shifting the body composition curve-based data from Butte et al38,48 by ± 1 s.d. had no effect on the estimated energy intake or energy expenditure required for tissue deposition, suggesting the involvement of more complex physiologic mechanisms not explained by the model.47 Mechanisms of fat tissue deposition are possibly developed in utero, where the fetus uses glucose as its main substrate for energy, resulting in low-fat oxidation and high lipogenesis.47
Two to five years
During the first 5 years of life, children are active and minimally cooperative, compromising body composition procedures. To our knowledge, chemical analysis studies of cadavers for body composition have not been performed for children up to 5 years of age, and available data are based on indirect methods (skinfold thickness, BIA, DXA, and MRI). Using multicompartment models, Fomon14 provided data up to 10 years of age, whereas Butte38 provided longitudinal data up to 2 years.
Boys older than 1 year up to 5 years were reported to have 9.1 kg of FFM (protein as percentage of FFM of 13.5%, calculated as nitrogen × 6.25) at 18 months, 10.1 kg (14% protein) at 2 years and 16.0 kg (15.8% protein) at 5 years, and girls had 8.4 kg (13.5% protein) at 18 months, 9.5 kg (13.9% protein) at 2 years and 14.7 kg (15% protein) at 5 years.14 In another study, boys had 8.55 kg of FFM (12.9% body weight protein) at 18 months and 9.13 kg (13.5% body weight protein) at 2 years, whereas girls had 7.99 kg (12.7% protein) at 18 months and 8.99 kg (13.1% protein) at 2 years.38 At 2 years, body fat decreased to 19.5% for boys and 20.4% for girls, whereas at 5 years body fat was 14.6% in boys and 16.7% in girls.14 Ellis15 provided reference values in children, 3–5 years, and of different ethnic backgrounds using BIA, DXA and TBK (Table 3).
CURRENT BODY COMPOSITION MEASUREMENT METHODS IN THE FETUS
Cadaver analyses: in vitro measures
Cadaver analysis is the only method of direct body composition measurement that can serve as a gold standard for the validation of indirect methods. The analysis of cadavers for body composition is based on the dissection of whole-body tissues or samples of tissues and organs.49,50 Whole-body tissues can be used for chemical analysis to determine body components such as fat, water, nitrogen and protein, ash, calcium, phosphorus, sodium, potassium, magnesium, iron, copper, zinc and iodine.12 Anatomical analyses provide data on gross weights of the individual dissected components of the body, including skin, muscle, adipose tissue, bone and organs.51,52
The first fetal cadaver analysis for chemical (macronutrients and minerals) body composition was conducted by Albert Von Bezold53 on one fetus that weighed 523 grams (g). Widdowson and Spray12 extended Von Bezold’s work with fetuses of varying weights (1–3294 g). Widdowson12 performed chemical analyses on the content of nitrogen, fat, sodium, potassium, calcium, magnesium, phosphorus, iron, copper, zinc and iodine in 19 premature and full-term fetuses weighing 255–3994 g (17–40 weeks of gestational age). Early cadaver analyses were also summarized by Moulton,21 Widdowson and Dickerson,20 Ziegler28 and Friis-Hansen (Figures 1–3).22 Cadaver analysis is the only direct method to estimate body composition, and it is considered the gold standard to which indirect methods would ideally be compared with for validation. However, the complexity and time-consuming effort of the technique makes it almost impossible to conduct in research settings within hospitals. Limited data on infants and children exist, and further research is needed with respect to composition of the lean, fat and water masses of the fetus.
Imaging
Fetal ultrasound
Ultrasound is used to estimate fetal weight, size and body composition in utero. Assessment of lean or FFM and FM tissues by ultrasound can aid in determining abnormally small or large fetuses by detecting abnormal tissue thickness (abdominal subcutaneous adipose tissue thickness less than 5 mm by ultrasound at 38 weeks).2,3 Ultrasound body composition estimates are based on a two-compartment model.54 Fetal body composition estimates by ultrasound55,56 were compared with newborn body composition with ADP, and only modest associations of neonatal %fat with fetal biometry were found.57,58 However, no validation studies comparing ultrasound measurements against cadaver anatomical analyses for the dissection of fetal fat, lean mass and body water have been conducted. Therefore, it is unclear how accurate ultrasound measurements are for fetal body composition.
The principal measurement sites are the subcutaneous wall of the abdomen, arm and thigh.59 Extremity adipose tissue thickness measurements can be estimated using axial ultrasound images by subtracting the central lean area (muscle and bone) of the limb from the total axial limb area.54,59 Bernstein55 reported poor reproducibility of ultrasound fetal body composition assessment with intraobserver coefficient of variance (CV) for the anterior thigh wall thickness of 27.8%, the anterior abdominal wall thickness of 12.8% and the abdominal wall thickness of 9%, and suggested that the error was related to bias from external compression of the tissues. Bernstein56 later reported improved CV for mid-thigh lean mass and mid-arm lean mass of 4.9 and 7.5%, respectively, in 10 fetuses. Mid-thigh adipose tissue thickness CV was 12.1% and mid-arm adipose tissue thickness CV was 10.8%.56 Larciprete27 recommended the measurement of the fat area in the proximal (upper) extremities instead of a simple linear measurement of adipose tissue thickness across the extremity because of potential introduction of error arising from tissue compression and large interobserver CV. Intraobserver CV for adipose tissue thickness was 7.9–8.4% and interobserver CV was 9.8–10.9%.27 For lean mass, intraobserver CV was 5.7–7.5% and interobserver CV was 7.0–9.7%.27
Ultrasound can detect and quantify changes in fetal FM that are correlated with fetal weight change.55,60 Fetal weight is estimated using biometric measurements (abdominal circumference, head circumference and femoral length) by Hadlock’s formula61 (log 10 EFW = 1.326–0.00326 (AC) (FL)+0.0107 (HC)+0.0438 (AC)+0.158 (FL). At high altitudes (high risk for hypoxia), for example, fetuses weighed significantly less than fetuses at sea level (2991 ± 79 g versus 3247 ± 96 g; P = 0.04) because of less fetal abdominal wall thickness, and mid-upper arm and mid-thigh subcutaneous FM, but not lean mass.62 Smaller abdominal wall thickness by ultrasound was associated with intrauterine growth restriction independent of birth weight in 137 fetuses from unselected singleton pregnancies at 20, 26, 31 and 38 weeks of gestation.2 Others found that gestational weight gain above that recommended by the Institute of Medicine,18 regardless of pre-pregnancy body mass index, was associated with larger babies because of greater fetal abdominal lean mass.63 Fetuses of mothers with gestational diabetes mellitus are also fatter (mid-thigh FM area at 37–40 weeks gestation 11.86 versus 14.22 cm2, P = 0.02 in normal versus gestational diabetes mellitus mothers) and have slightly higher lean mass than fetuses from mothers without gestational diabetes mellitus.27
Advantages of fetal ultrasound include the following: (1) fetal adipose and lean tissue thickness assessment can aid in the detection of the small or large fetus. Limitations of fetal ultrasound include the following: (1) measurements based on biometric parameters may not adequately represent small or macrosomic fetuses because of differences in fetal size related to race, fetal gender, maternal size and parity;57,64–66 (2) different values for fetal density (in grams of body weight per milliliter of body volume) were suggested (1.03–1.07 g/cm3 48 h before delivery,66,67 and 1.04 g/cm3 close to term and 1.06 g/cm3 before term),68 but there is no consensus, as fetal density changes with gestational age and estimated fetal weight may not be accurate; (3) estimation of fetal weight based on fetal density was shown to be inaccurate when compared with MRI;66,68 and (4) studies have not characterized visceral adipose tissue using ultrasound because of the large error involved in the measurement and poor resolution.
Fetal MRI
MRI can provide estimates of subcutaneous adipose tissue thickness and adipose tissue volume in utero.4,69–71 Several studies evaluated the reliability of fetal adipose tissue thickness measured by MRI as a promising technique in the clinical setting to evaluate fetal nutritional and developmental status. Early studies reported poor resolution related to fetal or maternal movement but prominently depicted fetal subcutaneous adipose tissue thickness.69,71 More recently, fetal subcutaneous adipose tissue thickness was imaged using a 1.5 T MRI scanner from 29 weeks of gestational age on T1-weighted images.4 MRI can also aid in the estimation of fetal density by dividing birth weight (g) by fetal body volume by MRI (ml).68 Furthermore, fetal weight can be estimated using the equation: fetal weight (MRI) = 0.12+1.031 (fetal body volume).67
The advantages of fetal MRI are as follows: (1) its use during pregnancy has no established risks; and (2) MRI has the capacity to image fetal anatomy and body tissues composition.13,69,72,73 Limitations of fetal MRI include the following: (1) it is sensitive to movement; (2) training is required for accurate interpretation; (3) access may be limited because of high cost; and (4) it has not been validated against cadaver analyses, but it has been validated at 40 weeks of gestation against newborn total fat percentage.13
CURRENT BODY COMPOSITION MEASUREMENT METHODS FROM BIRTH TO 5 YEARS
Anthropometry
Anthropometry includes length (nonstanding infants), stature or height (for standing children), body weight, circumferences of body regions, skeletal breadths and skinfold thickness. When used to estimate FM, FFM and %fat, anthropometry measurements usually have large errors at the individual level and smaller errors at the group level.74 This depends on the prediction equation used because of large measurement error compared with the criterion measures such as deuterium dilution.74
Body composition is estimated by applying the measured variables in prediction equations derived from populations similar to the one being studied. Such equations are based on studies with more accurate body composition methods, such as densitometry, hydrometry or DXA. Prediction equations are population specific, and thus it is assumed that the developed equations can be generalized to similar populations. Such measurements usually give reliable estimates of regional body fatness (for example, subcutaneous adipose tissue in the extremities and in the trunk).75
Validated pediatric prediction equations are available for the estimation of FM, %FM, FFM and body density based on skinfold thickness;5–8 it is predominately based on triceps and subscapular skinfolds. For newborns and infants, there is controversy because of the large variations in TBW76 and low correlation between skinfolds and body fat estimates by more accurate methods including hydrometry and MRI.77,78
Circumferences provide information related to body size and proportions. In infants and children, mid-upper arm, waist, hip and thigh circumferences provide information on body fat distribution, and head circumference predicts adiposity rebound.79 Small head circumference at birth predicts an early adiposity rebound, which predicts obesity and type 2 diabetes and coronary heart disease later in life.80 Specifically, waist circumference has been used as an indicator of subcutaneous and visceral adipose tissue from birth to 5 years.81 However, studies of waist circumference as a predictor of visceral adipose tissue by MRI in newborns showed that ultrasound VAT (r = 0.48, P < 0.05) but not waist circumference (r = 0.08, P > 0.05) was significantly correlated with VAT by MRI.82 This implies an association that should be further investigated, as waist circumference cannot differentiate between SAT and VAT tissues, whereas ultrasound can separate SAT from VAT. Between 4 and 10 years of age, waist circumference poorly estimated VAT compared with computed tomography.79 A meta-analysis showed that waist circumference accounted for 64.8% of the variance in visceral adipose tissue in children.83 Circumference measurements alone have a low sensitivity at early ages.82
Advantages of anthropometry include the following: (1) it can be applied in settings requiring little and inexpensive equipment. Limitations of anthropometry include the following: (1) training must be conducted by a trained technician to achieve high precision (low intraobserver variability);84,85 and (2) one challenge of the technique for use in pediatric populations is that newborns (0–1 month), infants (aged 1–12 months) and children are required to be calm and cooperative—otherwise, error may result from movement of a hungry, thirsty or fussy child.
Air displacement plethysmography
ADP is a densitometric technique that relies on the use of Boyle’s and Poison’s gas laws to estimate body volume by displacing air inside an enclosed chamber. It is considered an accurate method for body composition assessment based on a two-compartment model.17,34 The PeaPod (Cosmed) uses the ADP approach for infants up to 8 kg, which calculates %FM using age- and sex-specific density constants.9,38 It was recently validated against deuterium dilution in preterm infants, showing a nonsignificant mean difference of 0.32% fat between the two methods.86 Unlike the BodPod, in which thoracic gas volume is estimated by puffing air through a tube tightly inserted in the mouth, in infants residual thoracic volume is estimated, as a direct measurement would be invasive.9
A pediatric adapter (a type of seat) for children aged 2–6 years and weighing larger than 8 kg inserted into the BodPod (adult version of the PeaPod, Cosmed) was developed in an attempt to allow for longitudinal measures from childhood by the same technology.87 Compared with the 4C model (3.5% CV for %fat),87 with or without the adapter, the BodPod was shown to be inaccurate for use in infants and children less than 7 years because of compliance issues that include movements, talking and crying during the test.87 At this time, infants weighing >8 kg (~6 months) and less than 2 years of age cannot be measured by ADP.87
Advantages of the PeaPod include the following: (1) It is a noninvasive quick and safe method, and it does not require sedation. Limitations of the PeaPod include the following: (1) an upper weight limit of 8 kg (approximately 6 months of age), and the assumptions underlying estimates;17 and (2) age- and sex-specific density of FFM constants applied may not be appropriate for all infants because of the rapid changes in body water in the early weeks of life and in some disease states with abnormal body water.
Hydrometry
Hydrometry, as the name suggests, estimates TBW. Naturally occurring isotopes (2H or 18O) in the body are measured by sampling blood, saliva or urine samples before dosing, and then an oral dose of labeled water 2H2O or is administered, and a final blood, urine or saliva sample is acquired to measure the amount distributed in body fluids. Hydrometry functions under the assumption that ‘the volume of the compartment is equal to the amount of tracer added to the compartment divided by the concentration of the tracer in that compartment’.11,88 The dilution space (N in g) is calculated as N = (WA/a)(Sa − St) f/(Ss−Sp); W is the mass of water used to dilute the dose, A is the dose given to the subject, a is the mass of dose in the prepared dilute dose, f is the fractionation factor for the physiological sample relative to body water, Sa is the measured value for the diluted dose, St the value for tap water in the dilution, Ss the value for the post-dose sample and Sp is the value for the predose sample.88 This approach assumes the following: (1) that the tracer distributes only in the body’s water pool and that the distribution is equal throughout the body’s water pool, (2) rapid equilibration and (3) that the tracer is not metabolized during equilibration.88
The main advantage of this technique is its high accuracy and precision (1–2% CV).89,90 Limitations of this technique for infant measurement include the following: (1) attention to detail is necessary to avoid estimation errors due to spillage when administering the dose and the difficulties obtaining sufficient infant saliva or urine samples; (2) the assumptions may not be valid for infants who need to be fed during the equilibration period, where TBW is constantly changing; (3) because of ongoing and rapid changes in the hydration of FFM in the newborn period, the use of hydration constants to estimate body composition in a 2-compartment model may introduce error at the individual level.88,91
Dual-energy X-ray absorptiometry
DXA uses an X-ray tube with a filter that divides an X-ray beam into peaks of low and high densities.92 The tissues can be differentiated by the attenuation capacity according to their radiographic density.92
Attempts to validate DXA for pediatric populations have been made using piglet carcass analysis. Moderate CV values for BMC (mean 2.3%, range 0.6–4.3 for small piglets, and mean 1.5%, range 0.1–3.4% for large piglets) and FM (small piglets mean 6.3%, range 2.8–12.2%, large piglets mean 3.3%, range 0.9–5.7%) were found.93 Others found that, compared with carcass analysis, DXA significantly overestimated bone mineral density and lean mass and underestimated FM (CV 13.5%) in 12-week-old piglets, and these differences were attributed to an increased hydration of FFM.94 However, Testolin95 reported that, based on theoretical calculations, by modeling reference body composition values from birth to 10 years, small clinically irrelevant %fat errors of up to 0.8% would arise when adult constants for lean soft tissue were used for pediatric populations. Koo96 found significant deficiencies in the DXA measurement of bone mineral mass and lean and fat tissues using the piglet model and the manufacturer’s software for infants and children. Compared with ADP, %fat and FM were overestimated by DXA, whereas FFM was underestimated.45 Fields and Goran97 found significant discrepancies between DXA and the 4C model in children (mean age 11.4 ± 1.4 years) and reported that the assessment of FM can be improved if a correction factor is used (Fat mass = (0.78 × DXA lean) +(0.16 × body wt)+0.34 kg).
Some advantages of this technique are as follows: (1) DXA is fast and precise; (2) DXA separates bone from the remaining FFM tissues, therefore providing estimates for three components: fat, bone and bone-free lean mass; (3) DXA provides component estimates for the whole body and regions (arms, legs and trunk). Some limitations of DXA are as follows: (1) subjects are exposed to radiation (1–5 μSv)98 where without pediatric programing, the effective dose can be up to three times higher than for adults;99 (2) in pediatric populations, the changes in bone structure (cartilage, ossification and formation of articular cartilage) due to growth can introduce error in the interpretation of DXA results;100 and (3) the increased and changing hydration of FFM in infants may lead to inaccurate fat and lean mass estimates.95
Four-compartment model
The most commonly used four components of a 4C model include TBW by a dilution method, total body BMC by DXA, body weight and body volume (converted to body density) by ADP or hydrostatic weighing. The 4C model is considered as close to a gold standard for body composition assessment as is possible today,75 and it has been used in studies of infants/children as young as 8 years.101 The following equation by Lohman102 is commonly applied in studies that use the 4C model for body composition from 1 year to 16 years:103
Db refers to body density in g/cm3, w is water content of the body in liters and b is bone mineral content in kilograms expressed as a fraction of body mass (DXA bone mineral × 1.22).
An advantage of the 4C technique is that assumptions related to hydration, BMC and body density are removed, as these components are individually measured. A limitation of the 4C model is the exposure to a low dose of radiation from the DXA test, which is associated with some degree of risk. This method is thus more appropriate for older children than for newborns.
Magnetic resonance imaging
In the infant and child, MRI can provide estimates of visceral adipose tissue, subcutaneous adipose tissue, hepatic adipose tissue, pancreatic adipose tissue and intermuscular adipose tissue volume quickly and with high resolution.42,104–106 Advantages of MRI include the following: (1) it is safe in all age groups; (2) MRI is the only technique available that allows for the quantification of tissues in vivo (without harmful side effects); and (3) MRI was validated for accuracy in vitro and reproducibility in vivo.107 Assessment of whole-body FM had good reproducibility (CV 2.6–3.4%) in vivo in 67-day-old infants (22–154 days), and in vitro studies resulted in high accuracy for subcutaneous fat in infant-like phantoms.107 Limitations include the following: (1) MRI is sensitive to movement, and subject cooperation is required; (2) technical training is required for accurate interpretation of the images; (3) access is limited and cost is high; and (4) a large number of infant and child cadavers are needed for validation of body composition by MRI. MRI validation studies can potentially increase our knowledge of body composition during key periods of growth and development and would reinforce its practicality in the clinical setting.
METHODS UNDER DEVELOPMENT FROM BIRTH TO 1 YEAR
Infant EchoMRI system
Quantitative magnetic resonance has been validated for adult body composition and small animals, including piglets. A concise description of nuclear magnetic resonance basics is given by Taicher.108 Briefly, the quantitative magnetic resonance approach is a nonimaging technique that uses a static magnetic field to detect the hydrogen atoms of fat, lean tissue and water by their particular spin characteristics determined by their environment or tissue they are attached to. The radiofrequency relaxation signal from the hydrogen atoms in the whole body is obtained to estimate FM, FFM, free water (water not bound to tissues) and TBW. Validation studies have been conducted for the EchoMRI-AH (EchoMRI, Houston, TX, USA) in adults109,110 and small animals111–113 (using the EchoMRI-500, EchoMRI-700, EchoMRI-900 and EchoMRI-1100 (EchoMRI)), and these systems are reported to be able to detect small changes in body fat with high precision. The technique provides estimates of fat, lean mass and body water. For infants, the EchoMRI-AH/Small measures body composition of infants, children and adolescents up to 50 kg,114 and the EchoMRI-Infants measures infants up to 12 kg. The EchoMRI-AH/Small was validated against chemical analysis using piglets114 and against deuterium dilution and the 4C model in piglets weighing 3.3–49.9 kg.115 The EchoMRI-Infants was validated in piglets and reported excellent precision for FM (mean coefficient of variation of 1.8% compared with 3.1% for DXA in piglets weighing 2–12 kg).116 Kovner117 and Taicher118 reported good precision and accuracy in validation studies with piglets weighing up to 12 kg comparing the EchoMRI-Infants with DXA and chemical analysis. The EchoMRI-Infants has yet to be validated in infants.
Preliminary data from our laboratory119 using the EchoMRI-Infants in newborns between 12 and 69 h after birth show high precision (small coefficient of variation) for measuring infant body fat, lean and body water. Mean weight (s.d., range) was 3.13 kg (0.44, 2.64–4.19 kg), mean fat was 0.54 kg (0.20, 0.07–0.88 kg), lean mass was 2.32 (0.28, 2.0–2.9 kg), TBW was 2.42 (0.31, 2.12–3.10 kg) and %fat 16.65% (2.67, range 12.53–20.71%) for boys and girls. Reproducibility was excellent with a CV of 2.09% for total body fat, 0.98% for lean mass and 0.81% for TBW. This system has yet to be validated against the dilution method for TBW measures in infants. Advantages of the EchoMRI include the following: (1) it does not use ionizing radiation, and it can be repeated many times in a day or between days allowing the assessment of small changes in FM with high sensitivity;119 (2) different versions of the instrument allow for measurement of subjects of various weight ranges, particularly the EchoMRI-Infants allows for measurements up to 12 kg and can be used for children up to 1 year of age; and (3) measurement time is short (<4 min), and movement of the infant does not affect the measurement, and thus no sedation is required.
FUTURE DIRECTIONS
Since the work of Widdowson12,20 on the chemical composition of the fetus, the field of body composition has focused on the use of indirect methods,29 and more recent studies involving autopsies for body composition are limited. Fomon reported that the single most important missing data component was BMC of children.14 Subsequently, Butte38 performed DXA scans at 0.5, 3, 6, 9, 12, 18 and 24 months of age. Yet, given the limitations of DXA in infants and children, such as the nonuniform changes in bone volume that cannot be accounted for because of the aerial nature of the measurement (instead of three-dimensional) creating errors in bone mineral density over time during follow-up studies, further inquiry is needed.98 One important limitation in the study of human fetal, infant and child body composition is the lack of a single body composition measurement technique validated for measures throughout life beginning during gestation. MRI has the potential to be such a measurement method, but it has not yet been validated longitudinally, beginning in utero. However, doing so would significantly increase our knowledge of body composition during key periods of growth and development and aid in the diagnosis of clinically relevant body composition distribution anomalies. Methods such as EchoMRI-Infants also hold great potential to assess body composition with high precision and accuracy throughout life, beginning at birth.
This review systematically presents data from previously published studies that report on body composition (the accretion of body tissues) during fetal development. For this information to be translatable to clinical applications, we present what is known on body composition in newborns and the infant/child through 5 years of age to maximize the practicality of this review to researchers and clinicians. From the published literature, it can be inferred that fetal body composition serves as a proxy for the nutritional status of the fetus and predicts morbidity and mortality later in life. Monitoring body composition changes could shed light on risk or outcome of survival for the small fetus and underweight or obese child. It is our hope that this review sheds light on the advantages and limitations of different body composition methods that may assist the clinician in the characterization of health status from fetal, infant and child body composition.
Supplementary Material
Acknowledgments
We gratefully acknowledge Martica Heaner, PhD for her editorial assistance. This study was supported by National Institutes of Health Grants UO1-DK-094463 (Diversityfellowship); P30-DK-26687; UL1-TR000040.
Footnotes
CONFLICT OF INTEREST
The authors declare no conflict of interest.
Supplementary Information accompanies this paper on European Journal of Clinical Nutrition website (http://www.nature.com/ejcn)
References
- 1.Wells JC, Fewtrell MS. Is body composition important for paediatricians? Arch Dis Child. 2008;93:168–172. doi: 10.1136/adc.2007.115741. [DOI] [PubMed] [Google Scholar]
- 2.Gardeil F, Greene R, Stuart B, Turner MJ. Subcutaneous fat in the fetal abdomen as a predictor of growth restriction. Obstet Gynecol. 1999;94:209–212. doi: 10.1016/s0029-7844(99)00270-7. [DOI] [PubMed] [Google Scholar]
- 3.Skinner J, O’Donoghue K, Gardeil F, Greene R, Turner MJ. Is fetal abdominal subcutaneous fat comparable with established indices of growth restriction? J Obst Gynaecol. 2001;21:439–442. doi: 10.1080/01443610120071947. [DOI] [PubMed] [Google Scholar]
- 4.Berger-Kulemann V, Brugger PC, Reisegger M, Klein K, Hachemian N, Koelblinger C, et al. Quantification of the subcutaneous fat layer with MRI in fetuses of healthy mothers with no underlying metabolic disease vs. fetuses of diabetic and obese mothers. J Perinat Med. 2012;40:179–184. doi: 10.1515/JPM.2011.122. [DOI] [PubMed] [Google Scholar]
- 5.Slaughter MH, Lohman TG, Boileau RA, Horswill CA, Stillman RJ, Van Loan MD, et al. Skinfold equations for estimation of body fatness in children and youth. Human Biol. 1988;60:709–723. [PubMed] [Google Scholar]
- 6.Janz KF, Nielsen DH, Cassady SL, Cook JS, Wu YT, Hansen JR. Cross-validation of the Slaughter skinfold equations for children and adolescents. Med Sci Sports Exerc. 1993;25:1070–1076. [PubMed] [Google Scholar]
- 7.Sen B, Bose K, Shaikh S, Mahalanabis D. Prediction equations for body-fat percentage in Indian infants and young children using skinfold thickness and mid-arm circumference. J Health Popul Nutr. 2010;28:221–229. doi: 10.3329/jhpn.v28i3.5548. [DOI] [PMC free article] [PubMed] [Google Scholar]
- 8.Hoffman DJ, Toro-Ramos T, Sawaya AL, Roberts SB, Rondo P. Estimating total body fat using a skinfold prediction equation in Brazilian children. Ann Human Biol. 2012;39:156–160. doi: 10.3109/03014460.2012.660989. [DOI] [PubMed] [Google Scholar]
- 9.Urlando A, Dempster P, Aitkens S. A new air displacement plethysmograph for the measurement of body composition in infants. Pediatr Res. 2003;53:486–492. doi: 10.1203/01.PDR.0000049669.74793.E3. [DOI] [PubMed] [Google Scholar]
- 10.Dempster P, Aitkens S. A new air displacement method for the determination of human body composition. Med Sci Sports Exerc. 1995;27:1692–1697. [PubMed] [Google Scholar]
- 11.Cardozo RH, Edelman IS. The volume of distribution of sodium thiosulfate as a measure of the extracellular fluid space. J Clin Invest. 1952;31:280–290. doi: 10.1172/JCI102604. [DOI] [PMC free article] [PubMed] [Google Scholar]
- 12.Widdowson EM, Spray CM. Chemical development in utero. Arch Dis Child. 1951;26:205–214. doi: 10.1136/adc.26.127.205. [DOI] [PMC free article] [PubMed] [Google Scholar]
- 13.Deans HE, Smith FW, Lloyd DJ, Law AN, Sutherland HW. Fetal fat measurement by magnetic resonance imaging. Br J Radiol. 1989;62:603–607. doi: 10.1259/0007-1285-62-739-603. [DOI] [PubMed] [Google Scholar]
- 14.Fomon SJ, Haschke F, Ziegler EE, Nelson SE. Body composition of reference children from birth to age 10 years. Am J Clin Nutr. 1982;35:1169–1175. doi: 10.1093/ajcn/35.5.1169. [DOI] [PubMed] [Google Scholar]
- 15.Ellis KJ. Human body composition: in vivo methods. Physiol Rev. 2000;80:649–680. doi: 10.1152/physrev.2000.80.2.649. [DOI] [PubMed] [Google Scholar]
- 16.Barbosa Baker, Meio MD, Lopes Moreira ME. Total body water in newborns. In: Preedy VR, editor. Handbook of Anthropometry: Physical Measures of Human Form in Health and Disease 2. Springer Science+Business Media LLC; New York: 2012. p. 1121. [Google Scholar]
- 17.Heymsfield S, Lohman T, Wang Z-M, Going S. In: Human Body Composition. 2nd. Going SB, editor. Human Kinetics Publishers; Champaign, IL, USA: 2005. [Google Scholar]
- 18.Institute of Medicine (IOM) Weight Gain During Pregnancy: Reexamining the Guidelines. National Academic Press; Washington, DC: 2009. [PubMed] [Google Scholar]
- 19.Sridhar S, Baumgart S. Water and electrolyte balance in newborn infants. In: Thrureen PJ, Hay WW, editors. Neonatal Nutrition and Metabolism. Cambridge University Press; Cambridge: 2006. pp. 104–114. [Google Scholar]
- 20.Widdowson EM, Dickerson JWT. Chemical composition of the body. In: Comar CL, Bronner F, editors. Mineral Metabolism, An Advanced Treatise II, Part A. Academic: New York; 1964. pp. 1–247. [Google Scholar]
- 21.Moulton CR. Age and chemical development in mammals. J Biol Chem. 1923;57:79–97. [Google Scholar]
- 22.Friis-Hansen B. Water distribution in the foetus and newborn infant. Acta Paediatr Scand Suppl. 1983;305:7–11. doi: 10.1111/j.1651-2227.1983.tb09852.x. [DOI] [PubMed] [Google Scholar]
- 23.Ziegler EE. Body composition of the reference fetus. Growth. 1976;40:329–341. [PubMed] [Google Scholar]
- 24.Votino C, Verhoye M, Segers V, Cannie M, Bessieres B, Cos T, et al. Fetal organ weight estimation by postmortem high-field magnetic resonance imaging before 20 weeks’ gestation. Ultrasound Obstet Gynecol. 2012;39:673–678. doi: 10.1002/uog.11151. [DOI] [PubMed] [Google Scholar]
- 25.Thayyil S, Schievano S, Robertson NJ, Jones R, Chitty LS, Sebire NJ, et al. A semi-automated method for non-invasive internal organ weight estimation by post-mortem magnetic resonance imaging in fetuses, newborns and children. Eur J Radiol. 2009;72:321–326. doi: 10.1016/j.ejrad.2008.07.013. [DOI] [PubMed] [Google Scholar]
- 26.Thayyil S, Cleary JO, Sebire NJ, Scott RJ, Chong K, Gunny R, et al. Post-mortem examination of human fetuses: a comparison of whole-body high-field MRI at 9.4 T with conventional MRI and invasive autopsy. Lancet. 2009;374:467–475. doi: 10.1016/S0140-6736(09)60913-2. [DOI] [PubMed] [Google Scholar]
- 27.Larciprete G, Valensise H, Vasapollo B, Novelli GP, Parretti E, Altomare F, et al. Fetal subcutaneous tissue thickness (SCTT) in healthy and gestational diabetic pregnancies. Ultrasound Obstet Gynecol. 2003;22:591–597. doi: 10.1002/uog.926. [DOI] [PubMed] [Google Scholar]
- 28.Ziegler EE, O’Donnell AM, Nelson SE, Fomon SJ. Body composition of the reference fetus. Growth. 1976;40:329–341. [PubMed] [Google Scholar]
- 29.Demerath EW, Fields DA. Body composition assessment in the infant. Am J Hum Biol. 2014;26:291–304. doi: 10.1002/ajhb.22500. [DOI] [PMC free article] [PubMed] [Google Scholar]
- 30.Hull HR, Thornton JC, Ji Y, Paley C, Rosenn B, Mathews P, et al. Higher infant body fat with excessive gestational weight gain in overweight women. Am J Obstet Gynecol. 2011;205:e1–e7. doi: 10.1016/j.ajog.2011.04.004. [DOI] [PMC free article] [PubMed] [Google Scholar]
- 31.Modi N, Bétrémieux P, Midgley J, Hartnoll G. Postnatal weight loss and contraction of the extracellular compartment is triggered by atrial natriuretic peptide. Early Hum Dev. 2000;59:201–208. doi: 10.1016/s0378-3782(00)00097-9. [DOI] [PubMed] [Google Scholar]
- 32.Modi N. Clinical implications of postnatal alterations in body water distribution. Semin Neonatol. 2003;8:301–306. doi: 10.1016/S1084-2756(03)00043-5. [DOI] [PubMed] [Google Scholar]
- 33.Widdowson EM. Nutrition from conception to extreme old age. Food Nutr (Roma) 1982;8:32–40. [PubMed] [Google Scholar]
- 34.Brozek J, Grande F, Anderson JT, Keys A. Densitometric analysis of body composition: revision of some quantitative assumptions. Ann NY Acad Sci. 1963;110:113–140. doi: 10.1111/j.1749-6632.1963.tb17079.x. [DOI] [PubMed] [Google Scholar]
- 35.McGowan A, Jordan M, MacGregor J. Skinfold thickness in neonates. Biol Neonate. 1974;25:66–84. doi: 10.1159/000240680. [DOI] [PubMed] [Google Scholar]
- 36.Yssing M, Friis-Hansen B. Body composition of newborn infants. Acta Paediatr. 1965;54:117–118. [Google Scholar]
- 37.Burmeister W. The extracellular (thiosulfate) space in the human body during growth. Ann Univ Sarav Med. 1961;9:167–219. [PubMed] [Google Scholar]
- 38.Butte NF, Hopkinson JM, Wong WW, Smith EO, Ellis KJ. Body composition during the first 2 years of life: an updated reference. Pediatr Res. 2000;47:578–585. doi: 10.1203/00006450-200005000-00004. [DOI] [PubMed] [Google Scholar]
- 39.Au CP, Raynes-Greenow CH, Turner RM, Carberry AE, Jeffery H. Fetal and maternal factors associated with neonatal adiposity as measured by air displacement plethysmography: a large cross-sectional study. Early Hum Dev. 2013;89:839–843. doi: 10.1016/j.earlhumdev.2013.07.028. [DOI] [PubMed] [Google Scholar]
- 40.Andersen GS, Girma T, Wells JC, Kaestel P, Leventi M, Hother AL, et al. Body composition from birth to 6 mo of age in Ethiopian infants: reference data obtained by air-displacement plethysmography. Am J Clin Nutr. 2013;98:885–894. doi: 10.3945/ajcn.113.063032. [DOI] [PubMed] [Google Scholar]
- 41.Harrington TA, Thomas EL, Frost G, Modi N, Bell JD. Distribution of adipose tissue in the newborn. Pediatr Res. 2004;55:437–441. doi: 10.1203/01.PDR.0000111202.29433.2D. [DOI] [PubMed] [Google Scholar]
- 42.Olhager E, Flinke E, Hannerstad U, Forsum E. Studies on human body composition during the first 4 months of life using magnetic resonance imaging and isotope dilution. Pediatr Res. 2003;54:906–912. doi: 10.1203/01.PDR.0000088064.63106.5E. [DOI] [PubMed] [Google Scholar]
- 43.Modi N, Thomas EL, Uthaya SN, Umranikar S, Bell JD, Yajnik C. Whole body magnetic resonance imaging of healthy newborn infants demonstrates increased central adiposity in Asian Indians. Pediatr Res. 2009;65:584–587. doi: 10.1203/pdr.0b013e31819d98be. [DOI] [PubMed] [Google Scholar]
- 44.Andres A, Shankar K, Badger TM. Body fat mass of exclusively breastfed infants born to overweight mothers. J Acad Nutr Diet. 2012;112:991–995. doi: 10.1016/j.jand.2012.03.031. [DOI] [PubMed] [Google Scholar]
- 45.Fields DA, Demerath EW, Pietrobelli A, Chandler-Laney PC. Body composition at 6 months of life: comparison of air displacement plethysmography and dual-energy X-ray absorptiometry. Obesity. 2012;20:2302–2306. doi: 10.1038/oby.2012.102. [DOI] [PubMed] [Google Scholar]
- 46.Forbes GB. Lean body mass-body fat interrelationships in humans. Nutr Rev. 1987;45:225–231. doi: 10.1111/j.1753-4887.1987.tb02684.x. [DOI] [PubMed] [Google Scholar]
- 47.Jordan PN, Hall KD. Dynamic coordination of macronutrient balance during infant growth: insights from a mathematical model. Am J Clin Nutr. 2008;87:692–703. doi: 10.1093/ajcn/87.3.692. [DOI] [PMC free article] [PubMed] [Google Scholar]
- 48.Butte NF, Wong WW, Hopkinson JM, Heinz CJ, Mehta NR, Smith EO. Energy requirements derived from total energy expenditure and energy deposition during the first 2 y of life. Am J Clin Nutr. 2000;72:1558–1569. doi: 10.1093/ajcn/72.6.1558. [DOI] [PubMed] [Google Scholar]
- 49.Forbes RM, Cooper AR, Mitchell HH. The composition of the adult human body as determined by chemical analysis. J Biol Chem. 1953;203:359–366. [PubMed] [Google Scholar]
- 50.Spray CM, Widdowson EM. The effect of growth and development on the composition of mammals. Br J Nutr. 1950;4:332–353. doi: 10.1079/bjn19500058. [DOI] [PubMed] [Google Scholar]
- 51.Clarys JP, Provyn S, Marfell-Jones MJ. Cadaver studies and their impact on the understanding of human adiposity. Ergonomics. 2005;48:1445–1461. doi: 10.1080/00140130500101486. [DOI] [PubMed] [Google Scholar]
- 52.Clarys JP, Martin AD, Drinkwater DT. Gross tissue weights in the human body by cadaver dissection. Hum Biol. 1984;56:459–473. [PubMed] [Google Scholar]
- 53.von Bezold A. Das shemische Skelett der Wirbelthiere. Ztschr Wissensch Zool. 1858;9:240. [Google Scholar]
- 54.Bernstein I. Fetal body composition. Curr Opin Clin Nutr Metab Care. 2005;8:613–617. doi: 10.1097/01.mco.0000170757.78737.74. [DOI] [PubMed] [Google Scholar]
- 55.Bernstein IM, Catalano PM. Ultrasonographic estimation of fetal body composition for children of diabetic mothers. Investig Radiol. 1991;26:722–726. doi: 10.1097/00004424-199108000-00005. [DOI] [PubMed] [Google Scholar]
- 56.Bernstein IM, Goran MI, Amini SB, Catalano PM. Differential growth of fetal tissues during the second half of pregnancy. Am J Obstet Gynecol. 1997;176:28–32. doi: 10.1016/s0002-9378(97)80006-3. [DOI] [PubMed] [Google Scholar]
- 57.Law TL, Korte JE, Katikaneni LD, Wagner CL, Ebeling MD, Newman RB. Ultrasound assessment of intrauterine growth restriction: relationship to neonatal body composition. Am J Obstet Gynecol. 2011;205:e1–e6. doi: 10.1016/j.ajog.2011.06.027. [DOI] [PubMed] [Google Scholar]
- 58.Moyer-Mileur LJ, Slater H, Thomson JA, Mihalopoulos N, Byrne J, Varner MW. Newborn adiposity measured by plethysmography is not predicted by late gestation two-dimensional ultrasound measures of fetal growth. J Nutr. 2009;139:1772–1778. doi: 10.3945/jn.109.109058. [DOI] [PMC free article] [PubMed] [Google Scholar]
- 59.Valensise H, Larciprete G, Arduini D, De Lorenzo A. The fetal body compartments and their detection during pregnancy. A review. Acta Diabetol. 2003;40:S79–S82. doi: 10.1007/s00592-003-0033-y. [DOI] [PubMed] [Google Scholar]
- 60.Winn HN, Holcomb WL. Fetal nonmuscular soft tissue: a prenatal assessment. J Ultrasound Med. 1993;12:197–199. doi: 10.7863/jum.1993.12.4.197. [DOI] [PubMed] [Google Scholar]
- 61.Hadlock FP, Harrist RB, Sharman RS, Deter RL, Park SK. Estimation of fetal weight with the use of head, body, and femur measurements–a prospective study. Am J Obstet Gynecol. 1985;151:333–337. doi: 10.1016/0002-9378(85)90298-4. [DOI] [PubMed] [Google Scholar]
- 62.Galan HL, Rigano S, Radaelli T, Cetin I, Bozzo M, Chyu J, et al. Reduction of subcutaneous mass, but not lean mass, in normal fetuses in Denver, Colorado. Am J Obstet Gynecol. 2001;185:839–844. doi: 10.1067/mob.2001.117350. [DOI] [PubMed] [Google Scholar]
- 63.Hure AJ, Collins CE, Giles WB, Paul JW, Smith R. Greater maternal weight gain during pregnancy predicts a large but lean fetal phenotype: a prospective cohort study. Matern Child Health J. 2011;16:1374–1384. doi: 10.1007/s10995-011-0904-8. [DOI] [PubMed] [Google Scholar]
- 64.Platz E, Newman R. Diagnosis of IUGR: traditional biometry. Semin Perinatol. 2008;32:140–147. doi: 10.1053/j.semperi.2008.02.002. [DOI] [PubMed] [Google Scholar]
- 65.Gardosi J, Francis A. A customized standard to assess fetal growth in a US population. Am J Obstet Gynecol. 2009;201:25 e1–e7. doi: 10.1016/j.ajog.2009.04.035. [DOI] [PubMed] [Google Scholar]
- 66.Uotila J, Dastidar P, Heinonen T, Ryymin P, Punnonen R, Laasonen E. Magnetic resonance imaging compared to ultrasonography in fetal weight and volume estimation in diabetic and normal pregnancy. Acta Obstet Gynecol Scand. 2000;79:255–259. [PubMed] [Google Scholar]
- 67.Baker PN, Johnson IR, Gowland PA, Hykin J, Harvey PR, Freeman A, et al. Fetal weight estimation by echo-planar magnetic resonance imaging. Lancet. 1994;343:644–645. doi: 10.1016/s0140-6736(94)92638-7. [DOI] [PubMed] [Google Scholar]
- 68.Kacem Y, Cannie MM, Kadji C, Dobrescu O, Lo Zito L, Ziane S, et al. Fetal weight estimation: comparison of two-dimensional US and MR imaging assessments. Radiology. 2013;267:902–910. doi: 10.1148/radiol.12121374. [DOI] [PubMed] [Google Scholar]
- 69.Smith FW. The potential use of nuclear magnetic resonance imaging in pregnancy. J Perinat Med. 1985;13:265–276. doi: 10.1515/jpme.1985.13.6.265. [DOI] [PubMed] [Google Scholar]
- 70.Anblagan D, Deshpande R, Jones NW, Costigan C, Bugg G, Raine-Fenning N, et al. Measurement of fetal fat in utero in normal and diabetic pregnancies using magnetic resonance imaging. Ultrasound Obstet Gynecol. 2013;42:335–340. doi: 10.1002/uog.12382. [DOI] [PubMed] [Google Scholar]
- 71.Lowe TW, Weinreb J, Santos-Ramos R, Cunningham FG. Magnetic resonance imaging in human pregnancy. Obstet Gynecol. 1985;66:629–633. [PubMed] [Google Scholar]
- 72.Smith FW, Adam AH, Phillips WD. NMR imaging in pregnancy. Lancet. 1983;1:61–62. doi: 10.1016/s0140-6736(83)91588-x. [DOI] [PubMed] [Google Scholar]
- 73.Smith FW, Kent C, Abramovich DR, Sutherland HW. Nuclear magnetic resonance imaging–a new look at the fetus. Br J Obstet Gynaecol. 1985;92:1024–1033. doi: 10.1111/j.1471-0528.1985.tb02997.x. [DOI] [PubMed] [Google Scholar]
- 74.Piers LS, Soares MJ, Frandsen SL, O’Dea K. Indirect estimates of body composition are useful for groups but unreliable in individuals. Int J Obes Relat Metab Disord. 2000;24:1145–1152. doi: 10.1038/sj.ijo.0801387. [DOI] [PubMed] [Google Scholar]
- 75.Wells JC, Fewtrell MS. Measuring body composition. Arch Dis Child. 2006;91:612–617. doi: 10.1136/adc.2005.085522. [DOI] [PMC free article] [PubMed] [Google Scholar]
- 76.Farr V. Skinfold thickness as an indication of maturity of the newborn. Arch Dis Child. 1966;41:301–308. doi: 10.1136/adc.41.217.301. [DOI] [PMC free article] [PubMed] [Google Scholar]
- 77.Tennefors C, Forsum E. Assessment of body fatness in young children using the skinfold technique and BMI vs body water dilution. Eur J Clin Nutr. 2004;58:541–547. doi: 10.1038/sj.ejcn.1601842. [DOI] [PubMed] [Google Scholar]
- 78.Kabir N, Forsum E. Estimation of total body fat and subcutaneous adipose tissue in full-term infants less than 3 months old. Pediatr Res. 1993;34:448–454. doi: 10.1203/00006450-199310000-00013. [DOI] [PubMed] [Google Scholar]
- 79.Goran MI, Gower BA, Treuth M, Nagy TR. Prediction of intra-abdominal and subcutaneous abdominal adipose tissue in healthy pre-pubertal children. Int J Obes Relat Metab Disord. 1998;22:549–558. doi: 10.1038/sj.ijo.0800624. [DOI] [PubMed] [Google Scholar]
- 80.Eriksson JG, Kajantie E, Lampl M, Osmond C, Barker DJ. Small head circumference at birth and early age at adiposity rebound. Acta Physiol. 2014;210:154–160. doi: 10.1111/apha.12142. [DOI] [PubMed] [Google Scholar]
- 81.Evelein AM, Visseren FL, van der Ent CK, Grobbee DE, Uiterwaal CS. Excess early postnatal weight gain leads to increased abdominal fat in young children. Int J Pediatr. 2012;2012:141656. doi: 10.1155/2012/141656. [DOI] [PMC free article] [PubMed] [Google Scholar]
- 82.De Lucia Rolfe E, Modi N, Uthaya S, Hughes IA, Dunger DB, Acerini C, et al. Ultrasound estimates of visceral and subcutaneous-abdominal adipose tissues in infancy. J Obes. 2013;2013:951954. doi: 10.1155/2013/951954. [DOI] [PMC free article] [PubMed] [Google Scholar]
- 83.Brambilla P, Bedogni G, Moreno LA, Goran MI, Gutin B, Fox KR, et al. Cross-validation of anthropometry against magnetic resonance imaging for the assessment of visceral and subcutaneous adipose tissue in children. Int J Obes (Lond) 2006;30:23–30. doi: 10.1038/sj.ijo.0803163. [DOI] [PubMed] [Google Scholar]
- 84.Stomfai S, Ahrens W, Bammann K, Kovacs E, Marild S, Michels N, et al. Intra- and inter-observer reliability in anthropometric measurements in children. Int J Obes (Lond) 2011;35:S45–S51. doi: 10.1038/ijo.2011.34. [DOI] [PubMed] [Google Scholar]
- 85.West J, Manchester B, Wright J, Lawlor DA, Waiblinger D. Reliability of routine clinical measurements of neonatal circumferences and research measurements of neonatal skinfold thicknesses: findings from the Born in Bradford study. Paediatr Perinat Epidemiol. 2011;25:164–171. doi: 10.1111/j.1365-3016.2010.01181.x. [DOI] [PMC free article] [PubMed] [Google Scholar]
- 86.Roggero P, Gianni ML, Amato O, Piemontese P, Morniroli D, Wong WW, et al. Evaluation of air-displacement plethysmography for body composition assessment in preterm infants. Pediatr Res. 2012;72:316–320. doi: 10.1038/pr.2012.75. [DOI] [PubMed] [Google Scholar]
- 87.Fields DA, Allison DB. Air-displacement plethysmography pediatric option in 2–6 years old using the four-compartment model as a criterion method. Obesity. 2012;20:1732–1737. doi: 10.1038/oby.2012.28. [DOI] [PMC free article] [PubMed] [Google Scholar]
- 88.Schoeller DA. Hydrometry. In: Heymsfield S, Lohman T, Wang Z-M, Going S, editors. Human Body Composition 918. 2nd. Human Kinetics; Champaign, IL, USA: 2005. p. 536. [Google Scholar]
- 89.Speakman JR, Nair KS, Goran MI. Revised equations for calculating CO2 production from doubly labeled water in humans. Am J Physiol. 1993;264:E912–E917. doi: 10.1152/ajpendo.1993.264.6.E912. [DOI] [PubMed] [Google Scholar]
- 90.Wang Z, Deurenberg P, Wang W, Pietrobelli A, Baumgartner RN, Heymsfield SB. Hydration of fat-free body mass: new physiological modeling approach. Am J Physiol. 1999;276:E995–E1003. doi: 10.1152/ajpendo.1999.276.6.E995. [DOI] [PubMed] [Google Scholar]
- 91.Hashimoto K, Wong WW, Thomas AJ, Uvena-Celebrezze J, Huston-Pressley L, Amini SB, et al. Estimation of neonatal body composition: isotope dilution versus total-body electrical conductivity. Biol Neonate. 2002;81:170–175. doi: 10.1159/000051530. [DOI] [PubMed] [Google Scholar]
- 92.Laskey MA. Dual-energy X-ray absorptiometry and body composition. Nutrition. 1996;12:45–51. doi: 10.1016/0899-9007(95)00017-8. [DOI] [PubMed] [Google Scholar]
- 93.Brunton JA, Bayley HS, Atkinson SA. Validation and application of dual-energy x-ray absorptiometry to measure bone mass and body composition in small infants. Am J Clin Nutr. 1993;58:839–845. doi: 10.1093/ajcn/58.6.839. [DOI] [PubMed] [Google Scholar]
- 94.Elowsson P, Forslund AH, Mallmin H, Feuk U, Hansson I, Carlsten J. An evaluation of dual-energy X-Ray absorptiometry and underwater weighing to estimate body composition by means of carcass analysis in piglets. J Nutr. 1998;128:1543–1549. doi: 10.1093/jn/128.9.1543. [DOI] [PubMed] [Google Scholar]
- 95.Testolin CG, Gore R, Rivkin T, Horlick M, Arbo J, Wang Z, et al. Dual-energy X-ray absorptiometry: analysis of pediatric fat estimate errors due to tissue hydration effects. J Appl Physiol. 2000;89:2365–2372. doi: 10.1152/jappl.2000.89.6.2365. [DOI] [PubMed] [Google Scholar]
- 96.Koo WW, Hammami M, Shypailo RJ, Ellis KJ. Bone and body composition measurements of small subjects: discrepancies from software for fan-beam dual energy X-ray absorptiometry. J Am Coll Nutr. 2004;23:647–650. doi: 10.1080/07315724.2004.10719406. [DOI] [PubMed] [Google Scholar]
- 97.Fields DA, Goran MI. Body composition techniques and the four-compartment model in children. J Appl Physiol. 2000;89:613–620. doi: 10.1152/jappl.2000.89.2.613. [DOI] [PubMed] [Google Scholar]
- 98.Binkovitz LA, Henwood MJ. Pediatric DXA: technique and interpretation. Pediatr Radiol. 2007;37:21–31. doi: 10.1007/s00247-006-0153-y. [DOI] [PMC free article] [PubMed] [Google Scholar]
- 99.Task Force on Bone Densitometry (H-30) CRCPD. Technical White Paper: Bone Densitometry. Frankfort, KY: 2006. [Google Scholar]
- 100.Agur A. Grant’s Atlas of Anatomy. Lippincott, Williams, and Wilkins; Philadelphia: 2009. pp. 484–485. [Google Scholar]
- 101.Wells JC, Fuller NJ, Dewit O, Fewtrell MS, Elia M, Cole TJ. Four-component model of body composition in children: density and hydration of fat-free mass and comparison with simpler models. Am J Clin Nutr. 1999;69:904–912. doi: 10.1093/ajcn/69.5.904. [DOI] [PubMed] [Google Scholar]
- 102.Lohman TG, Going SB. Multicomponent models in body composition research: opportunities and pitfalls. Basic Life Sci. 1993;60:53–58. doi: 10.1007/978-1-4899-1268-8_10. [DOI] [PubMed] [Google Scholar]
- 103.Lohman TG. Assessment of body composition in children. Pediatr Exerc Sci. 1989;1:19–30. doi: 10.1123/pes.1.1.19. [DOI] [PubMed] [Google Scholar]
- 104.Shen W, Liu H, Punyanitya M, Chen J, Heymsfield SB. Pediatric obesity phenotyping by magnetic resonance methods. Curr Opin Clin Nutr Metab Care. 2005;8:595–601. [PMC free article] [PubMed] [Google Scholar]
- 105.Samara A, Ventura EE, Alfadda AA, Goran MI. Use of MRI and CT for fat imaging in children and youth: what have we learned about obesity, fat distribution and metabolic disease risk? Obes Rev. 2012;13:723–732. doi: 10.1111/j.1467-789X.2012.00994.x. [DOI] [PubMed] [Google Scholar]
- 106.Kullberg J, Karlsson AK, Stokland E, Svensson PA, Dahlgren J. Adipose tissue distribution in children: automated quantification using water and fat MRI. J Magn Reson Imaging. 2010;32:204–210. doi: 10.1002/jmri.22193. [DOI] [PubMed] [Google Scholar]
- 107.Bauer JS, Noel PB, Vollhardt C, Much D, Degirmenci S, Brunner S, et al. Accuracy and reproducibility of adipose tissue measurements in young infants by whole body magnetic resonance imaging. PLoS One. 2015;10:e0117127. doi: 10.1371/journal.pone.0117127. [DOI] [PMC free article] [PubMed] [Google Scholar]
- 108.Taicher GZ, Tinsley FC, Reiderman A, Heiman ML. Quantitative magnetic resonance (QMR) method for bone and whole-body-composition analysis. Anal Bioanal Chem. 2003;377:990–1002. doi: 10.1007/s00216-003-2224-3. [DOI] [PubMed] [Google Scholar]
- 109.Napolitano A, Miller SR, Murgatroyd PR, Coward WA, Wright A, Finer N, et al. Validation of a quantitative magnetic resonance method for measuring human body composition. Obesity (Silver Spring) 2008;16:191–198. doi: 10.1038/oby.2007.29. [DOI] [PubMed] [Google Scholar]
- 110.Gallagher D, Thornton JC, He Q, Wang J, Yu W, Bradstreet TE, et al. Quantitative magnetic resonance fat measurements in humans correlate with established methods but are biased. Obesity (Silver Spring) 2010;18:2047–2054. doi: 10.1038/oby.2010.97. [DOI] [PMC free article] [PubMed] [Google Scholar]
- 111.Zanghi BM, Cupp CJ, Pan Y, Tissot-Favre DG, Milgram NW, Nagy TR, et al. Noninvasive measurements of body composition and body water via quantitative magnetic resonance, deuterium water, and dual-energy x-ray absorptiometry in cats. Am J Vet Res. 2013;74:721–732. doi: 10.2460/ajvr.74.5.721. [DOI] [PubMed] [Google Scholar]
- 112.Zanghi BM, Cupp CJ, Pan Y, Tissot-Favre DG, Milgram NW, Nagy TR, et al. Noninvasive measurements of body composition and body water via quantitative magnetic resonance, deuterium water, and dual-energy x-ray absorptiometry in awake and sedated dogs. Am J Vet Res. 2013;74:733–743. doi: 10.2460/ajvr.74.5.733. [DOI] [PubMed] [Google Scholar]
- 113.Mitchell AD, Rosebrough RW, Taicher GZ, Kovner I. In vivo measurement of body composition of chickens using quantitative magnetic resonance. Poult Sci. 2011;90:1712–1719. doi: 10.3382/ps.2010-01156. [DOI] [PubMed] [Google Scholar]
- 114.Andres A, Gomez-Acevedo H, Badger TM. Quantitative nuclear magnetic resonance to measure fat mass in infants and children. Obesity. 2011;19:2089–2095. doi: 10.1038/oby.2011.215. [DOI] [PubMed] [Google Scholar]
- 115.Andres A, Mitchell AD, Badger TM. QMR: validation of an infant and children body composition instrument using piglets against chemical analysis. Int J Obes. 2010;34:775–780. doi: 10.1038/ijo.2009.284. [DOI] [PubMed] [Google Scholar]
- 116.Mitchell A. Validation of QMR body composition analysis for infants using Piglet Model. Pediatr Res. 2010;9:9. doi: 10.1203/PDR.0b013e31820a5b9c. [DOI] [PubMed] [Google Scholar]
- 117.Kovner I, Taicher GZ, Mitchell AD. Calibration and validation of EchoMRI™ whole body composition analysis based on chemical analysis of piglets, in comparison with the same for DXA. Int J Body Compos Res. 2010;8:17–29. [PMC free article] [PubMed] [Google Scholar]
- 118.Taicher G, Kovner I, Mitchell AD. 17th European Congress on Obesity. Poster ECO; PS 5-1. Amsterdam, The Netherlands: Accuracy and precision for EchoMRI-Infants™ body composition analysis in piglets. [Google Scholar]
- 119.Toro-Ramos T, Paley CW, Lin S, Yu W, Pi-Sunyer X, Gallagher D, editors. The 31st Annual Scientific Meeting of The Obesity Society. Atlanta: Georgia; 2013. Reliability of the EchoMRI-Infant System for Water and Fat Measurements in Newborns Obesity 2013. [DOI] [PMC free article] [PubMed] [Google Scholar]
Associated Data
This section collects any data citations, data availability statements, or supplementary materials included in this article.