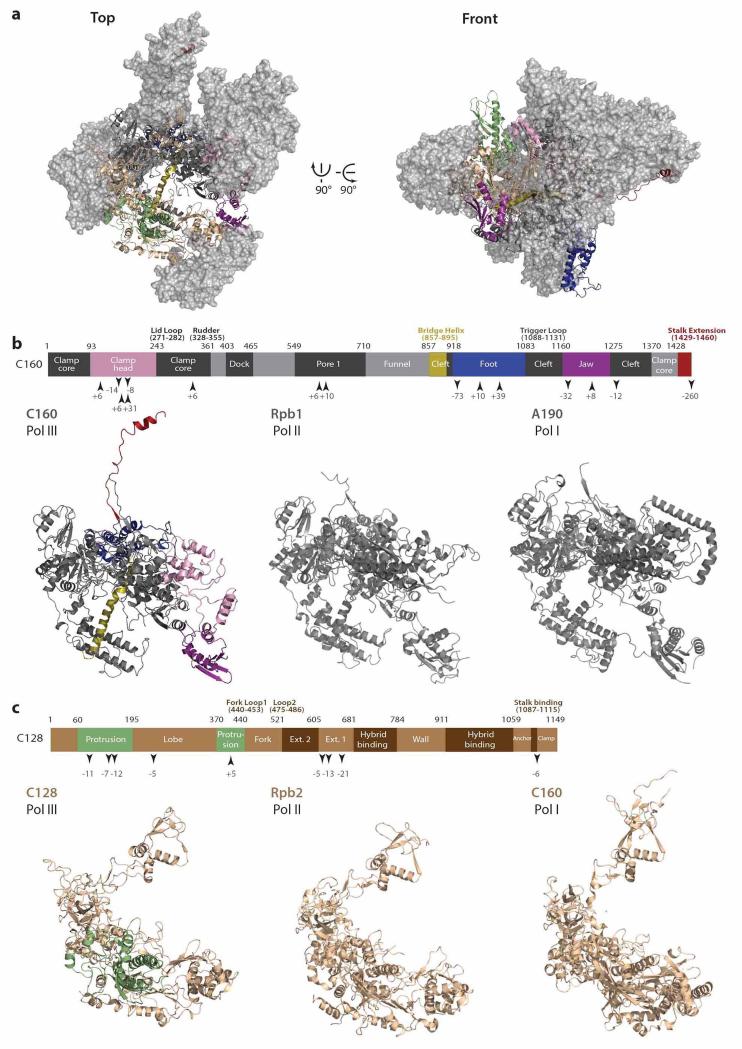
Extended Data Figure 5. Pol III-specific features of subunits C160 and C128 and comparison to the homologous Pol II and Pol I subunits.
a, Top (left) and front (right) view of Pol III, with subunits C160 and C128 displayed in ribbon representation and the other subunits in surface representation (grey). Colored stretches highlight characteristic features denoted in b. b, Bar diagram shows the domain organization of Pol III C160. Arrows and corresponding numbers below the bar diagram indicate insertions and deletions of five or more residues in Pol III relative to Pol II subunit Rpb1 as indicated by structure-based alignment. Colored regions are also shown in Pol III subunit C160 (lower panel, left) and in a. Lower panel middle and right show Pol II Rpb1 and Pol I A190 subunits, respectively. c, Same as in b for Pol III subunit C128. Insertions and deletions compared to Pol II subunit Rpb2 are displayed in the box diagram.

