

Abstract
Light controls pineal melatonin production and temporally coordinates circadian rhythms of metabolism and physiology in normal and neoplastic tissues. We previously showed that peak circulating nocturnal melatonin levels were 7-fold higher after daytime spectral transmittance of white light through blue-tinted (compared with clear) rodent cages. Here, we tested the hypothesis that daytime blue-light amplification of nocturnal melatonin enhances the inhibition of metabolism, signaling activity, and growth of prostate cancer xenografts. Compared with male nude rats housed in clear cages under a 12:12-h light:dark cycle, rats in blue-tinted cages (with increased transmittance of 462–484 nm and decreased red light greater than 640 nm) evinced over 6-fold higher peak plasma melatonin levels at middark phase (time, 2400), whereas midlight-phase levels (1200) were low (less than 3 pg/mL) in both groups. Circadian rhythms of arterial plasma levels of linoleic acid, glucose, lactic acid, pO2, pCO2, insulin, leptin, and corticosterone were disrupted in rats in blue cages as compared with the corresponding entrained rhythms in clear-caged rats. After implantation with tissue-isolated PC3 human prostate cancer xenografts, tumor latency-to-onset of growth and growth rates were markedly delayed, and tumor cAMP levels, uptake–metabolism of linoleic acid, aerobic glycolysis (Warburg effect), and growth signaling activities were reduced in rats in blue compared with clear cages. These data show that the amplification of nighttime melatonin levels by exposing nude rats to blue light during the daytime significantly reduces human prostate cancer metabolic, signaling, and proliferative activities.
Abbreviations: A-V, arterial–venous difference; ipRGC, intrinsically photosensitive retinal ganglion cell; LA, linoleic acid; 13-HODE, 13-hydroxyoctadecadienoic acid; TFA, total fatty acids
Light profoundly influences circadian, neuroendocrine, and neurobehavioral regulation in all mammals and is essential to life on our planet.2,15,28, 40 The light–dark cycle entrains the master biologic clock, located in the suprachiasmatic nucleus of the brain, in an intensity-, duration-, and wavelength-dependent manner.8-13 Photobiologic responses, including circadian rhythms of metabolism and physiology, are mediated by organic molecules called ‘chromophores,’ which are contained within a small subset of retinal cells, called the intrinsically sensitive retinal ganglion cells (ipRGC).16,29,31,36,41,49,53,59 In humans and rodents light quanta are detected by the chromophore melanopsin, which detects light quanta in principally the short-wavelength, blue-appearing portion of the spectrum (446 to 477 nm), and transmits its photic information via the retinohypothalamic tract to the ‘molecular clock’ of the suprachiasmatic nucleus. This region of the brain regulates the daily pineal gland production of the circadian neurohormone melatonin (N-acetyl-5-methoxytryptamine), which results in high levels produced at night and low levels during daytime.38,54 The daily, rhythmic melatonin signal provides temporal coordination of normal behavioral and physiologic functions including chronobiologic rhythms of locomotor activity,2 sleep-wake cycle,2,14 dietary and water intake,2,51 hormone secretion and metabolism.5,44,47,61 Alterations in light intensity, duration, and spectral quality at a given time of day,8-13,17,19-22,24,61 such as occurs in night-shift workers exposed to light at night,26,34,46,57 acutely suppresses endogenous melatonin levels in most mammalian species9,11,44,45,54,55 and may lead to various disease states, including metabolic syndrome5,61 and carcinogenesis.4-7,17,18
Recent studies from our laboratory5,20,23-25,60,61 have demonstrated that relatively small changes in the spectral transmittance (color) of light passing through translucent amber (>590 nm), blue (>480 nm), and red-tinted (>640 nm) polycarbonate laboratory rodent cages, compared with standard polycarbonate clear cages (390 to 700 nm), during the light phase markedly influenced the normal nighttime melatonin signal and disrupted temporal coordination of metabolism and physiology.19,24,61 Most notable was our discovery that, in both male and female pigmented nude rats maintained in blue-tinted rodent cages, nighttime melatonin levels were as much as 7 times higher than normal nighttime peak levels in animals maintained in all other cage types.19 An earlier study in human subjects diagnosed with midwinter insomnia coupled with low nighttime melatonin levels demonstrated that daily exposure to intense morning bright polychromatic light therapy for up to one week resulted in a restoration of nocturnal melatonin levels to those of control subjects.35 In another study, exposure to blue-tinted (470 nm) LED light (100 lx) for approximately 20 min in the morning after 2 sleep-restricted (6 h) nights led to earlier onset of the melatonin surge at nighttime.30
In the United States alone this year, approximately 240,000 men will be diagnosed with prostate cancer, and nearly 30,000 will die from this disease (National Cancer Institute; www.cancer.gov/). Epidemiologic studies have shown that night shift work, which involves circadian disruption, including nocturnal melatonin suppression, markedly increases prostate cancer risk in men.26,34,46,57,58 Both in vitro and in vivo studies have demonstrated that melatonin inhibits human prostate cancer growth, including that of androgen-receptor–negative, castration-resistant PC3 human prostate cancer cells.20,29,42,56 Cancer cells depend primarily on aerobic glycolysis (Warburg effect) over oxidative phosphorylation to meet their bioenergetic needs supporting biomass formation.5 The Warburg effect is characterized by increased cellular uptake of glucose and production of lactate despite an abundance of oxygen. Investigations have shown that signal transduction pathways that include AKT, MEK, NFκB, GS3Kβ, and PDK1 drive the Warburg effect.5,61 In addition, cancer cells rely on increased uptake of the ω6 fatty acid linoleic acid (LA), which is prevalent in the western diet.4-6 In most cancers, LA uptake occurs through a cAMP-dependent transport mechanism, and LA is metabolized to the mitogenic agent 13-hydroxyoctadecadienoic acid (13-HODE). In most tumors, 13-HODE plays an important role in enhancing downstream phosphorylation of ERK 1/2, AKT, and activation of the Warburg effect, thereby leading to increased cell proliferation and tumor growth.4-6 Melatonin, the principal neurohormone of the pineal gland and whose production is regulated by the suprachiasmatic nucleus,4,5 modulates processes of tumor initiation, progression, and growth in vivo.5 The circadian nocturnal melatonin signal not only inhibits LA uptake and metabolism, the Warburg effect in human cancer xenografts, and ultimately tumor growth, but it actually drives circadian rhythms in tumor metabolism, signal transduction activity, and cell proliferation. These effects are extinguished when melatonin production is suppressed by light exposure at night.5
In the present investigation, we examined the hypothesis that the spectral transmittance (color) of short-wavelength (480 nm) bright light passing through blue-tinted standard laboratory rodent cages during the light phase not only amplifies the normal circadian nocturnal melatonin signal but also enhances the inhibition of the metabolism, signaling activity, and growth progression of human PC3 androgen-receptor–negative human prostate cancer xenografts in male nude rats.
Materials and Methods
Animals, housing conditions, and diet.
Male, pigmented, homozygous, athymic, inbred nude rats (Crl:NIH-Foxn1rnu), 3 to 4 wk of age, used in this study were purchased from Charles River (Wilmington, MA). Animals were maintained in an AAALAC-accredited facility in accordance with the Guide for the Care and Use of Laboratory Animals.39 All procedures for animal use were approved by the Tulane University IACUC.
Rats were maintained as described below in autoclaved cages using hardwood maple bedding (catalog no. 7090, Sanichips, Harlan Teklad, Madison, WI; 2 bedding changes weekly). To ensure that all rats remained infection-free from bacterial and viral agents and murine parasites, serum samples from sentinel animals were tested quarterly and during the course of this study (Multiplex Fluorescent Immunoassay 2, Idexx Research Animal Diagnostic Laboratory, Columbia, MO) as described previously.19,22 Rats were provided free access to food (5053 Irradiated Laboratory Rodent Diet, Purina, Richmond, IN) and acidified water. Quadruplicate determinations of this diet contained (per 100 g of diet) 4.72 g total fatty acid (TFA), composed of 0.92% myristic (C14:0), 13.82% palmitic (C16:0), 1.17% palmitoleic (C16:1n7), 3.64% stearic (C18:0), 23.90% oleic (C18:1n9), 50.17% linoleic (C18:2n6), 5.98% γ-linolenic, and 0.29% arachidonic (C20:4n6) acids. Minor amounts of other FA comprised 0.11%. Conjugated LA and trans FA were not found. More than 90% of the TFA was in the form of triglycerides; more than 5% was in the form of free FA.
Caging, lighting regimens, and spectral transmittance measurements.
After a 1-wk acclimation period, rats were randomized into 2 designated groups of 6 animals each (3 rats per cage) and placed in standard polycarbonate, translucent laboratory rodent cages (10.5 in. × 19.0 in. × 8.0 in.; wall thickness, 0.10”) of either clear (control; catalog no. R20PC, Ancare, Bellmore, NY) or blue (experimental; catalog no. 80778CC; Lab Products, Seaford, DE) in hue. Both cage types used identical stainless steel lids (catalog no. 10SS, Ancare) and were covered with polysulfone translucent microfilter tops (catalog no. N10MBT, Ancare). The SPF rats were maintained in environmentally controlled rooms (25 °C; 50% to 55% humidity) with diurnal, 12:12-h lighting (lights on, 0600). Animal rooms were lighted with a series of 3 overhead luminaires containing 4 cool-white fluorescent lamps per ballast (Alto Collection 32 W, catalog no. F32T8TL741, Philips, Somerset, NJ); animal rooms were completely devoid of light contamination during the dark phase.5,17
Daily during the course of this experiment, the animal room was monitored for normal light-phase lighting intensity at 1 m above the floor in the center of the room (at rodent eye level) and outside and from within and at the front of the animal cages. Irradiance measures used a radiometer–photometer (model IL1400A, International Light Technologies, Peabody, MA) that had a silicon-diode detector head (model SEL033, International Light Technologies) and a wide-angle input optic (W6849, International Light Technologies); a filter (F23104, International Light Technologies) provided a flat response across the visible spectrum. Illuminance measures used a silicon-diode detector head (model SEL033, International Light Technologies) with a wide-angle input optic (W10069, International Light Technologies) and a filter (Y23104, International Light Technologies) to provide a photopic illuminance response. The meter and associated optics were calibrated annually, as described previously.19,21,22,24,61 Each day and at the same time (0800), prior to light intensity measurements for that day, all cages on the rack shelf were rotated one position to the right (placed at an identical, premeasured distance apart) in the same horizontal plane; the cage at position 4 (last position at far right on the shelf) was moved to position 1 (first position at far left on the shelf). Although light intensity, as measured outside and from within the front of each cage at each of the 4 positions, did not differ among positions, the daily cage shift further ensured uniformity of intensity of ocular light exposure and accounted for the effects of any unforeseen subtle differences due to position on the rack shelf.
According to current convention, when discussing human and laboratory animal environments, we use the term ‘lux’ to indicate the amount of light falling on a surface that stimulates the mammalian eye during daytime (that is, the perceived brightness to the eye [photometric values]). Measures of lux are appropriate for human daytime vision but are not appropriate for quantifying light stimuli that regulates circadian, neuroendocrine or neurobehavioral physiology in animals or humans.9,11 Consequently, radiometric values of irradiance (μW/cm2), a measure of radiant power or density over a defined bandwidth of light, were measured in the cages by using the same equipment and system as for illuminance. Given these standards, we present the light stimuli in the current investigation in terms of both lux and μW/cm2 for ease of understanding.
Spectral transmittances were quantified by using a handheld spectroradiometer (ASD FieldSpec, ASD, Boulder, CO). Spectral power distributions, a measure of the concentration (as a function of wavelength) of any radiometric quantity (that is, irradiance compared with wavelength), were recorded when the meter was pointing directly at the overhead fluorescent lighting source and used for a comparison between cages. Pearson correlations were performed to determine similarities and differences of the spectral power distributions between cages. According to the irradiance measures, the correlation coefficient of the spectral power distributions from 380 nm to 760 nm was determined. As a more detailed method of analysis, the spectral power distribution was divided into 100-nm bins (that is, 400 to 500 nm), and Pearson correlations were determined between cage conditions. In addition, we calculated weighted retinal photopigment illuminances (measured in lx) for rats on the basis of the integrated output of the S and M cones, rods, and ipRGC regulating nonvisual physiology and behavior.49
Calculation of effective rod, cone, and melanopsin photoreceptor illuminances.
To calculate the effective rodent rod, cone and melanopsin photoreceptor illuminances, the spectral power distributions of the clear- and blue-cage transmissions were entered into a Toolbox worksheet (this software model for rodent photoreception is freely available online).52 The spectral power distributions for the experiments shown here were imported into the worksheet in 1-nm increments between 325 and 782 nm. The spectral range available in Toolbox extends down to 298 nm. However, because the light output from a standard 4000-K fluorescent bulb at wavelengths below 325 nm approaches 0, all values between 298 and 325 nm were set to 0. According to the instructions for Toolbox, all raw spectral power distribution values that were negative were manually changed to 0.
Arterial blood collection.
After a 2-wk exposure to the described lighting regimens, rats underwent a series of 6 low-volume blood draws by cardiocentesis to collect left ventricular arterial blood4-6,17-19,21-25 over a period of 30 d. Briefly, blood collections were designated at 4-h intervals to include the 24-h feeding period; each rat was tested only once every 5 d to eliminate the effects of feeding, stress, and potential mortality. Samples of whole blood were collected for the measurements of pH, pO2, pCO2, glucose, and lactate levels and Hct (iSTAT1 Analyzer with CG4+ and CG8+ cartridges, Abbott Laboratories, East Windsor, NJ). Values for glucose and lactate are reported as mg/dL and mmol/L and for pH, pO2, pCO2, glucose, and lactate values as, 0.01, 0.1 mm Hg, 0.1 mm Hg, 0.2 mg/dL, and 0.01 mmol/L, respectively. Plasma samples were stored at –20 °C until analysis.
PC3 prostate cancer xenograft implantation, determination of tumor growth, and arterial and venous difference measurements.
After a 1-wk recovery period, androgen-receptor–negative or androgen-independent human PC3 prostate xenografts were implanted in the nude rats and grew as tissue-isolated tumors as described previously,4,6,20,23 with a single arterial and single venous connection to the host. The PC3 prostate tumor xenografts were verified histopathologically to be a grade IV human prostate cancer cell line (catalog no. CRL-1435, American Tissue Cell Collection, Mannassas, VA). Latency-to-onset of tumor growth (approximately pea-sized) was determined, and estimated tumor weights were measured, as described previously.6,20,23 When tumors reached an estimated weight of 6 to 8 g, animals were prepared for tumor arterial and venous (A-V) difference measurements, as previously described.6,20,23 In the initial experiment, all tumor A-V difference measurements in rats in clear or blue cages were taken between 0600 and 0800. Whole blood was collected for measurements of pH, pO2, pCO2, glucose, and lactate levels; plasma samples were obtained to analyze Hct, TFA and LA uptake, and 13-HODE production. At the end of the tumor A-V blood collections, tumors were freeze -lamped under liquid nitrogen, weighed, and stored at –80 °C until used for analyses.
To determine the effects of normal daytime physiologic (less than 10 pg/mL; occurring at 1200) and elevated nighttime (occurring at 2400 h) melatonin levels on tumor A-V differences in rats maintained in blue-tinted cages, all rats were randomized into 2 designated groups of 6 animals each (3 per cage) and maintained only in blue-tinted cages. Animal cages were rotated daily as described earlier. After a 1-wk acclimation period in the blue cages, all rats were implanted with the tissue-isolated PC3 prostate xenograft and measured for latency-to-onset and tumor growth, as described earlier. When tumors reached an estimated weight of 6 to 8 g, rats were prepared for tumor A-V difference measurements at either 1200 or 2400, as described previously.
Melatonin analysis.
Arterial plasma melatonin levels were measured by radioimmunoassay (rat melatonin125I-radioimmunoassay kit, Alpco, Salem, NH; lot 1429.18, prepared by Bühlmann Laboratories AG, Schönenbuch, Switzerland) and analyzed by using an automated gamma counter (Cobra 5005, Packard, Palo Alto, CA) as previously described.21,22,24 The minimal level of detection for the assay was 1 to 2 pg/mL plasma.
ELISA analysis of corticosterone, insulin, and leptin.
Arterial plasma samples were prepared in duplicate for measurement of corticosterone, insulin, and leptin levels by using chemiluminescent ELISA diagnostic kits (ALPCO; corticosterone: catalog no. 55-CORMS-E01; mouse or rat; protocol version 4/09/11–ALPCO 9/13/11); insulin: catalog no. 80-INSRTH-E01; rat, high range; protocol version 2.0–ALPCO 12/2/11); and leptin: catalog no. 22-LEPMS-E01; mouse or rat; protocol version 030112 version 10–ALPCO 2/29/2012). Samples were measured at 450 nM by using a microplate reader (VersaMax, Molecular Devices, Sunnyvale, CA). The detection sensitivity for corticosterone, insulin, and leptin plasma analyses were 4.5 ng/mL, 0.124 ng/mL, and 10 pg/mL, respectively; the lower limits of the assays were 15 ng/mL, 0.15 ng/mL, and 10 pg/mL, respectively; and the coefficient of variation of all assays was less than 4.0%.
FA extraction and analysis.
Arterial and human PC3 tumor venous plasma TFA were extracted from 0.1 mL arterial and venous samples after the addition of heptadecanoic acid (C17:0), methylated, and analyzed by using gas chromatography as previously described.4-6,20-24 Values for TFA represent the sum of the 7 major FA (myristic, palmitic, palmitoleic, stearic, oleic, linoleic, and arachidonic) in the blood plasma. The uptake of TFA and LA is dependent on the supply of the arterial blood to the tumor and are presented here for statistical comparison as both absolute values (µg/min/g tumor tissue) and as a percentage of the arterial supply to the tumor (defined as the TFA or LA uptake / arterial supply × 100%). Tumor tissue TFA and LA levels in control and experimental groups were extracted from 0.2 mL of 20% homogenates, as previously described.4,17,23 The lower limit of detection for the assay was 0.05 μg/mL.
HPLC analysis of 13-HODE concentration.
Plasma samples (0.2 mL) collected in vivo for 13-HODE were combined with a known quantity of internal standard (5-hydroxy,6,8,11,14-eicosatetraenoic acid, racemic; Cayman Chemicals, Ann Arbor, MI) and analyzed by using HPLC.4-6,20-24 All PC3 xenograft 13-HODE production values are expressed as ng/min/g tumor. Values of 0 indicate that no 13-HODE was detected within the sensitivity range of the instrument (10−18 M and above).
Determination of tumor cAMP levels, DNA content, and [3H]thymidine incorporation into DNA.
Tumor levels of cAMP were determined by ELISA (Amersham Biosciences, Piscataway, NJ), and [3H]thymidine incorporation into DNA and DNA content were determined as previously described.4-6,20-24
Tumor lysate extraction and Western blot analysis.
The frozen tumors were pulverized under liquid nitrogen and homogenized in RIPA buffer, as previously described.5 Total tumor protein was isolated and aliquots stored at –80 °C, as described previously. Western blots were probed with various antibodies, including phosphorylated (p) MEK 1/2 (Ser217/Ser221), total (t)-MEK, pERK 1/2 (Thr202/Tyr204), t-ERK1/2, pAKT (Ser473), tAKT, pGSK3β (Ser9), tGSK3β, pNFκβ (Ser536), tNFκβ, pCREB (Tyr416), tSRC, pPDK7, and tPDK7 (Cell Signaling Technology, Danvers, MA) and analyzed as described previously.5 Antiβ-actin antibody (Sigma Scientific, St Louis, MO) was used to evaluate loading. Quantitation of Western blots and differences in expression of total and phosphorylated proteins were determined by digital quantitation of phosphorylated and total protein levels, normalizing phosphorylated levels to the levels of the total protein of interest, and expressing the level of the experimental group relative to that of the control group to determine the percentage or fold change.
Statistical analysis.
All data are presented as mean ± 1 SD (n = 6 rats per group) unless otherwise noted. The experiment was repeated once for measurements of corticosterone, insulin, leptin, linoleic acid, and melatonin and for tumor A-V difference; all data for both replicate experiments were combined, for a total of 12 values per group. The nonparametric JTK_CYCLE algorithm,37 as implemented in scripts for the R software package (R version 3.1.0; http://openwetware.org/wiki/HughesLab:JTK_Cycle), was used to determine the statistical significance of differences in the 24-h cycling for each analyte, with adjustments for multiple comparisons.52 This algorithm also was used to estimate phase (time of peak levels) and amplitude of cycling. Statistical differences between the mean values in the experimental group compared with the control group at each circadian time point were assessed by using an unpaired Student t test. Differences in the slopes of regression lines (that is, tumor growth rates) between groups were determined by linear regression analysis and tests for parallelism (Student t test). Differences among the group means were considered statistically different at a P value of 0.05.
Results
Animal-room illumination and cage spectral transmittance.
Animal room illumination during the daytime at the center of the room and at 1 m above the floor (with the detector facing upward toward the luminaires) varied minimally (n = 252 measurements) and was 425.93 ± 16.43 lx (174.63 ± 6.73 µW/cm2). Measurements of photometric illuminance (lux) and radiometric irradiance (μW/cm2) from outside and inside the front of each cage (Figure 1) showed little to no intercage variability, and the averaged values (n = 294 measurements) for clear and blue cages, respectively, were 133.37 ± 7.41 lx (54.68 ± 3.04 μW/cm2) outside and at the front of the cage and 91.31 ± 2.21 lx (37.44 ± 0.91 μW/cm2) inside and at the front of the cage. Spectral power distributions of light measured through the wall of these cages are shown in (Figure 2). The data are typical of this fluorescent-lamp type, with signature peaks in the appropriate wavelengths. Differences in the amplitude of these peaks are apparent between cage types. The blue cage contained the highest peak amplitude in the shorter (400 to 550 nm) wavelength segments. As expected, in the longer wavelength ranges (550 to 700 nm), there was a shift in peak amplitude, with the clear cage demonstrating larger peak amplitudes than those of the blue cage at wavelengths longer than 550 nm. The Pearson correlation coefficient between cage conditions did not demonstrate a significant difference, given the linearity of the curves.
Figure 1.

Photoimage showing the standard polycarbonate translucent clear (left) and blue (right) rodent cages. Both cages had the same dimensions (19 in. × 10.5 in × 8.0 in; wall thickness, 0.1 in) and were autoclavable to 121 °C.
Figure 2.

Spectral power distributions of the fluorescent lamp light as transmitted through the blue (experimental) and clear (control) cages.
(Table 1) provides the calculated photon densities, irradiances, and weighted rodent photopigment illuminances for the standard white fluorescent light transmitted through the clear and blue rodent cages (Figure 1). The data illustrate that the blue plastic attenuates both the transmission of both total photon flux and irradiance.52 In contrast, the light transmitted through the blue plastic cage to the rodents inside has a higher capacity for stimulating each of the rodent photoreceptors (Table 2). Measurements made in the animal room and within the cages of both groups during the dark phase were 0 lx (0 μW/cm2).
Table 1.
Calculated photon densities, irradiances, and rodent photopigment illuminances relative to 4000-K white fluorescent light transmitted through 2 types of rodent cages
| Radiometric and photometric values (380–780 nm inclusive) |
Retinal photopigment-weighted illuminances (α-opic lux) |
|||||
| Photon flux (photons/cm2/s) | Irradiance (µW/cm2) | S cone | Melanopsin ipRGC | Rod | M cone | |
| Clear cage | 1.20 × 10¹⁵ | 430 | 43 | 700 | 900 | 1014 |
| Blue cage | 1.17 × 10¹⁵ | 421 | 49 | 732 | 931 | 1041 |
Table 2.
Irradiance values (W/cm2) and comparisons of peak wavelength differences
| Peak (nm) |
|||||
| 424 | 480 | 532 | 605 | ||
| Measured irradiance | Clear cage | 0.0171 | 0.0166 | 0.0649 | 0.0691 |
| Blue cage | 0.0181 | 0.0177 | 0.0669 | 0.0633 | |
| % difference | Clear/blue | −5.9% | −6.7% | −3.0% | 8.4% |
Animal food and water intakes and growth measurements.
Food and water intakes and body growth rates did not differ significantly between the rats maintained in either the clear or blue cages during the course of this study and are reported here as the combined means. Values for rats in both groups of the present study were in good agreement with those determined for healthy young male Hsd:RH-Foxn1rnu nude rats in previous investigations.20 Mean (n = 90 measurements) daily dietary intake was 21.14 ± 0.64 g daily, and water intake was 29.87 ± 0.86 mL daily. The mean (n = 83 measurements per group) body growth rate was 3.88 ± 0.28 g daily.
Plasma melatonin levels.
Circadian rhythms in concentrations of plasma melatonin for rats in clear and blue cages (n = 12 per group) prior to xenograft implantation are shown in (Figure 3). The overall pattern of daily plasma melatonin level rhythms was similar for both groups: low during daytime (less than 10 pg/mL) and significantly (P < 0.001) higher during the dark phase, with peak levels occurring between 2400 and 0400 and decreasing to a nadir between 1200 and 1600. There were differences, however, in either the phase (that is, timing) or duration of the nocturnal melatonin signal between the 2 groups of rats (Table 3).4,7 Melatonin levels in the rats in blue cages began to rise rapidly after the onset of the dark phase, reaching the peak of those in clear cages (control) by 2000. However, the peak dark-phase melatonin level for rats in the blue cages (that is, at 2400) was more than 6-fold higher (P < 0.0001) than that in control rats at the same time point. Arterial plasma melatonin levels remained more than 3-fold higher (P < 0.05) in rats in blue cages compared with clear cages, even at 2 h after the onset of light phase, and did not reach normal daytime levels (less than 10 pg/mL) until 1200. The integrated mean levels of melatonin over the 24-h period for rats in blue cages were more than 6-fold higher than those of animals in clear cages (P < 0.001).
Figure 3.

Diurnal plasma melatonin levels (pg/mL; mean ± 1 SD) of male pigmented nude rats (n = 12 per group) maintained for 6 wk in standard polycarbonate, translucent, clear cages (control; solid red circles) or blue cages (experimental; solid blue squares) under 12:12-h photoperiods. Both groups were exposed similarly during the light phase (300 lx, 123 µW/cm2); during the 12-h dark phase (1800 to 0600; dark bars), rats had no exposure to light. Data are plotted twice to better demonstrate rhythmicity (panel A) and clarity of scale (panel B). Rhythmicity analysis (Table 3) revealed robust and highly significant (P < 0.0001) rhythmic patterns under control lighting conditions for both groups, with 9.6- (A) and 53.3- (B) fold increases in nighttime amplitude compared with daytime amplitudes, respectively, and a 5.55-fold increase (P < 0.001, Student t test) in amplitude at 2400 in rats in blue compared with clear cages. Concentrations with asterisks differ (P < 0.05) from concentrations without asterisks.
Table 3.
Summary of JTK_CYCLE analysis for rats maintained in clear and blue cages
| Estimated phasea |
Amplitudea |
Q-value for circadian cyclinga |
||||||
| Clear | Blue | Phase difference (h)b | Clear | Blue | Fold changeb | Clear | Blue | |
| Corticosterone | 0100 | 1700 | −8 | 22.7052 | 45.2690 | 1.99 | 0.0116 | <0.0001 |
| Glucose | 1400 | 1700 | +3 | 4.3841 | 5.5861 | 1.27 | <0.0001 | 0.1096 |
| Insulin | 0800 | 0400 | −4 | 0.0424 | 0.0707 | 1.67 | <0.0001 | 0.0006 |
| Lactate | 1400 | 1600 | +2 | 0.0445 | 0.0177 | −2.52 | 0.0005 | 0.4786 |
| Leptin | 2200 | 2200 | 0 | 0.0339 | 0.0460 | 1.35 | 0.0002 | 0.7446 |
| Linoleic acid | 0400 | 0400 | 0 | 384.67 | 386.79 | 1.01 | <0.0001 | <0.0001 |
| Melatonin | 0200 | 0200 | 0 | 17.2364 | 95.6362 | 5.55 | <0.0001 | <0.0001 |
| pCO2 | 1300 | 2000 | +7 | 0.9899 | 1.9092 | 1.93 | 0.9799 | 0.0482 |
| pO2 | 1600 | 1600 | 0 | 8.4853 | 3.5355 | −2.40 | <0.0001 | 0.1410 |
| TFA | 0400 | 0400 | 0 | 1127.13 | 1122.89 | −1.00 | <0.0001 | <0.0001 |
Plasma measures of TFA and LA.
Circadian rhythms in the concentrations of arterial blood plasma TFA and LA were measured in rats with free access to the food (Figure 4). The plasma pattern of lipid levels in blue-caged rats followed that of the control animals, which was reported earlier,4,5,17,19,22 such that the total TFA areas assessed over the 24-h day for curves shown in Figure 4 did not differ significantly from one another (control, 46.8 mg/mL; experimental, 45.3 mg/mL). Circadian cycling was evident for both groups, with a severely dampened amplitude during daytime (Table 3).
Figure 4.

Diurnal changes in the blood plasma total fatty (TFA) and linoleic (LA) levels (µg/mL; mean ± 1 SD) of male pigmented nude rats (n = 12 per group) with unrestricted access to normal chow and maintained on either control (TFA, solid black circles; LA, solid red triangles) or experimental (TFA, solid blue squares; LA, solid inverted amber triangles) lighting conditions. Rats were exposed to dark-phase lighting conditions (see Methods) from 1800 to 0600 (dark bars). TFA values (mean ± 1 SD; n = 12 per group) are the sums of myristic, palmitic, palmitoleic, stearic, oleic, linoleic, and arachidonic acid concentrations collected at the various time points. Data are plotted twice to better demonstrate rhythmicity. Rhythmicity analysis (Table 3) revealed robust and highly significant (P < 0.0001) rhythmic patterns under control lighting conditions for both groups, with a greater than 6-fold increase in nighttime amplitude compared with daytime amplitude in both groups. Concentrations with asterisks differ (P < 0.05) from concentrations without asterisks.
Arterial blood glucose, lactate, acid-gas levels.
Figure 5 depicts the daily rhythms in levels of arterial blood glucose, lactate, pO2, and pCO2 levels in the naïve male rats from both groups. Phase shifts were determined by comparing the peak values (acrophases) between the rats in blue-tinted (experimental) and clear (control) cages. A ‘phase advance’ was defined as a shift in a group peak level to an earlier time (for example, from 1600 to 1200), whereas a ‘phase delay’ was defined as a shift in a group to a later time (for example, from 0800 to 1200), as compared with control values. Daily rhythms for arterial glucose and lactate concentrations (Figure 5 A and B) were similar between groups, with peaks for both constituents occurring at 1200 and 2000 for the control rats but phase-advanced 4 h at 0800 in the experimental group. However, values over the 24-h day were higher (P < 0.05) in control rats compared with those in blue cages. The average mean blood glucose concentration calculated over the 24-h day was 153.7 ± 2.95 mg/dL for the control group and 141.7 ± 2.14 mg/dL for the experimental group (P < 0.05). The average mean blood lactate concentration calculated over the 24-h day was 1.20 ± 0.01 mmol/L for rats in clear cages and 1.16 ± 0.01 mmol/L for those in blue cages (P < 0.05).
Figure 5.

Diurnal changes in arterial blood (A) glucose, (B) lactate, (C) pO2, and (D) pCO2 levels (mean ± 1 SD; n = 12 per group) of male nude rats maintained under either control (solid black circles) or experimental (solid blue triangles) lighting conditions. Rats were exposed to dark-phase lighting conditions from 1800 to 0600 (dark bars). Data are plotted twice to better visualize rhythmicity. Rhythmicity analysis (Table 3) revealed robust and highly significant (P < 0.0001) rhythmic patterns for both control (A) and experimental (B) groups but a significantly disrupted (P < 0.05) phase pattern only for rats in blue cages. *, Value differs significantly (P < 0.001, Student t test) between experimental and control conditions; concentrations with asterisks differ (P < 0.05) from concentrations without asterisks.
Daily rhythms in arterial pO2 and pCO2 (Figure 5 C and D) followed similar trends as the glucose and lactate rhythms. Peak values of arterial pO2 occurred at 1600 in control rats, with a nadir at 2400, compared with those in the experimental group, which peaked at 0800 and 2000 (in the late dark phase) and were lowest at the middark phase (0400). Values over the 24-h day were significantly higher (P < 0.05) in the experimental group compared with the control group. The calculated mean daily arterial pO2 assessed over the 24-h day (Figure 5 C) was 149.6 ± 2.3 mm Hg for the rats in clear cages and 154.5 ± 2.1 mm Hg in those in blue cages (n = 72 measurements; P < 0.05). The calculated mean daily arterial pCO2 assessed over the 24-h day (Figure 5 D) was 30.8 ± 0.5 mm Hg for the control group and 28.2 ± 0.6 mm Hg for the experimental group (P < 0.05; n = 72 measurements).
Arterial blood pH, O2 saturation, and Hct remained relatively constant for both groups over the 24-h day at 7.44 ± 0.07, 99.1% ± 0.01%, and 45.3% ± 0.05% (n = 72), respectively. These values are consistent with the carotid arterial values in blood acid–gases determined during previous cardiocentesis investigations at this time of day.5,19,21,22
Plasma measures of corticosterone, insulin, and leptin.
Figure 6 depicts daily rhythms in concentrations of arterial blood plasma corticosterone, insulin, and leptin. Plasma corticosterone levels revealed clear differences between the control and experimental groups, with regard to integrative concentrations but not circadian rhythms. Values for arterial plasma corticosterone in rats of both groups began to increase after 1200 (P < 0.05), with a major peak value occurring at 1600 in the experimental and control (secondary peak; P < 0.05) groups, decreasing to a low value at 2400 (P < 0.05) for both groups. A second major peak occurred in both groups at 0400 (but was higher in control rats), decreasing to a nadir at 0800 for both groups. Integrated plasma corticosterone concentrations calculated over the 24-h day were 692.0 ± 8.3 ng/mL in the control animals as compared with 912.0 ± 12.1 nmol/L in the experimental group.
Figure 6.

Diurnal changes in plasma (A) corticosterone, (B) insulin, and (C) leptin concentrations (mean ± 1 SD; n = 12 per group) in the arterial blood of rats maintained on either control (solid black circles) or experimental (solid blue squares) lighting conditions. Data are plotted twice to better demonstrate rhythmicity. Rats were exposed to dark-phase lighting conditions from 1800 to 0600 (dark bars). Rhythmicity analysis (Table 3) revealed robust and highly significant (P < 0.0001) rhythmic patterns under control conditions, significant (P < 0.05) but disrupted rhythmic patterns under experimental conditions for corticosterone, insulin, and leptin. *, Value differs significantly (P < 0.001) between experimental and control conditions; concentrations with asterisks are different (P < 0.05) than concentrations without asterisks.
Plasma concentrations of insulin (Figure 6 B) showed clear intergroup differences with regard to daily rhythms and integrative levels. Values for arterial plasma insulin in control animals were at their highest levels 2 h after onset of the light phase (0800), with a second, minor peak prior to onset of the dark phase (1600), and lowest levels occurred throughout the light phase (1200–1600). Rats in blue cages showed peak insulin levels 2 h prior to onset of the light phase (0400), with a second, minor peak occurring at 1200; in addition, these peaks were phase-advanced 4 h compared with those in controls (Table 3). Peak insulin levels were similar between groups. Whereas control rats experienced a rapid increase to peak insulin levels at 0800, followed by a rapid decline, this process was more protracted in the experimental group, with insulin gradually increasing after the onset of dark phase over 8 h, rapidly declining over 4 h from their peak at 0400 to the lowest levels at 0800, and increasing once again to a secondary peak at 1200, when levels were lowest for control rats (P < 0.05). Integrated mean plasma insulin concentrations calculated over the 24-h day were significantly different (P < 0.001), at 20.4 ± 0.06 ng/mL for rats in clear cages and 24.3 ± 0.10 ng/mL for those in blue cages.
Plasma concentrations of leptin (Figure 6 C) revealed clear intergroup differences with regard to diurnal rhythms (Table 3) and integrative levels. For both groups, values for arterial plasma leptin began to increase 2 h after the onset of the dark phase (P < 0.05), with peak levels in both groups occurring at 2400 and gradually decreasing to a nadir at 0400 (P < 0.05) in controls. This process was again more protracted in the experimental group, with the nadir occurring 8 h after the nighttime peak at 2400 and then rising again to a second, similar, albeit broader, peak at 1200, compared with that in control rats (P < 0.05); in addition, peaks and nadirs in the experimental group were phase-advanced 4 h compared with those in controls. Nadirs in blood leptin concentrations were achieved at 0800 and 2000 in rats in blue cages. Integrated plasma leptin concentrations calculated over the 24-h day were 3.04 ± 0.03 ng/mL in controls and 3.70 ± 0.02 ng/mL in rats in blue cages.
Tumor growth rates.
The latency-to-onset of tumor appearance after xenograft implantation, which measured the time between implantation until the first palpable mass (approximately 10 mm3) and the tumor growth rate were 15 d and 0.60 ± 0.04 g/day in controls, respectively, and 22 d and 0.27 ± 0.02 g/day in the experimental group, respectively (Figure 7). These values represent a nearly 50% increase (P < 0.05) in tumor latency-to-onset and a 55% decrease in the tumor growth rate in rats in blue compared with clear cages. Although the mean tumor weight was nearly identical between the groups at the time of harvest (control, 7.40 ± 0.33 g; experimental, 7.33 ± 0.26 g), the day of tumor harvest was delayed by more than 90% in rats in blue cages (day 46 after implantation) compared with control rats (day 24).
Figure 7.

Effects on tissue-isolated PC3 human prostate cancer xenografts growing in nude male rats after implantation (day 0) in rats housed in blue cages (solid blue triangles) compared with those in clear cages (solid red circles). Each point represents the mean (± 1 SD) estimated tumor weight mean (n = 12 per group). Tumor growth rates differed significantly (P < 0.001) between groups.
Tumor A-V measurements.
We tested whether tumor xenografts themselves exhibited differences in cAMP levels, TFA and LA uptake, 13-HODE release, [3H]thymidine incorporation into tumor DNA, and Warburg effect as a result of daytime blue-light exposure and altered arterial plasma melatonin levels at the time of harvest (Table 4). None of the tumor levels of these constituents in controls at 0800 differed from those of the experimental group at 1200, when arterial plasma melatonin levels were not significantly different from one another and were at normal physiologic daytime concentrations (greater than 3 pg/mL). Tumor cAMP levels, TFA and LA uptake, 13-HODE release, [3H]thymidine incorporation into tumor DNA at 0800 were decreased significantly (P < 0.001) by 41.5%, 70.3% and 67.8, 49.1%, and 48.5%, respectively, in rats in blue compared with clear cages. The same parameters were still markedly depressed (P < 0.001) by 42.0%, 71.6% and 67.8%, 50.3%, and 49.8%, respectively, in the tumors harvested from blue-caged rats at 0800 compared with 1200, when melatonin levels remained over 200% higher than the normal daytime (0800) levels of the control group (1.50 pg/mL) or experimental group (7.79 pg/mL). Tumor cAMP levels, TFA and LA uptake, 13-HODE release, [3H]thymidine incorporation into tumor DNA were depressed by 69.6%, 100% and 100%, 100%, 87.5%, and 87.5%, respectively, in the tumors harvested from the experimental group at 2400 h, compared with the control group at 0800 or the experimental group at 1200 h, when melatonin levels were nearly 6500% higher.
Table 4.
Effects of daytime (0800 and 1200) and nighttime (2400) arterial blood plasma melatonin concentration on tumor cAMP level, TFA and LA uptake, 13-HODE production, and tumor [3H]thymidine incorporation and DNA content (mean ± 1 SD, n = 12) measured across PC3 human prostate tumor xenografts in situ
| cAMP (nmol/g tissue) | TFA uptake (μg/min/g) (% of arterial supply) | LA uptake (μg/min/g) (% of arterial supply) | 13-HODE (ng/min/g) |
[3H]thymidine incorporation (dpm/μg DNA) | DNA content (mg/g) | Plasma melatonin (pg/mL) | ||
| Arterial supply | Venous output | |||||||
| Clear cages, 0800 | 1.295 ± 0.078 | 6.61 ± 1.08 (30.4% ± 2.3%) | 1.52 ± 0.12 (31.0% ± 1.6%) | not detectable | 29.43 ± 1.98 | 45.6 ± 1.5 | 3.2 ± 0.1 | 1.50 ± 0.40 |
| Blue cages, 0800 | 0.758 ± 0.041 | 2.01 ± 0.28a (9.0% ± 1.2%) | 0.74 ± 0.11a (10.1% ± 1.2%) | not detectable | 15.33 ± 0.99a | 23.2 ± 1.4a | 2.8 ± 0.07a | 31.24 ± 2.34a |
| Blue cages, 1200 | 1.307 ± 0.085a,b | 5.60 ± 1.81a,b (31.7% ± 2.9%) | 1.54 ± 0.25a,b (31.0% ± 2.5%) | not detectable | 30.86 ± 2.31b | 46.2 ± 1.7b | 3.2 ± 0.1b | 7.79 ± 1.81a,b |
| Blue cages, 2400 | 0.394 ± 0.058a,b,c | −0.05 ± 0.06a,b,c (0.02% ± 0.03%) | −0.02 ± 0.03a,b,c (-0.2% ± 0.3%) | not detectable | not detectablea,b,c | 5.6. ± 1.0a,b,c | 2.8±0.09a,b,c | 968.3 ± 102.2a,b,c |
Tumor weight, 7.40 + 0.28 g.
P< 0.05 compared with value at 0800 for rats in clear cages.
P < 0.05 compared with value at 0800 for rats in blue cages
P < 0.05 compared with value at 1200 for rats in blue cages
Arterial glucose supply to the tumors and A-V differences for glucose, lactate, pO2 and pCO2 in vivo were measured across the prostate cancer tumor xenografts of both groups at 0800, 1200, and 2400 (Table 5). The rates of tumor glucose uptake and lactate production and of pO2 uptake and pCO2 release at 0800 and 1200 in the experimental group were identical to those in controls at 0800. The rates of tumor glucose uptake and lactate production and of pO2 uptake and pCO2 release, in group B at 0800, were decreased (P < 0.05) by 23.2%, 25.3%, 12.9%, and 20.4%, respectively, compared with those parameters in the control group at 0800 and the experimental group at 1200. The rates of tumor glucose uptake and lactate production and of pO2 uptake and pCO2 release at 2400 in rats in blue-tinted cages were suppressed significantly (P < 0.05) by 59.1%, 52.7%, 56.9%, and 46.9%, respectively, compared with those in controls at 0800 and in the experimental group at 1200 and by 46.8%, 29.3%, 25.8, and 32.9%, respectively, compared with those in rats in blue cages at 0800.
Table 5.
Effects of daytime (0800 and 1200) and nighttime (2400) arterial blood melatonin concentration on arterial glucose supply and tumor uptake, lactic acid production, and tumor pO2uptake and pCO2release (mean ± 1 SD, n= 12 per group) measured across PC3 human prostate tumor xenografts in situ in rats of group A and B
| Arterial glucose supply (µg/min/g) | Glucose uptake (µg/min/g) (% of arterial supply) | Lactic acid production (µmol/min/g) (% of arterial supply) | pO2(mm Hg) Artery – vein (% of arterial supply) | pCO2(mm Hg) Artery – vein (% of arterial supply) | |
| Clear cages, 0800 | 12.9 ± 1.3 | 3.45 ± 0.4 | −25.56 ± 1.67 | 110.1 ± 2.3 | −33.0 ± 1.4 |
| (30.6% ± 1.8%) | (–205.3% ± 4.2%) | (69.9% ± 4.2%) | (–108.0% ± 4.4%) | ||
| Blue cages, 0800 | 12.9 ± 1.6 | 2.65 ± 0.3a | −19.40 ± 1.20a | 96.8 ± 1.2a | −26.6 ± 1.2a |
| (22.6% ± 2.1%) | (153.4% ± 7.3%) | (61.2% ± 0.7%) | (86.1% ± 4.3%) | ||
| Blue cages, 1200 | 16.1 ± 1.8 | 3.30 ± 0.3b | −25.08 ± 2.10b | 110.1 ± 1.4b | −33.8 ± 1.1 |
| (29.7% ± 1.0%) | (-205.4% ± 4.5%) | (69.7% ± 1.0%) | (–110.3% ± 1.0%) | ||
| Blue cages, 2400 | 53.3 ± 4.5a | 1.41 ± 0.11a,b,c | −12.08 ± 0.60a,b,c | 63.1 ± 2.10a,b,c | −16.9 ± 1.0 |
| (10.2% ± 0.5%) | (–108.5% ± 3.1%) | (45.4% ± 1.5%) | (–57.8% ± 1.4%) |
Tumor weight, 7.40 + 0.28 g.
P< 0.05 compared with value for rats in clear cages.
P < 0.05 compared with value at 0800 for rats in blue cages
P < 0.05 compared with value at 1200 for rats in blue cages
Western blot analysis of AKT, NFκB, GSK3β, ERK 1/2, CREB, and PDK1.
Figure 8 depicts the Western blot analysis of phosphorylated (upper panel) and total (lower panel) forms of AKT, NFκB, GSK3β, ERK 1/2, CREB, PDK1—all of which are important transcriptional regulators of the Warburg effect—and the housekeeping protein β-actin in human prostate tumor xenografts.5 Phosphorylated forms of AKT, GSK3β, ERK 1/2, and CREB were decreased in the presence of melatonin in the arterial blood of tumors harvested at 0800 (greater than 30 pg/mL) and 2400 (greater than 900 pg/mL) from rats in blue-tinted cages compared with the levels of these constituents when exposed to normal daytime level of melatonin (less than 10 pg/mL) in control tumors harvested at 0800, whereas total protein concentrations were either similar (AKT, NFκB, GSK3β, and CREB) between groups or elevated (PDK1) in rats in blue compared with clear cages. Concentrations of phosphorylated and total forms of AKT, NFκB, GSK3β, ERK 1/2, CREB, and PDK1 were all elevated when melatonin levels were lowest in rats in blue-tinted cages (1200), compared with those of animals in both clear and blue cages at 0800 and 2400.
Figure 8.
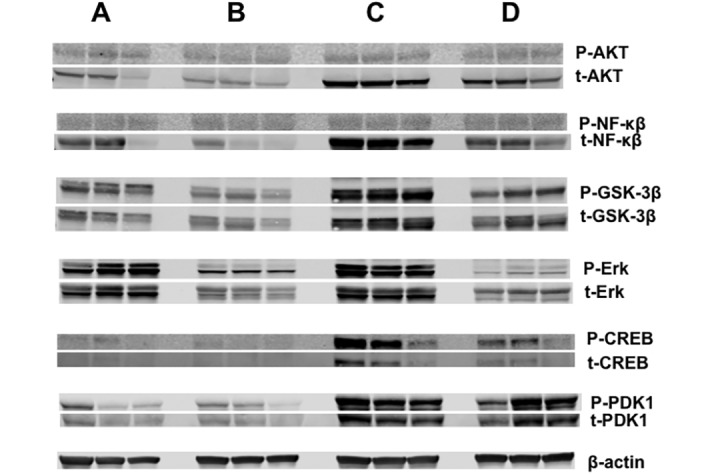
Western blot analysis for the expression of phosphorylated (upper panels) and total (lower panels) forms of AKT, NFκB, GSK3β, ERK 1/2, CREB, and PDK1 in the tumors of the control rats at 0800 (lane A) or of the blue-caged rats at 0800 (lane B), 1200 (lane C), or 2400 (lane D).
Discussion
Given our previous observation that the spectral transmittance of blue-appearing light during the daytime markedly augments the peak amplitude of the nocturnal circadian melatonin signal in male nude rats and circadian rhythms of plasma measures of metabolism and physiology,19,61 we tested the hypothesis that the daytime exposure of these rats to blue light similarly enhances melatonin-induced suppression of PC3 human prostate cancer xenograft metabolism, signaling activity, and growth progression. This study is the first to show that long-term exposure of PC3 prostate cancer-bearing nude male rats to supra-physiologic nighttime melatonin levels induced by blue-appearing light during the daytime resulted in a marked downregulation of tumor cAMP levels, LA uptake, 13-HODE production, the Warburg effect (for example, glucose uptake and lactate production), relevant signal transduction pathways (for example, cAMP, CREB, AKT, ERK 1/2, GSK3β, NFκB, and PDK1), and cell proliferative activity that culminated in tumor growth rates that were substantially slower (for example, more than 50%) than those of xenografts inhibited by the ‘normal’ physiologic melatonin signal.
The apparent paradox of bright blue light during the day stimulating a nearly 6-fold increase in the peak amplitude (approximately 900 pg/mL) of the nocturnal plasma melatonin surge over the ‘normal’ nocturnal melatonin peak (approximately 150 pg/mL) both in the present and our previous study19 is not without precedent. For example, other investigators noted similar findings in nocturnal pineal levels of melatonin in male rats exposed to bright sunlight (rich in blue wavelengths) over a 13-h day, as compared with the light emitted by cool-white fluorescent luminaires in an animal room for the same period of time during the day.4,7 The underlying mechanism, however, by which either light spectral transmittance (wavelength) or intensity during the light phase induces enhanced melatonin production during the subsequent dark phase of a 24-h day is unknown. In addition, decreased long wavelength (red) was seen during the blue-tinted spectral power distribution measurements (Figure 2) and cannot be ruled out as a causative factor. The remarkably high nocturnal levels of circulating melatonin concentrations observed here are presumably due to a stimulation of melatonin synthesis, albeit a concomitant inhibition of hepatic melatonin metabolism cannot be completely ruled out as a contributing factor. Interestingly, the high melatonin concentrations achieved early in the dark phase (at 2000) were equivalent to the peak levels reached 4 h later in the control group during the middark phase (at 2400). Moreover, the markedly elevated nocturnal melatonin levels persisted beyond the dark phase into the light phase (0800) by at least 4 h, because they were still 30-fold higher than those in the controls at the same circadian time point. Therefore, the early and robust nocturnal rise in melatonin coupled with its high concentrations well into the light phase prolonged the duration of the melatonin signal and, in effect, extended the length of the ‘biological night’ into the daytime period. One might speculate that the extension of elevated melatonin titers into the light phase could have been attributed to ‘slower’ hepatic melatonin metabolism relative to pineal melatonin production. Because light has a gating effect on pineal melatonin synthesis, melatonin levels would have been expected to plummet in response to lights-on at 0600 if the extended melatonin duration was due exclusively to persistent, albeit, diminishing pineal melatonin production.
With the exception of the circadian rhythm for blood TFA, including LA levels, all physiologic and metabolic rhythms in host animals (prior to tumor implantation) were changed to a lesser or greater degree in response to the altered spectral transmittance of light of bright, blue-appearing light compared with broad-spectrum light during the light phase. Depending on the circulating factor measured, the alterations included changes in rhythm amplitude, phasing, or duration or combinations of these circadian rhythm characteristics. These altered rhythms appeared to be completely independent from those generated by the suprachiasmatic nucleus in the dietary intake of TFA, which were nearly identical for both the control and experimental groups, indicating that the phasing of overall rhythmicity of the suprachiasmatic nucleus was intact and unaffected by short wavelengths during the light phase. This inference is further corroborated by the fact that although the melatonin amplitudes were markedly different, the acrophases of the suprachiasmatic-nucleus–driven melatonin rhythms in both groups were identical.
In rats exposed to blue light, circadian oscillations in arterial plasma glucose and lactate levels and in arterial pO2 and pCO2 were, in general, phase-advanced by 4 h, whereas overall 24-h integrated levels were decreased, as previously observed in female nude rats,19 suggesting lower rates of basal metabolism in these animals as compared with the control group. Similarly, circadian variations in the phasing, amplitude, and duration of corticosterone, insulin, and leptin, which all have crucial effects on whole-animal metabolism, were altered in response to exposure to daytime short wavelengths, again corroborating the same changes in these parameters demonstrated in our previous study in nude female rats.19
Melatonin exerts regulatory effects on glucose and lactate metabolism as well as on corticosterone, insulin, and leptin levels in humans9,43,54 and rats.18,27,42,47,48 Arguably, the marked circadian changes in melatonin levels in rats exposed to blue light may have been responsible for some of the circadian changes in these hormones as observed in the present study in nude male rats and our previous study in female nude rats. This contention is further supported, in part, by our previous observations in nude rats19,22,24 that the spectral transmittance of longer wavelength light through either amber- or red-tinted cages resulted in circadian melatonin as well as metabolic and hormonal profiles that markedly differed from the circadian profiles seen here and in our previous blue-light study.19 This pattern suggests that each circadian response is dependent on exposure to a specific wavelength as conveyed to peripheral tissues by a corresponding wavelength-dependent melatonin signature. Because the exact mechanism by which this effect might occur is unknown, other wavelength-dependent but melatonin-independent factors that influence circadian hormonal and neural outputs from the suprachiasmatic nucleus should be considered.
We have previously demonstrated that the ‘normal’ physiologic nocturnal blood concentrations of melatonin that peak during the middark phase under 12:12-h light:dark conditions in animal rooms are sufficient to significantly slow the rates of cell proliferation and overall growth of human breast cancer xenografts, which are characteristically rapid during the daytime in the presence of white fluorescent light.5,22 This effect occurs via the ability of the physiologic nocturnal melatonin signal to stymie the increased activation of tumor signal transduction activity, LA uptake and metabolism to 13-HODE, and the Warburg effect that normally occurs during the light phase. Exposure of tumor-bearing rats to dim light at night suppresses melatonin production nearly completely, resulting in the further activation of signaling, metabolism, and cell proliferation 24 h daily, thus culminating in a more than 2-fold increase in tumor growth rates.5,7,18,21,50,61 Conversely, in the current investigation, the marked suppression of prostate cancer metabolism, signaling, and growth in response to short wavelength light probably can be attributed primarily to the rapid early dark-phase increase and extended duration of the nocturnal melatonin signal rather than to its ‘exaggerated’ peak amplitude. The strong suppression of tumor growth and metabolism was most likely due to the prolonged presence of tumor-inhibitory blood levels of melatonin rather than to its increased amplitude (nearly 5 nM) and is supported by the fact that the inhibition of tumor proliferative activity and metabolism by melatonin during short-term tumor perfusion in situ saturates at approximately 1 nM (that is, 232 pg/mL).7 Perhaps the enhanced tumor inhibition would not have occurred in the same way had the xenografts been exposed to a longer duration of elevated nocturnal melatonin levels as a result of rats being housed in a short photoperiod (for example, 8:16-h light:dark photocycle).
Currently, a standardized, single measurement unit for quantifying light that regulates the circadian, neuroendocrine, and neurobehavioral effects of light is not available. A recent consensus position was developed across many of the laboratories that have studied wavelength regulation of the biologic and behavioral effects of light in rodents, humans, and other species for best practices for measuring and reporting experimental light stimuli.49 With that consensus, a freely available web-based toolbox52 was provided that permits the calculation of the effective irradiance experienced by each of the rodent ipRGC, cone, and rod photoreceptors that are capable of driving circadian, neuroendocrine and neurobehavioral effects.36 It is interesting that the clear cages transmit more total light to rats inside the cages but less effective stimulation to each of the retinal photoreceptors. Abundant data have illustrated that the melanopsin-containing ipRGC are anatomically and functionally interconnected with the rods and cones that support vision. Physiologic responses to light reflect input from all of the retinal photoreceptor classes, with the relative importance of each being labile within and between response types. Therefore, the spectral sensitivity of this photoreceptive system is fundamentally context-dependent.1,16,30,32,33,35,41,42,48,49,53,61 It is important for different groups of investigators to use commonly accepted metrics for reporting spectral response functions to be able to pool results, such as those shown in Table 1. As data using this measurement system accumulate from different laboratories, it will become possible to generate testable hypotheses that predict the spectral characteristics for a targeted physiologic response to light.
Light intensity, spectral quality, and duration are of paramount importance in regulation of mammalian circadian rhythms. Variations in any of these parameters affect virtually every biologic process associated with animal physiology and metabolism. The nocturnal melatonin signal represents the internal zeitgeber responsible for normal host circadian rhythms of metabolism, as well as tumor rhythms in metabolism, signaling, and proliferation. The present investigation provides compelling evidence for the hypothesis that supraphysiologic nocturnal levels of melatonin, as evinced in rats exposed to blue spectrum light during the daytime, may contribute to the circadian reorganization of the host metabolic and hormonal milieu as they greatly enhance the suppression of tumor metabolism, signaling activity, proliferative activity, and growth. Additional studies in both rats and human subjects are warranted to better understand the potentially beneficial effects of daytime blue-light exposure and high nocturnal melatonin levels in the host and the inhibition of human tumor metabolic signaling mechanisms, metabolism, and proliferative activity that could lead to novel therapeutic interventions and/or cancer preventive measures.
Acknowledgments
This work was supported in part by a Tulane University School of Medicine and Louisiana Cancer Research Consortium Startup Grant (no. 631455 to DEB) and by an American Association for Laboratory Animal Science Grants for Laboratory Animal Science Award (to RTD and DEB). Additional support for the Jefferson coinvestigators (JPH, BW, and GCB) was from The Institute for Integrative Health (Baltimore, MD) and the National Science Foundation (no. EEC-0812056 to GCB). We acknowledge and are grateful for the technical support of Dr Georgina Dobek, Ms Lynell Dupepe, Ms Patricia Beavers, and Mr Michael Webb.
References
- 1.Altimus CM, Guler AD, Alam NM, Arman AC, Prusky GT, Sampath AP, Hattar S. 2010. Rod photoreceptors drive circadian photoentrainment across a wide range of light intensities. Nat Neurosci 13:1107–1112. [DOI] [PMC free article] [PubMed] [Google Scholar]
- 2.Aschoff J. 1981. Handbook of behavioral neurobiology: biological rhythms. New York (NY): Plenum Press. [Google Scholar]
- 3.Bhatti P, Mirrick DK, Davis S. 2012. Invited commentary: shift work and cancer. Am J Epidemiol 176:760–763. [DOI] [PubMed] [Google Scholar]
- 4.Blask DE, Brainard GC, Dauchy RT, Hanifin JP, Davidson LK, Krause JA, Sauer LA, Rivera-Bermudez MA, Dubocovich ML, Jasser SA, Lynch DT, Rollag MD, Zalatan F. 2005. Melatonin-depleted blood from premenopausal women exposed to light at night stimulates growth of human breast cancer xenografts in nude rats. Cancer Res 65:11174–11184. [DOI] [PubMed] [Google Scholar]
- 5.Blask DE, Dauchy RT, Dauchy EM, Mao L, Hill SM, Greene MW, Belancio VP, Sauer LA, Davidson L. 2014. Light exposure at night disrupts host/cancer circadian regulatory dynamics: impact on the Warburg effect, lipid signaling, and tumor growth prevention. PLOS ONE 9:e102776. [DOI] [PMC free article] [PubMed] [Google Scholar]
- 6.Blask DE, Sauer LA, Dauchy RT, Holowachuk EW, Ruhoff MS, Kopff HS. 1999. Melatonin inhibition of cancer growth in vivo involves suppression of tumor fatty acid metabolism receptor-mediated signal transduction events. Cancer Res 59:4693–4701. [PubMed] [Google Scholar]
- 7.Blask DE, Dauchy RT, Sauer LA, Krause JA. 2004. Melatonin uptake and growth prevention in rat hepatoma 7288CTC in response to dietary melatonin: melatonin receptor-mediated inhibition of tumor linoleic acid metabolism to the growth signaling molecule 13-hydroxyoctadecadienoic acid and the potential role of phytomelatonin. Carcinogenesis 25:951–960. [DOI] [PubMed] [Google Scholar]
- 8.Brainard GC. 1989. Illumination of laboratory animal quarters: participation of light irradiance and wavelength in the regulation of the neuroendocrine system, p 69–74. In: Guttman HN, Mench JA, Simmonds RC, Scientists Center for Animal Welfare , Science and animals: addressing contemporary issues. Presented at the Scientists Center for Animal Welfare, Washington DC, 22–25 June 1988. Bethesda (MD): Scientists Center for Animal Welfare. [Google Scholar]
- 9.Brainard GC, Hanifin JP. 2005. Photons, clocks, and consciousness. J Biol Rhythms 20:314–325. [DOI] [PubMed] [Google Scholar]
- 10.Brainard GC, Hanifin JP, Rollag MD, Greeson JM, Byrne B, Glickman G, Gerner E, Sanford B. 2001. Human melatonin regulation is not mediated by the threecone photopic visual system. J Clin Endocrinol Metab 86:433–436. [DOI] [PubMed] [Google Scholar]
- 11.Brainard GC, Richardson BA, King TS, Matthews SA, Reiter RJ. 1983. The suppression of pineal melatonin content and N-acetyltransferase activity by different light irradiances in the Syrian hamster: a dose–response relationship. Endocrinology 113:293–296. [DOI] [PubMed] [Google Scholar]
- 12.Brainard GC, Richardson BA, King TS, Reiter RJ. 1984. The influence of different light spectra on the suppression of pineal melatonin content in the Syrian hamster. Brain Res 294:333–339. [DOI] [PubMed] [Google Scholar]
- 13.Brainard GC, Vaughan MK, Reiter RJ. 1986. Effect of light irradiance and wavelength on the Syrian hamster reproductive system. Endocrinology 119:648–654. [DOI] [PubMed] [Google Scholar]
- 14.Buhr ED, Yoo SH, Takahashi JS. 2010. Temperature as a universal resetting cue for mammalian oscillators. Science 330:379–385. [DOI] [PMC free article] [PubMed] [Google Scholar]
- 15.Commission International de L'Eclarirage. 2003. Ocular lighting effects on human physiology and behavior, p 1–54. In: Technical report 158. Vienna (Austria): Commission Internationale De L'Eclairage. [Google Scholar]
- 16.Dacey DM, Liao HW, Peterson BB, Robinson FR, Smith VC, Pokorny J, Yau KY, Gamlin PD. 2005. Melanopsin-expressing ganglion cells in primate retina signal colour and irradiance and project to the LGN. Nature 433:749–754. [DOI] [PubMed] [Google Scholar]
- 17.Dauchy RT, Blask DE, Sauer LA, Brainard GC, Krause JA. 1999. Dim light during darkness stimulated tumor progression by enhancing tumor fatty acid uptake and metabolism. Cancer Lett 144:131–136. [DOI] [PubMed] [Google Scholar]
- 18.Dauchy RT, Blask DE, Dauchy EM, Davidson LK, Tirrell PC, Greene MW, Tirrell RP, Hill CR, Sauer LA. 2009. Antineoplastic effects of melatonin on a rare malignancy of mesenchymal origin: melatonin receptor-mediated inhibition of signal transduction, linoleic acid metabolism, and growth in tissue-isolated human leiomyosarcoma xenografts. J Pineal Res 47:32–42. [DOI] [PubMed] [Google Scholar]
- 19.Dauchy RT, Dauchy EM, Hanifin JP, Gauthreaux SL, Mao L, Belancio VP, Ooms TG, Dupepe LM, Jablonski MR, Warfield B, Wren MA, Brainard GC, Hill SM, Blask DE. 2013. Effects of spectral transmittance through standard laboratory cages on circadian metabolism and physiology in nude rats. J Am Assoc Lab Anim Sci 52:146–156. [PMC free article] [PubMed] [Google Scholar]
- 20.Dauchy RT, Dauchy EM, Mao L, Belancio VP, Hill SM, Blask DE. 2012. A new apparatus and surgical technique for the dual perfusion of human tumor xenografts in situ in nude rats. Comp Med 62:99–108. [PMC free article] [PubMed] [Google Scholar]
- 21.Dauchy RT, Dauchy EM, Tirrell RP, Hill CR, Davidson LK, Greene MW, Tirrell PC, Wu J, Sauer LA, Blask DE. 2010. Dark-phase light contamination disrupts circadian rhythms in plasma measures of endocrine physiology and metabolism in rats. Comp Med 60:348–356. [PMC free article] [PubMed] [Google Scholar]
- 22.Dauchy RT, Dupepe LM, Ooms TG, Dauchy EM, Hill CR, Mao L, Belancio VP, Slakey LM, Hill SM, Blask DE. 2011. Eliminating animal facility light-at-night contamination and its effect on circadian regulation of rodent physiology, tumor growth, and metabolism: a challenge in the relocation of a cancer research laboratory. J Am Assoc Lab Anim Sci 50:326–336. [PMC free article] [PubMed] [Google Scholar]
- 23.Dauchy RT, Sauer LA. 1986. Preparation of ‘tissue-isolated’ rat tumors for perfusion: a new surgical technique that preserves continuous blood flow. Lab Anim Sci 36:678–681. [PubMed] [Google Scholar]
- 24.Dauchy RT, Wren MA, Dauchy EM, Hanifin JP, Jablonski MR, Warfield B, Brainard GC, Hill SM, Mao L, Dupepe LM, Ooms TG, Blask DE. 2013. Effects of spectral transmittance through red-tinted cages on circadian metabolism and physiology in nude rats. J Am Assoc Lab Anim Sci 52:745–755. [PMC free article] [PubMed] [Google Scholar]
- 25.Dauchy RT, Xiang S, Mao L, Brimer S, Wren MA, Yuan L, Anbalagan M, Hauch A, Frasch T, Rowan BG, Blask DE, Hill SM. 2014. Circadian and melatonin disruption by exposure to light at night drives intrinsic resistance to tamoxifen therapy in breast cancer. Cancer Res 74:4099–4110. [DOI] [PMC free article] [PubMed] [Google Scholar]
- 26.Davis S, Mirick DK, Stevens RG. 2001. Nightshift work, light at night, and the risk of breast cancer. J Natl Cancer Inst 93:1557–1562. [DOI] [PubMed] [Google Scholar]
- 27.Diaz B, Blazquez E. 1986. Effect of pinealectomy on plasma glucose, insulin, and glucagon levels in the rat. Horm Metab Res 18:225–229. [DOI] [PubMed] [Google Scholar]
- 28.Dijk DJ, von Schantz M. 2005. Timing and consolidation of human sleep, wakefulness, and performance by a symphony of oscillators. J Biol Rhythms 20:279–290. [DOI] [PubMed] [Google Scholar]
- 29.Ecker JL, Dumitrescu ON, Wong KY, Alam NM, Chen SK, LeGates T, Renna JM, Prusky GT, Berson DM, Hattar S. 2010. Melanopsin-expressing retinal ganglion-cell photoreceptors: cellular diversity and role in pattern vision. Neuron 67:49–60. [DOI] [PMC free article] [PubMed] [Google Scholar]
- 30.Gabel V, Maire M, Chellappa CF, Reichert SL, Schmidt C, Hommes V, Viola AU, Cajochen C. 2013. Effects of artificial dawn and morning blue light on daytime cognitive performance, wellbeing, cortisol, and melatonin levels. Chronobiol Int 30:988–997. [DOI] [PubMed] [Google Scholar]
- 31.Gamlin PD, McDougal DH, Pokorny J, Smith VC, Yau KW, Dacey DM. 2007. Human and macaque pupil responses driven by melanopsin-containing retinal ganglion cells. Vision Res 47:946–954. [DOI] [PMC free article] [PubMed] [Google Scholar]
- 32.Ge D, Dauchy RT, Liu S, Zhang Q, Mao L, Dauchy EM, Blask DE, Hill SM, Rowan BG, Brainard GC, Hanifin JP, Cecil KS, Xiong Z, Myers L, You Z. 2013. Insulin and IGF1 enhance IL17-induced chemokine expression through a GSK3B-dependent mechanism. J Pineal Res 55:377–387. [DOI] [PMC free article] [PubMed] [Google Scholar]
- 33.Gooley JJ, Rajaratnam SM, Brainard GC, Kronauer RE, Czeisler CA, Lockley SW. 2010. Spectral responses of the human circadian system depend on the irradiance and duration of exposure to light. Sci Transl Med 2:31ra33. [DOI] [PMC free article] [PubMed] [Google Scholar]
- 34.Hansen J. 2001. Increased breast cancer risk among women who work predominantly at night. Epidemiology 12:74–77. [DOI] [PubMed] [Google Scholar]
- 35.Hansen T, Bratlid T, Lingjarde O, Brenn T. 1987. Midwinter insomnia in the subarctic region: evening levels of serum melatonin and cortisol before and after treatment with bright artificial light. Acta Psychiatr Scand 75:428–434. [DOI] [PubMed] [Google Scholar]
- 36.Hattar S, Lucas RJ, Mrosovsky N, Thompson S, Douglas RH, Hankins MW, Lem J, Biel M, Hofmann F, Foster RG, Yau KW. 2003. Melanopsin and rod-cone photoreceptive systems account for all major accessory visual functions in mice photosensitivity. Nature 424:76–81. [DOI] [PMC free article] [PubMed] [Google Scholar]
- 37.Hughes ME, Hogenesch JB, Kornacker K. 2010. JKT_CYCLE: an efficient nonparametric algorithm for detecting rhythmic components in genome-scale data sets. J Biol Rhythms 25:372–380. [DOI] [PMC free article] [PubMed] [Google Scholar]
- 38.Illnerova H, Vanecek J, Hoffman K. 1983. Regulation of the pineal melatonin concentration in the rat (Rattus norvegicus) and the Djungarian hamster (Phodopus sungorus). Comp Biochem Physiol A Comp Physiol 74:155–159. [DOI] [PubMed] [Google Scholar]
- 39.Institute for Laboratory Animal Research. 2011. Guide for the care and use of laboratory animals, 8th ed. Washington (DC): National Academy Press. [Google Scholar]
- 40.Illuminating Engineering Society of North America. 2008. Light and human health: an overview of the impact of optical radiation on visual, circadian, neuroendocrine, and neurobehavioral responses. New York (NY): Illuminating Engineering Society of North America. [Google Scholar]
- 41.Jasser SA, Hanifin JP, Rollag MD, Brainard GC. 2006. Dim light adaptation attenuates acute melatonin suppression in humans. J Biol Rhythms 21:394–404. [DOI] [PubMed] [Google Scholar]
- 42.Jung-Hynes B, Schmit TL, Reagan-Shaw SR, Siddiqui IA, Mukhtar H, Ahmad N. 2011. Melatonin, a novel Sirt1 inhibitor, imparts antiproliferation effects against prostate cancer in vitro in culture and in vivo in TRAMP model. J Pineal Res 50:140–149. [DOI] [PMC free article] [PubMed] [Google Scholar]
- 43.Kalsbeek A, Strubbe JH. 1998. Circadian control of insulin secretion is independent of the temporal distribution of feeding. Physiol Behav 63:553–558. [DOI] [PubMed] [Google Scholar]
- 44.Kennaway DJ, Voultsios A, Varcoe TJ, Moyer RW. 2002. Melatonin in mice: rhythms, response to light, adrenergic stimulation, and metabolism. Am J Physiol Regul Integr Comp Physiol 282:R358–R365. [DOI] [PubMed] [Google Scholar]
- 45.Klein DC, Weller JL. 1972. Rapid light-induced decrease in pineal serotonin N-acetyltransferase activity. Science 177:532–533. [DOI] [PubMed] [Google Scholar]
- 46.Kubo T, Ozasa K, Mikami K, Wakai K, Fujino Y, Watanabe Y, Miki T, Nakao M, Hayashi K, Suzuki K, Mori M, Washio M, Sakauchi F, Ito Y, Yoshimura T, Tamakoshi A. 2006. Prospective cohort study of the risk of prostate cancer among rotating-shift workers: findings from the Japan collaborative cohort study. Am J Epidemiol 164:549–555. [DOI] [PubMed] [Google Scholar]
- 47.Laakso ML, Porkka-Heiskanen T, Alila A, Peder M, Johansson G. 1988. Twenty-four-hour patterns of pineal melatonin and pituitary and plasma prolactin in male rats under ‘natural’ and artificial lighting conditions. Neuroendocrinology 48:308–313. [DOI] [PubMed] [Google Scholar]
- 48.Lima FB, Machado UF, Bartol I, Seraphim PM, Sumida DH, Moraes SM, Hell NS, Okamoto NM, Saad MJ, Carvalho CR, Cipolla-Neto J. 1998. Pinealectomy causes glucose intolerance and decreases adipose cell responsiveness to insulin in rats. Am J Physiol 275:E934–E941. [DOI] [PubMed] [Google Scholar]
- 49.Lucas RJ, Pierson SN, Berson DM, Brown TM, Cooper HM, Czeisler CA, Figueiro MG, Gamlin PD, Lockely SW, O'Hagan JB, Price LLA, Provencio I, Skene DJ, Brainard GC. 2014. Measuring and using light in the melanopsin age. Trends Neurosci 37:1–9. [DOI] [PMC free article] [PubMed] [Google Scholar]
- 50.Mao L, Dauchy RT, Blask DE, Slakey LM, Xiang S, Yuan L, Dauchy EM, Shan B, Brainard GC, Hanifin JP, Frasch T, Duplessis TT, Hill SM. 2012. Circadian gating of epithelial-to-mesenchymal transition in breast cancer cells via melatonin-regulation of GSK3β. Mol Endocrinol 26. [DOI] [PMC free article] [PubMed] [Google Scholar]
- 51.Nelson DL, Cox MM. 2005. Hormonal regulation of food metabolism, p 881–992; In: Nelson DL, Cox MM. Lehninger principles of biochemistry, 4th ed. New York (NY): WH Freeman. [Google Scholar]
- 52.Nuffield Department of Clinical Neurosciences Medical Sciences Division. [Internet]. 2015. Rodent Toolbox v1.xlsx. [Cited 12 March 2015]. Available at: http://www.ndcn.ox.ac.uk/team/stuart-peirson.
- 53.Panda S, Provencio I, Tu DC, Pires SS, Rollag MD, Castrucci AM, Pletcher MT, Sato TK, Wiltshire T, Andahazy M, Kay SA, Van Gelder RN, Hogenesch JB. 2003. Melanopsin is required for non-image-forming photic responses in blind mice. Science 301:525–527. [DOI] [PubMed] [Google Scholar]
- 54.Reiter RJ. 1991. Pineal gland interface between photoperiodic environment and the endocrine system. Trends Endocrinol Metab 2:13–19. [DOI] [PubMed] [Google Scholar]
- 55.Rollag MD, Niswender GD. 1976. Radioimmunoassay of serum concentrations of melatonin in sheep exposed to different lighting regimens. Endocrinology 98:482–489. [DOI] [PubMed] [Google Scholar]
- 56.Sainz RM, Mayo JC, Tan DX, Leon J, Manchester L, Reiter RJ. 2005. Melatonin reduces prostate cancer cell growth leading to neuroendocrine differentiation via a receptor- and PKA-independent mechanism. Prostate 63:29–43. [DOI] [PubMed] [Google Scholar]
- 57.Schernhammer ES, Laden F, Speizer FE, Willett WC, Hunter DJ, Kawachi I, Colditz GA. 2001. Rotating night shifts and risk of breast cancer in women participating in the nurses’ health study. J Natl Cancer Inst 93:1563–1568. [DOI] [PubMed] [Google Scholar]
- 58.Sigurdardottir LG, Valdimarsdottir UA, Fall K, Rider JR, Lockley SW, Schernhammer E, Mucci LA. 2012. Circadian disruption, sleep loss, and prostate cancer risk: a systematic review of epidemiologic studies. Cancer Epidemiol Biomarkers Prev 21:1002–1011. [DOI] [PMC free article] [PubMed] [Google Scholar]
- 59.Weng S, Estevez ME, Berson DM. 2013. Mouse ganglion-cell photoreceptors are driven by the most sensitive rod pathway and by both types of cones. PLoS One 8:e66480. [DOI] [PMC free article] [PubMed] [Google Scholar]
- 60.Wren MA, Dauchy RT, Hanifin JP, Jablonski MR, Warfield B, Brainard GC, Blask DE, Hill SM, Ooms TG, Bohm RP., Jr 2014. Effect of different spectral transmittances through tinted animal cages on circadian metabolism and physiology in Sprague–Dawley rats. J Am Assoc Lab Anim Sci 53:44–51. [PMC free article] [PubMed] [Google Scholar]
- 61.Wu J, Dauchy RT, Tirrell PC, Wu SS, Lynch DT, Jitawatanarat P, Burrington CM, Dauchy EM, Blask DE, Greene MW. 2011. Light at night activates IGF1R–PDK1 signaling and accelerates tumor growth in human breast cancer xenografts. Cancer Res 71:2622–2631. [DOI] [PubMed] [Google Scholar]