

Abstract
Objective
To estimate the causal effects of use of an online smoking cessation community on 30-day point prevalence abstinence at 3 months.
Methods
Participants were N=492 adult current smokers in the enhanced Internet arm of The iQUITT Study, a randomized trial of Internet and telephone treatment for smoking cessation. All participants accessed a web-based smoking-cessation program that included a large, established online community. Automated tracking metrics of passive (e.g., reading forum posts, viewing member profiles) and active (e.g., writing forum posts, sending private messages) community use were extracted from the site at 3 months. Self-selected community use defines the groups of interest: “None”, “Passive”, and “Both” (passive+active). Inverse probability of treatment weighting corrected for baseline imbalances on demographic, smoking, psychosocial, and medical history variables. Propensity weights estimated via generalized boosted models were used to calculate Average Treatment Effects (ATE) and Average Treatment effects on the Treated (ATT).
Results
Patterns of community use were: None=198 (40.2%), Passive=110 (22.4%), and Both=184 (37.4%). ATE-weighted abstinence rates were: None=4.2% (95% CI=1.5–6.9); Passive=15.1% (95% CI=8.4–21.9); Both=20.4% (95% CI=13.9–26.8). ATT-weighted abstinence rates indicated even greater benefits of community use.
Conclusions
Community users were more likely to quit smoking at 3 months than nonusers. The estimated benefit from use of online community resources was even larger among subjects with high propensity to use them. No differences in abstinence emerged between passive and passive/active users. Results suggest that lurking in online communities confers specific abstinence benefits. Implications of these findings for online cessation communities are discussed.
Keywords: Smoking cessation, online community, propensity weighting, e-health, social network
For nearly 15 years, online communities have been an integral part of web-based smoking cessation programs (Cobb, Graham, Byron, Niaura, & Abrams, 2011). Online communities are social networks formed or facilitated through electronic media where members share experiences, ask questions, and provide emotional support (Eysenbach, Powell, Englesakis, Rizo, & Stern, 2004). “Created” (Cobb, Graham, & Abrams, 2010) or “intentionally designed” (Centola, 2013) communities within web-based cessation programs are distinct from social networks like Facebook in that they are most often comprised of strangers united by a common focus on quitting smoking. Online communities have evolved over time from the simple exchange of messages via email lists to complex networks with multiple modes of communication (e.g., forums, private messaging), self-representation (e.g., personal profiles, blogs, journals), and affiliations (e.g., friend lists, groups) (Cobb et al., 2010).
The reach of online cessation communities to current and former smokers interested in quitting and maintaining abstinence is quite large. Several open-access web-based cessation programs based in the U.S. accrue hundreds of thousands of new registered users each year (Cobb & Graham, 2006; McCausland et al., 2011), many of whom are active in each program’s community. As of 2014, quitlines in 51 U.S. states and territories provide web-based cessation services and 26 include an online community (North American Quitline Consortium, 2014). Commercial programs reach thousands of smokers through employers and health plans (Alere Wellbeing Inc., 2014; National Jewish Health, 2015). The broad reach of these online communities – and others around the globe (van Mierlo, Voci, Lee, Fournier, & Selby, 2012; Wangberg, Nilsen, Antypas, & Gram, 2011) – makes understanding their impact on smoking cessation an important topic with both scientific and clinical implications.
Several observational studies have reported that participation in online communities for cessation may be a key driver of abstinence (An et al., 2008; Cobb, Graham, Bock, Papandonatos, & Abrams, 2005; Richardson et al., 2013). For example, Cobb et al. (Cobb et al., 2005) found that individuals who participated in any aspect of the online community were more than three times as likely to be abstinent at 90 days as those who did not use the community. Quitters were more likely to have posted in forums, made an online buddy, and sent/received private messages than those who did not quit. Richardson et al. (2013) reported a dose response relationship between online community use and abstinence after controlling for intensity of use and numerous covariates.
Though engagement in online social networks for cessation appears to be associated with higher rates of abstinence, the causal nature of this relationship has yet to be demonstrated. A primary challenge in determining the causal impact of participation in an online community is that it may not be feasible (or even prudent) to randomize participants to “use” or “not use” an online community. By definition, a community is a specific group of people who have developed relationships around a strong common interest (Millington, 2012). Interpersonal relationships meaningful enough to spur behavior change cannot be randomized. Individuals decide whether and how to participate in online communities based on their own unique needs and desires for information and support, their interest in finding “similar others”, and their ability to form interpersonal relationships, among myriad other reasons (Preece, Nonnecke, & Andrews, 2004).
Given the lack of randomization, the compelling association between online community use and abstinence in these prior studies may be partly or entirely related to selection bias (Imai, Keele, Tingley, & Yamamoto, 2011). Any number of measured or unmeasured factors could confound an observed relationship between use of an online community and cessation. These factors could be personal (e.g., gender, use of other online networks), smoking-related (e.g., confidence in quitting, nicotine dependence), or other characteristics (e.g., social isolation, negative partner support) that may increase the likelihood of community participation. Self-selection is a vexing problem inherent to the study of online communities and social networks.
This study examined whether participation in an online community for smoking cessation increased the odds of abstinence using propensity score methods to account for the lack of randomization. Data were drawn from one arm of The iQUITT Study, a randomized trial of Internet and telephone treatment for smoking cessation (Graham et al., 2011). Analyses addressed three questions: 1) What are the patterns of online community participation among users of a web-based smoking cessation program?; 2) What characteristics distinguish groups of online community users?; and 3) Is online community use predictive of abstinence in analyses that account for the possibility of self-selection bias?
Method
Participants
The iQUITT Study was conducted from March 2005 through November 2008. Participants in The iQUITT Study were N=2005 smokers aged 18 and older in the United States who smoked 5 or more cigarettes per day. Smokers who used the terms “quit(ting) smoking”, “stop(ping) smoking”, or “smoking” in a major Internet search engine and who clicked on a link to the cessation website being evaluated (www.quitnet.com) were recruited (Graham, Bock, Cobb, Niaura, & Abrams, 2006). Following online informed consent and a baseline telephone assessment, participants were randomized to basic Internet (N=679), enhanced Internet (N=651), or enhanced Internet plus telephone counseling (N=675). This manuscript focuses on the enhanced Internet arm which included a large online community. The basic Internet arm did not include a community, and the conjoint influence of telephone counseling and community use was beyond the scope of these analyses.
Consistent with other online interventions (Eysenbach, 2005), use of the enhanced Internet intervention occurred largely during the first 3 months of the study (Cobb & Graham, 2014). Therefore, these analyses focus on 3-month metrics of online community use and abstinence among the N=492 participants that logged in to the website at least once. Self-reported smoking status at 3 months was available on 81% of these (N=397), with missing outcomes on the remainder imputed as smoking per study protocol. The study protocol received human subject protections approval from the Georgetown University institutional review board.
Intervention
Participants randomized to enhanced Internet had free access to the premium service of QuitNet, a widely used web-based smoking cessation program (Cobb et al., 2010). The core features of QuitNet have been described elsewhere (Cobb et al., 2005). One of its distinguishing features is the large online community. QuitNet has enrolled thousands of current and former smokers into an online community and has provided multiple mechanisms for the exchange of social support and social influence. Formal social network analyses (Cobb et al., 2010) demonstrated that the QuitNet community is a large-scale social network with the characteristics required for sustainability of social support and social influence to promote smoking cessation and abstinence. QuitNet maintains a complete transactional history of all events, including communications that occur throughout the site.
Assessment Procedures
The baseline assessment for the parent trial consisted of demographic, smoking, psychosocial, and medical history measures. Participants were offered a $25 incentive for completing the 3-month follow-up survey by phone or $15 for completing the survey online.
Measures
“Treatment” Variable
Metrics of community use were extracted from the QuitNet database. Passive use included: number of people a user received Q-Mail from, number of Forum messages read, the number of Club messages read, and number of Testimonials viewed. Active use included: number of people to whom a user sent QMail, number of Forum posts, number of uses of Chat, and number of Testimonials written. Community use patterns were defined as follows: “None” refers to those participants who never visited the community at all; “Passive” refers to those participants with values of 1 or higher on any of the passive community use metrics and values of 0 on all active community use metrics; “Both” refers to study participants who had values of 1 or higher on any passive and any active community use metrics.
Variables in Propensity Score Model
The following measures were included in the propensity score model based on their demonstrated association with smoking behavior and/or engagement with smoking cessation treatment.
Demographic variables included gender, age, race, ethnicity, education, employment status, and household income were assessed at baseline using standard items (Centers for Disease Control and Prevention, 2002). Participants also indicated how frequently they communicated online via blogs, online bulletins, chat rooms, or instant messaging.
Baseline smoking variables included daily smoking rate, other tobacco use, age of first smoking experience, age at onset of daily smoking, the number of quit attempts in the past year, desire to quit (1=not at all, 10=very much), confidence in quitting (1=not at all, 10=very), motivation to quit (Prochaska, DiClemente, & Norcross, 1992), and number of smokers in the house. The Fagerström Test for Nicotine Dependence (Heatherton, Kozlowski, Frecker, & Fagerström, 1991) and the short forms of Smoking Situations Confidence and the Smoking Temptations Inventories (Velicer, Diclemente, Rossi, & Prochaska, 1990) were administered. Participants were asked about past-year use (at baseline) and past 3-month use (at follow-up) of nicotine replacement therapy (patch, gum, lozenge, spray, inhaler), prescription cessation medications (Zyban/bupropion), behavioral treatments (pamphlet/book, individual counseling, group counseling, telephone counseling), alternative quit methods (e.g., acupuncture, hypnosis), and “other” methods (recoded into pharmacological, behavioral, or alternative treatments).
Psychosocial variables included the Cohen Stress Scale (Cohen, Kamarck, & Mermelstein, 1983), the Center for Epidemiologic Studies–Depression Scale (Andresen, Malmgren, Carter, & Patrick, 1994), a modified version of the Partner Interaction Questionnaire (Cohen & Lichtenstein, 1990; Graham, Papandonatos, et al., 2006), and the Weight Concern Scale (Borrelli & Mermelstein, 1998).
Medical history items included a history of tobacco-related medical conditions (e.g., high blood pressure, cancer, heart disease, bronchitis). Body mass index was calculated from height and weight. Participants were asked if they drank alcohol (yes/no) and an item from the Drug Abuse Screening Test (Skinner, 1982) assessed drug use (yes/no).
Outcome Measure
The primary outcome was self-reported 30-day point prevalence abstinence at 3 months post randomization. Self-reported smoking status is an accepted outcome measure in Internet cessation trials.
Post-treatment covariates
Automated tracking data were extracted from the QuitNet database at 3 months. Website intensity metrics included number of logins, time spent on the site (minutes), and number of pages viewed. Use of static content elements included: 1) a Quitting Guide that provides evidence-based information about smoking cessation; 2) a Medication Guide with information about US FDA-approved medication and other products; 3) a large, searchable database of Frequently Asked Questions (FAQs); and 4) a list of cessation resources in the US, searchable by zip code. Interactive features included the following: 1) a Quit Date Wizard that assists smokers in choosing a quit date, which can be set/updated in the system; 2) a Medication Wizard that provides individually tailored medication recommendations; 3) a Medication Plan that enables users to set/update their chosen quitting medication; 4) expert tools including an assessment of nicotine dependence (Fagerström & Schneider, 1989), a “Why Do You Smoke” questionnaire, and an assessment of readiness to change (Prochaska, DiClemente, & Norcross, 1992); 5) a dynamic quitting calendar with cessation strategies tailored by quit date; 6) a personalized Journal for self-monitoring progress; 7) testimonials for users to share their personal experiences with quitting, searchable by username and date of entry; and 8) expert counseling available through private messages or public forums.
Statistical Analyses
Frequency tables summarized the proportion of participants that used the online community both passively and actively, only passively, or not at all. Next, we examined differences in baseline demographic, smoking, psychosocial, and medical history characteristics by level of community use. One-way ANOVA was used to test for differences in continuous variables exhibiting low-to-moderate skewness. Rank-based Kruskal-Wallis ANOVA was used for highly skewed variables. Chi Square tests were used to test for differences in categorical variables, one factor level at a time.
Propensity Score
Modeling Since these analyses focus on participants in the enhanced Internet arm that logged into QuitNet and used the community, differences in crude abstinence rates by community use do not have a causal interpretation, as they fail to account for self-selection (Stuart, Marcus, Horvitz-Lennon, Gibbons, & Normand, 2009). Inverse Probability of Treatment Weighting (IPTW) corrects raw abstinence rates for participants’ differential propensity to participate in the community, essentially recreating a randomized experiment. More than one weighing scheme is possible, each leading to different causal estimates (McCaffrey et al., 2013).
One reweighing approach focuses on estimating Average Treatment Effects (ATEs) for all subjects, regardless of their actual treatment condition (Imbens, 2004). For example, the ATE of passive versus no participation is the difference in abstinence rates of the entire sample had it engaged online solely in a passive fashion vs. not at all. Estimating this treatment effect requires weighting the members of the Passive and None groups, so that their covariate distributions resemble that of the whole sample and, hence, each group has similar propensity to participate in the community at any given engagement level. The abstinence rates in these two weighted samples then serve as estimates for the difference in abstinence rates that would have been observed in the entire sample, had it engaged passively as opposed to not at all. We estimated these weights non-parametrically using Generalized Boosted Models (GBM) as implemented in the GBM package (Ridgeway, 2014), thus gaining robustness to possible propensity model misspecification. Although multinomial modeling capabilities for analyzing multivalued treatments have recently been added to this package, modeling each treatment level separately leads to improved covariate balance (McCaffrey et al., 2013). Thus, we fit separate GBMs for participating in the online community at each observed engagement level.
A second reweighing approach is based on estimating Average Treatment effects on the Treated (ATTs) separately for each treatment group (Imbens, 2004). For example, the ATT of passive versus no participation in the Passive group is the difference between (i) the actual abstinence rate of the Passive group, and (ii) the abstinence rate of this same group, had none of its members participated in the online community at all. Estimating this effect requires weighting the None group, so that its covariate distribution resembles that of the Passive group; the abstinence rate in the weighted None group then serves as an estimate for the abstinence rate of the Passive group under the None treatment condition. Although this rebalancing could be accomplished using ratios of previously-obtained ATE weights, when multivalued treatments are involved, it is recommended that separate GBMs be fit de novo to each pair of groups involved in the comparison of interest, ignoring remaining groups (McCaffrey et al., 2013). Individuals in the comparison group with covariate values common in their group alone are down-weighted, whereas those with covariate values common in the targeted group are up-weighted.
For both ATE and ATT analyses, individual GBM fits were weighted combinations of up to 10,000 trees of depth two, capturing both main effects and 2-way interactions in model covariates (McCaffrey, Ridgeway, & Morral, 2004). A shrinkage parameter of 0.01 was used for smoothing, and minimization of the mean of the Kolmogorov-Smirnov test statistic was used for selecting the number of trees providing the best covariate balance across groups.
Weighting and Balance Checking
Propensity scores were visually inspected to assess covariate overlap and the need for weight trimming (Lee, Lessler, & Stuart, 2011), aided by the balance assessment diagnostics of the TWANG package (Ridgeway, McCaffrey, Morral, Ann, & Burgette, 2014). Improvements in covariate balance were assessed based on change in absolute standardized bias measures (Harder, Stuart, & Anthony, 2010). For continuous covariates, these were between-group mean differences before and after weighting, divided by the unweighted standard deviation of the full sample (ATE) or the target engagement group (ATT). For categorical variables, separate standardized bias measures were calculated for each covariate level, based on between-group differences in proportions. In addition, differences in spread were assessed by looking at the between-group ratio of variances before and after weighting. Formal significance testing was avoided in assessing covariate balance (Ho, Imai, King, & Stuart, 2007). Rather, absolute bias measures smaller than 0.25 standard units and variance ratios in the interval [4/5, 5/4] were deemed indicative of successful balancing.
Unlike true randomized studies, propensity score adjustment cannot achieve balance over unmeasured confounders that are uncorrelated with variables included in the model specification. However, it can balance secondary exposures correlated with the exposure of interest, as well as time-varying covariates showing stable associations with exposure over time, when their baseline values are included in the model. Two such sets of measures whose balance we sought to assess after weighting were website utilization metrics and quit methods used in the past three months.
Both ATE and ATT weights include in their denominator estimates of the probability that participants would have selected the level of community use characteristic of their group. Individuals with very low propensity to use the community at the observed level can unduly influence the analyses: their weights tend to be very large, as they are calculated by taking the reciprocal of their propensity score. Hence, both sets of weights were visually inspected in case they required trimming (Lee et al., 2011).
Outcome Modeling
Once a propensity model was deemed adequate, weights were fed from the GBM package into the SURVEY package (Lumley, 2014) and used to calculate point and interval estimates of differences in weighted abstinence rates by engagement. Potential confounders that remained imbalanced after weighting were controlled for via regression adjustment.
Results
Patterns of Community Participation
Among study participants (n=492), 198 (40.2%) never visited the community, 110 (22.4%) engaged passively, and 184 (37.4%) engaged both passively and actively. Self-selection into these three levels of online community use defines groups of interest in this study: “None”, “Passive”, and “Both”. Of note, 23 participants who used the community only actively (no passive use at all) were added to the Both group given their potentially informative data.
Propensity Score Modeling
Table 1 shows between-group differences in baseline variables used as potential predictors of online community use at 3 months in our propensity model. Statistical significance was only attained for negative partner interactions, history of depression, and other tobacco use. Participants reporting fewer negative partner interactions related to cessation at baseline were more likely to use the community both passively and actively. History of depression was least prevalent among Passive (19.1%) and more prevalent among Both (32.6%) compared to None (27.8%). Other tobacco use was most common among None, most likely attributable to the higher proportion of men in this group. Although the remaining baseline variables did not show statistically significant between-group differences, they were all included in the GBM model, following standard recommendations to be over-inclusive (Austin, 2011).
Table 1.
Baseline characteristics by type of community use at 3 months.
| Baseline characteristics | Full sample (N=492) | None (N=198) | Passive (N=110) | Both (N=184) | P-value* |
|---|---|---|---|---|---|
| Demographic Variables | |||||
| Women; N (%) | 250 (50.8) | 88 (44.4) | 56 (50.9) | 106 (57.6) | .347 |
| Age (years); mean (SD) | 36.9 (11.1) | 36.4 (11.5) | 36.1 (9.7) | 37. 8 (11.4) | .340 |
| Race, White; N (%) | 433 (88.0) | 169 (85.4) | 99 (90.0) | 165 (89.7) | .330 |
| Ethnicity, Hispanic; N (%) | 19 (3.9) | 7 (3.5) | 4 (3.6) | 8 (4.4) | .910 |
| Body Mass Index; mean (SD) | 27.0 (5.9) | 27.0 (6.0) | 26.9 (6.0) | 27.0 (5.9) | .992 |
| No. people in household; mean (SD) | 2.8 (1.4) | 2.8 (1.5) | 2.9 (1.4) | 2.8 (1.3) | .720 |
| Marital status, married/cohabitating; N (%) | 291 (59.4) | 111 (56.1) | 69 (62.7) | 111 (61.0) | .447 |
| Education, some college or more; N (%) | 375 (76.2) | 146 (73.7) | 81 (73.6) | 148 (80.4) | .237 |
| Employment, Full time; N (%) | 366 (74.4) | 143 (72.2) | 81 (73.6) | 142 (77.2) | .530 |
| Household income, less than $50,000; N (%) | 276 (56.7) | 112 (57.1) | 61 (55.5) | 103 (56.9) | .957 |
| Online communication, at least daily; N (%) | 243 (49.4) | 97 (49) | 57 (51.8) | 89 (48.4) | .840 |
| Smoking Variables | |||||
| Cigarettes per day; mean (SD) | 20.8 (9.7) | 20.5 (9.3) | 20.8 (8.1) | 21.2 (10.9) | .792 |
| Other types of tobacco use; N (%) | 42 (8.7) | 25 (12.9) | 9 (8.3) | 8 (4.4) | .015 |
| First puff age (years); mean (SD) | 14.2 (3.8) | 14.2 (3.9) | 14.3 (3.1) | 14.0 (4.0) | .828 |
| Daily smoking age (years); mean (SD) | 17.2 (4.0) | 17.3 (4.6) | 17.1 (3.1) | 17.0 (3.9) | .759 |
| No. quit attempts past year; mean (SD) | 3.2 (7.2) | 2.9 (3.9) | 2. 6 (5.2) | 3.7 (10.3) | .256 |
| Desire to quit; mean (SD) | 9.0 (1.3) | 9.2 (1.2) | 8.9 (1.3) | 9.0 (1.4) | .214 |
| Confidence in quitting; mean (SD) | 6.3 (2.3) | 6.3 (2.2) | 6.5 (2.3) | 6.2 (2.3) | .550 |
| Motivation to quit (next 30 days); N (%) | 438 (89.0) | 173 (87.4) | 94 (85.5) | 171 (92.9) | .088 |
| Smokers in house, yes; N (%) | 95 (19.3) | 44 (22.2) | 18 (16.4) | 33 (17.9) | .384 |
| Fagerström Test for Nicotine Dependence; mean (SD) | 5.2 (2.3) | 5.1 (2.3) | 5.2 (2.2) | 5.3 (2.4) | .797 |
| Smoking Situations Confidence Inventory; mean (SD) | 2.8 (0.6) | 2.8 (0.6) | 2.9 (0.6) | 2.8 (0.6) | .152 |
| Smoking Temptations Inventory; mean (SD) | 3.9 (0.5) | 3.9 (0.5) | 3.9 (0.4) | 3.9 (0.5) | .938 |
| No. quit methods past year; M (SD) | 2.3 (1.9) | 2.1 (1.8) | 2.2 (1.8) | 2.5 (2.1) | .072 |
| Psychosocial Variables | |||||
| Cohen Stress Scale; mean (SD) | 6.2 (3.2) | 6.1 (3.2) | 6.3 (3.3) | 6.3 (3.2) | .691 |
| CES-D; mean (SD) | 0.9 (0.6) | 0.9 (0.6) | 0.9 (0.6) | 0.9 (0.6) | .625 |
| PIQ-positive subscale; mean (SD) | 9.9 (2.3) | 10.2 (2.2) | 9.9 (2.2) | 9.6 (2.4) | .080 |
| PIQ-negative subscale; mean (SD) | 6.1 (4.3) | 6.6 (4.2) | 6.7 (4.2) | 5.3 (4.2) | .003 |
| Weight Concern Scale; mean (SD) | 4.7 (2.3) | 4.8 (2.2) | 4.7 (2.3) | 4.7 (2.4) | .893 |
| Medical History | |||||
| History of depression; N (%) | 136 (27.6) | 55 (27.8) | 21 (19.1) | 60 (32.6) | .043 |
| History of respiratory disease; N (%) | 85 (17.3) | 29 (14.6) | 19 (17.3) | 37 (20.1) | .370 |
| History of high blood pressure; N (%) | 84 (17.1) | 37 (18.7) | 14 (12.7) | 33 (17.9) | .381 |
| Alcohol use, yes; N (%) | 350 (71.3) | 141 (71.6) | 76 (69.1) | 133 (72.3) | .837 |
| Drug use, yes; N (%) | 84 (17.1) | 33 (16.7) | 18 (16.4) | 33 (17.9) | .924 |
P-values calculated using Kruskal-Wallis test for # people in household, # quit attempts, # quit methods used. CES-D: Center for Epidemiologic Studies, Depression Scale; PIQ: Partner Interaction Questionnaire.
Weighting and Balance Checking
Estimated probabilities of observing the actual level of community use in each group were in the .15–.98 range, safely bounded away from zero. Therefore, there was no need to trim ATE weights limited to the range 1.02–6.48 across groups. ATT weights were even less extreme (.02–4.85). As a result, information losses for ATE analyses due to weight variability did not exceed 10% for any of the three community groups. For ATT analyses, reductions in the effective sample size were in the 30%–40% range for the two pairwise comparisons involving the None and Both groups, but remained below 18% for comparisons involving the Passive group.
Balance diagnostics for variables in Table 1 showed that all absolute bias measures fell below 0.25 standard units after weighting (see Figures 2–4 in Online Supplementary Materials), although variance ratios fell outside the desired [4/5, 5/4] range for baseline quit attempts.
Table 2 shows that both quit methods and website utilization at 3 months showed a strong positive association with community use prior to propensity weighting: utilization of the static and interactive elements of the site was significantly higher among participants in Both than Passive, and higher among Passive than None. After weighting, imbalances remained only among website utilization metrics. These variables were entered as additional covariates in survey-weighted logistic regression models of 3-month abstinence that already controlled for online community use. They were not significant, and were dropped from further analyses. < insert Table 2 about here >
Table 2.
Post-treatment covariates reported at 3 months by type of community use.
|
|
Full sample
|
None
|
Passive
|
Both
|
P-value*
|
|---|---|---|---|---|---|
| Quit Methods, M (SD) | (N=356) | (N=132) | (N=77) | (N=147) | |
| No. quit methods used | 1.3 (1.3) | 1.4 (1.6) | 1.3 (1.2) | 1.3 (1.2) | .672 |
| Pharmacotherapy | 0.8 (0.8) | 0.7 (0.9) | 0.8 (0.8) | 0.8 (0.8) | .379 |
| Behavioral | 0.5 (0.8) | 0.5 (0.8) | 0.4 (0.7) | 0.5 (0.7) | .573 |
| Alternative | 0.1 (0.3) | 0.1 (0.4) | 0.1 (0.3) | 0.03 (0.2) | .136 |
|
| |||||
| Website Utilization, M (SD) | (N=492) | (N=198) | (N=110) | (N=184) | |
|
| |||||
| General Intensity Metrics | |||||
| Number of logins | 14.1 (32.1) | 2.4 (2.5) | 7.5 (7.9) | 30.7 (47.8) | <.001 |
| Time on site (minutes) | 227.5 (775.3) | 21.5 (26.8) | 72.1 (102.2) | 543.8 (1204.2) | <.001 |
| Page views | 256.3 (692.7) | 34.0 (31.4) | 111.5 (88.7) | 589.2 (1058.6) | <.001 |
| Static content (no. times read) | |||||
| Quitting Guide | 2.7 (4.7) | 0.5 (1.3) | 2.6 (3.7) | 5.1 (6.2) | <.001 |
| Medication Guide | 0.4 (1.1) | 0.2 (0.6) | 0.5 (1.2) | 0.6 (1.3) | <.001 |
| FAQs | 3.7 (10.8) | 0.3 (1.8) | 2.5 (5.3) | 8.1 (16.2) | <.001 |
| National Program Directory | 0.4 (1.0) | 0.1 (0.4) | 0.4 (0.9) | 0.7 (1.3) | <.001 |
| Interactive features (no. times used) | |||||
| Quit Date Wizard | 1.9 (3.0) | 0.6 (0.9) | 1.8 (1.5) | 3.5 (4.1) | <.001 |
| Set quit date | 0.8 (1.7) | 0.2 (0.5) | 0.7 (1.0) | 1.5 (2.4) | <.001 |
| Medication Wizard | 0.2 (0.5) | 0.1 (0.4) | 0.2 (0.5) | 0.3 (0.6) | .006 |
| Set/updated Medication Plan | 1.6 (2.5) | 0.5 (0.9) | 1.5 (1.4) | 2.8 (3.4) | <.001 |
| Expert tools | 0.7 (1.2) | 0.2 (0.7) | 0.9 (1.2) | 1.2 (1.4) | <.001 |
| Dynamic calendar | 1.0 (2.9) | 0.2 (0.6) | 1.0 (2.2) | 2.0 (4.3) | <.001 |
| Journal | 1.1 (5.2) | 0.1 (0.5) | 0.3 (0.8) | 2.8 (8.2) | <.001 |
| 1:1 counseling | 0.03 (0.2) | 0.0 (0.0) | 0.03 (0.2) | 0.1 (0.3) | .008 |
P-values calculated using Kruskal-Wallis test due to skewness.
Outcome Modeling
Unweighted Analyses
At 3 months, overall 30-day point prevalence abstinence in the analytic sample was 12.2% (95% CI= 9.3–15.1). As seen in Table 3, abstinence rates rose monotonically with increased levels of community use, from 5.1% among None to 15.5% among Passive to 17.9% among Both. Three month abstinence was less likely among None compared to Passive (p<.01) and Both (p<.01); no statistically significant differences in abstinence emerged between Passive and Both (p=.62).
Table 3.
Abstinence rates by community use level and pairwise ATEs and ATTs before and after propensity score weighting.
| None
|
Passive
|
Both
|
Difference*
|
||
|---|---|---|---|---|---|
| Rate (95% CI) | Rate (95% CI) | Rate (95% CI) | ΔRate (95% CI) | p-value | |
|
|
|
|
|
|
|
| Unweighted Analyses | .051 (.020, .081) | .155 (.087, .222) | .179 (.124, .235) | ||
| Passive vs. None | -- | -- | -- | .104 (.030, .178) | .006 |
| Both vs. None | -- | -- | -- | .129 (.066, .192) | <.001 |
| Both vs. Passive | -- | -- | -- | .025 (−.063, .112) | .578 |
|
|
|
|
|
|
|
| ATE Weighted Analyses | .042 (.015, .069) | .151 (.084, .219) | .204 (.139, .268) | ||
| Passive vs. None | -- | -- | -- | .109 (.036, .182) | .003 |
| Both vs. None | -- | -- | -- | .161 (.091, .232) | <.001 |
| Both vs. Passive | -- | -- | -- | .052 (−.042, .146) | .276 |
|
|
|
|
|
|
|
| ATT weighted to match “None” | .051 (.020, .081) | .147 (.077, .217) | .204 (.130, .279) | ||
| Passive vs. None | -- | -- | -- | .097 (.021, .173) | .013 |
| Both vs. None | -- | -- | -- | .154 (.073, .234) | <.001 |
|
|
|
|
|
|
|
| ATT weighted to match “Passive” | .031 (.007, .055) | .155 (.087, .222) | .221 (.151, .291) | ||
| None vs. Passive | -- | -- | -- | −.123 (−.195, −.051) | .001 |
| Both vs. Passive | -- | -- | -- | .066 (−.031, .164) | .182 |
|
|
|
|
|
|
|
| ATT weighted to match “Both” | .053 (.017, .089) | .164 (.090, .238) | .179 (.124, .235) | ||
| None vs. Both | -- | -- | -- | −.126 (−.192, −.060) | <.001 |
| Passive vs. Both | -- | -- | -- | −.015 (−.108, .077) | .749 |
|
|
|
|
|
|
|
Differences are calculated as 1st group - 2nd group, where pairs are expressed as “1st group vs. 2nd group”.
Note: ATE weighted estimates represent estimated abstinence rates if the whole population received the corresponding treatments. ATT weighted estimates represent estimated abstinence rates if the matched population received the corresponding treatments.
ATE-Weighted Analyses
ATE-weighted abstinence rates differ from observed abstinence rates due to a reweighing scheme that brings group-specific covariate distributions closer to those of the overall sample, raising the likelihood of community use in the None group and diminishing it in the Both group. Table 3 shows that under this scheme abstinence rates fall to 4.2% (95% CI=1.5–6.9) in the None group; remain almost stable at 15.1% (95% CI=8.4–21.9) in the Passive group; and rise to 20.4% (95% CI=13.9–26.8) in the Both group. These results translate into statistically significant improvements in abstinence rates of 10.9% (95% CI=3.6–18.2, p=.003) due to passive community use and 16.1% (95% CI=9.1–23.2, p<.001) due to combined passive/active use compared to no use. No statistically significant differences in abstinence emerged between Passive and Both groups (p=.28).
ATE findings are bidirectional and apply to the entire sample. For example, the expected 5.2% decrease in abstinence rates had the entire sample participated in the community passively instead of both passively and actively is equal in magnitude and opposite in sign to the 5.2% increase in abstinence rates if the entire sample participated both passively and actively instead of passively alone. Thus, only 3 out of 6 possible pairwise comparisons are shown in Table 3.
ATT-Weighted Analyses
ATT-weighted abstinence rates are also shown in Table 3, and differ from observed rates due to a reweighing scheme that brings the covariate distributions of community use groups closer to that of a target community use group, rather than the sample as a whole. They supplement ATE findings and permit unidirectional predictions for all 6 possible pairwise comparisons.
Had participants in the None group used the community passively, their abstinence rates would have increased from 5.1% to 14.7% (95% CI=7.7–21.7), representing a statistically significant 9.7% improvement (95% CI=2.1–17.3, p= .013); had they participated both passively and actively, abstinence rates would have risen further to 20.4% (95% CI=13.0–27.9), representing a statistically significant 15.4% improvement (95% CI=7.3–23.4, p<.001) over the 5.1% rate actually observed.
Had participants in the Passive group not used the community at all, their abstinence rates would have dropped from 15.5% to 3.1% (95% CI=.7–5.5), a statistically significant 12.3% decline (95% CI=5.1–19.5, p<.01); had they also participated actively, their abstinence rates would have increased to 22.1% instead (95% CI= 15.1–29.1), representing a non-significant 6.6% increase in abstinence rates (95% CI=3.1–16.4, p=.18).
Had participants in the Both group only used the community passively, their abstinence rates would have dropped from 17.9% to 16.4% (95% CI=9.0–23.8), a decrease of just 1.5% (95% CI=7.7–10.8, p=.75). In contrast, had they not made any use of the community, their abstinence rates would have fallen to 5.3% (95% CI=1.7–8.9), representing a significant 12.6% reduction (6.0–19.2, p<.001).
An overview of the results of all analyses described above is presented in Figure 1.
Figure 1.
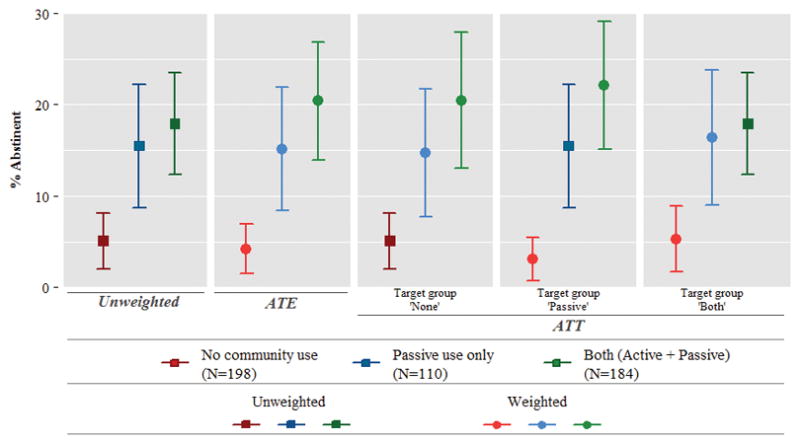
Unweighted and weighted 30 day point prevalence abstinence rates at 3 months (intent to treat analysis).
Discussion
To our knowledge, this study is the first to estimate the causal impact of participation in an online community for smoking cessation, using methods to account for selection bias. Unweighted data analyses suggested that passive community use alone as well as combined passive/active use increased abstinence rates at least three-fold over no use. ATE weighted analyses applied to the entire analytic sample strengthened this conclusion, yielding overall abstinence rates of 20% for combined passive and active use, 15% for passive use alone, and 4% for no community use. ATT weighted analyses applied separately by group demonstrated the clear benefit of passive use in promoting abstinence, with a dramatic reduction in abstinence rates of passive users under non-use, and a dramatic increase in abstinence rates of non-users under passive use. In contrast, active participation demonstrated little additional improvement in abstinence rates of passive users under combined passive/active use, and only a small reduction in abstinence rates of combined passive/active users under passive use. These findings suggest that use of the online community may be causally linked to higher abstinence rates.
Few baseline characteristics distinguished the groups. Those that participated both passively and actively reported lower levels of smoking-related negative support (i.e., criticism, nagging) and were more likely to report a past history of depression. These individuals may have greater experience or comfort reaching out to others for social support and, therefore, are more likely to engage actively in an online community. The higher proportions of married White women with some college education among community users are consistent with trends in social media use (Duggan, 2014) and demographic characteristics noted in other Internet cessation studies (e.g., Rabius, Pike, Wiatrek, & McAlister, 2008). It is noteworthy that use of all static and interactive elements of the website was higher among passive users than those that did not use the community, and highest among combined passive plus active users.
In this study, the combination of active and passive use was more common than passive use alone. Most online communities are characterized by a majority of “lurkers” that engage passively, reading the content generated by other members but not contributing any of their own, a small percentage of “contributors” that participate sporadically, and a minority of “creators” that actively participate by generating new content (Nielsen, 2006; The Community Roundtable, 2013). The greater prevalence of combined active and passive use may be a function of our conceptualization of engagement from an individual perspective rather than a community perspective. Our interest was in determining whether communications with others members – whether public or private – influenced abstinence rates. Given that the exchange of private messages may be important mechanisms of social support and social influence known to impact behavior change, we included the sending of private messages in our definition of active community use whereas other studies have considered this metric separately (An et al., 2008).
Our findings suggest that it is important to find strategies that make user-generated content from an online community easily accessible and “lurkable”. The online community component of smoking cessation interventions is often constructed as a separate part of the intervention, sometimes even requiring a separate login process. Given the clear benefit of reading content from other community members, it is important to devise strategies to integrate community content into web-based cessation interventions. Proactive outreach from existing community members to newcomers may also increase passive utilization of an online community (Graham et al., 2013). Increasing the proportion of passive users may also generate important externalities from a broader tobacco control standpoint: lurkers may serve a “bridging” role by sharing information they acquire in an online community with other smokers or by bringing others to the community. At the same time, it is critical to promote active participation, both from an individual-level behavior change standpoint and also to ensure the health of the community. A community comprised only of lurkers will wither on the vine (Millington, 2012). Our findings do show an incremental benefit – albeit small – of active engagement in the community over and above passive engagement. Our propensity models suggest that approximately 85% of non-users might be enticed to participate passively and 91% of passive users might be engaged actively based on shared baseline characteristics. However, in actual practice, converting lurkers into creators is a noted challenge (Millington, 2012). A more efficient strategy may be to actively encourage continued participation among those who make an initial contribution and nurture their connection to others in the community. Building stable group of active users may not only attract new users who will benefit with regards to abstinence, but is also important to ensure the longevity of an online community.
There are several limitations to our study, each of which point to further research needed in this nascent area of study. First, these analyses focus on short-term abstinence using 3-month follow-up data from the parent trial. Future research should address the longer-term effects of participation in an online community including the potential for reduced relapse associated with long-term engagement. Second, results may not be generalizable to other online communities for smoking cessation, which may function differently given technology platform differences, communication preferences among members, community norms, and the maturity of the community. QuitNet’s stable core of long-term members, heterogeneous mix of current and former smokers, and well-established pattern of bidirectional communications among community members (Cobb et al., 2010) created a distinct experience for active and passive users alike. In addition, given that our data were drawn from a randomized trial, our findings may not be generalizable to the broader pool of users of cessation websites. Utilization patterns may differ between trial participants and users of publically available websites (Wanner, Martin-Diener, Bauer, Braun-Fahrlander, & Martin, 2010).
Our findings are contingent on available data from the parent trial. Although available metrics were comprehensive, there may be unmeasured variables that we could not account for in propensity weights. There is debate in the propensity score literature about the extent to which causal inferences can be made (Rosenbaum, 2002). Given that one can never be certain that all possible confounders of the treatment-outcome relationship have been included, our study resembles many randomized trials which represent “broken experiments” due to partial compliance with assigned treatment and study dropout. Such trials necessitate the use of propensity weighting, instrumental variable, or multiple imputation techniques to recover a “causal” treatment effect free of selection bias. Given that both the exact non-compliance and dropout mechanisms are in practice unknown, and may well be non-ignorable, it is important to note that randomized trials often suffer the same limitations as our observational study. Fourth, our results do not rule out the reverse temporal ordering: it is possible that abstinence preceded community engagement and that higher levels of engagement occurred as individuals participated in the community to celebrate abstinence, enjoy positive feedback, encourage others, etc. The plausibility of these scenarios is an empirical question to be examined in future research. A final limitation is that analyses do not address potential self-selection bias associated with follow-up attrition, and are conditional on participants logging into the website at least once.
Online social networks are becoming increasingly common in health behavior change interventions (Maher et al., 2014). Evaluating the impact of participation in social structures on behavior change outcomes requires careful consideration of the most appropriate research design at the outset of a trial, as well as the most appropriate analytic framework to address potential sources of bias like self-selection. Our analyses demonstrate one approach to this challenge. Our findings suggest causal links between online community use and short-term abstinence, and that engaging smokers in an online community – even passively – may significantly improve the effectiveness of web-based smoking cessation interventions.
Supplementary Material
Acknowledgments
This research was supported by the National Cancer Institute (#R01CA104836).
Footnotes
Author Disclosure: Amanda Graham is an employee of The American Legacy Foundation, a non-profit public health foundation that runs BecomeAnEX.org, a web-based smoking cessation program with a large online community. Cassandra Stanton is a consultant to Legacy.
Contributor Information
Amanda L. Graham, American Legacy Foundation
George D. Papandonatos, Brown University
Bahar Erar, Brown University.
Cassandra A. Stanton, Westat, Inc
References
- Alere Wellbeing Inc. American Cancer Society Quit For Life Program. 2014 Archived at http://www.webcitation.org/6VmBNqJAr.
- An LC, Schillo BA, Saul JE, Wendling AH, Klatt CM, Berg CJ, Luxenberg MG. Utilization of smoking cessation informational, interactive, and online community resources as predictors of abstinence: cohort study. J Med Internet Res. 2008;10(5):e55. doi: 10.2196/jmir.1018. [DOI] [PMC free article] [PubMed] [Google Scholar]
- Andresen EM, Malmgren JA, Carter WB, Patrick DL. Screening for depression in well older adults: evaluation of a short form of the CES-D (Center for Epidemiologic Studies Depression Scale) Am J Prev Med. 1994;10(2):77–84. No doi available. [PubMed] [Google Scholar]
- Austin PC. An Introduction to Propensity Score Methods for Reducing the Effects of Confounding in Observational Studies. Multivariate Behav Res. 2011;46(3):399–424. doi: 10.1080/00273171.2011.568786. [DOI] [PMC free article] [PubMed] [Google Scholar]
- Borrelli B, Mermelstein R. The role of weight concern and self-efficacy in smoking cessation and weight gain among smokers in a clinic-based cessation program. Addict Behav. 1998;23(5):609–622. doi: 10.1016/S0306-4603(98)00014-8. [DOI] [PubMed] [Google Scholar]
- Centers for Disease Control and Prevention. 2002 Behavioral Risk Factor Surveillance System - Survey Questions. Atlanta, GA: Centers for Disease Control and Prevention; 2002. [Google Scholar]
- Centola D. Social media and the science of health behavior. Circulation. 2013;127(21):2135–2144. doi: 10.1161/CIRCULATIONAHA.112.101816. [DOI] [PubMed] [Google Scholar]
- Civljak M, Stead LF, Hartmann-Boyce J, Sheikh A, Car J. Internet-based interventions for smoking cessation. Cochrane Database Syst Rev. 2013;7:CD007078. doi: 10.1002/14651858.CD007078.pub4. [DOI] [PubMed] [Google Scholar]
- Cobb CO, Graham AL. Use of “Non-assigned” Interventions in a Randomized Trial of Internet and Telephone Treatment for Smoking Cessation. Nicotine Tob Res. 2014;16(10):1289–97. doi: 10.1093/ntr/ntu066. [DOI] [PMC free article] [PubMed] [Google Scholar]
- Cobb NK, Graham AL. Characterizing Internet searchers of smoking cessation information. J Med Internet Res. 2006;8(3):e17. doi: 10.2196/jmir.8.3.e17. [DOI] [PMC free article] [PubMed] [Google Scholar]
- Cobb NK, Graham AL, Abrams DB. Social network structure of a large online community for smoking cessation. Am J Public Health. 2010;100(7):1282–1289. doi: 10.2105/AJPH.2009.165449. [DOI] [PMC free article] [PubMed] [Google Scholar]
- Cobb NK, Graham AL, Bock BC, Papandonatos G, Abrams DB. Initial evaluation of a real-world Internet smoking cessation system. Nicotine Tob Res. 2005;7(2):207–216. doi: 10.1080/14622200500055319. [DOI] [PMC free article] [PubMed] [Google Scholar]
- Cobb NK, Graham AL, Byron MJ, Niaura RS, Abrams DB. Online social networks and smoking cessation: a scientific research agenda. J Med Internet Res. 2011;13(4):e119. doi: 10.2196/jmir.1911. [DOI] [PMC free article] [PubMed] [Google Scholar]
- Cohen S, Kamarck T, Mermelstein R. A global measure of perceived stress. J Health Soc Behav. 1983;24(4):385–396. doi: 10.2307/2136404. [DOI] [PubMed] [Google Scholar]
- Cohen S, Lichtenstein E. Partner behaviors that support quitting smoking. J Consult Clin Psychol. 1990;58(3):304–309. doi: 10.1037//0022-006x.58.3.304. [DOI] [PubMed] [Google Scholar]
- Duggan M. It’s a woman’s (social media) world. 2014 Archived at http://www.webcitation.org/6VmAl2c7J.
- Eysenbach G. The law of attrition. J Med Internet Res. 2005;7(1):e11. doi: 10.2196/jmir.7.1.e11. [DOI] [PMC free article] [PubMed] [Google Scholar]
- Eysenbach G, Powell J, Englesakis M, Rizo C, Stern A. Health related virtual communities and electronic support groups: systematic review of the effects of online peer to peer interactions. BMJ. 2004;328(7449):1166. doi: 10.1136/bmj.328.7449.1166. [DOI] [PMC free article] [PubMed] [Google Scholar]
- Fagerström KO, Schneider NG. Measuring nicotine dependence: a review of the Fagerström Tolerance Questionnaire. Journal of Behavioral Medicine. 1989;12(2):159–182. doi: 10.1007/bf00846549. [DOI] [PubMed] [Google Scholar]
- Graham AL, Bock BC, Cobb NK, Niaura R, Abrams DB. Characteristics of smokers reached and recruited to an internet smoking cessation trial: a case of denominators. Nicotine Tob Res. 2006;8(Suppl 1):S43–48. doi: 10.1080/14622200601042521. [DOI] [PMC free article] [PubMed] [Google Scholar]
- Graham AL, Cha S, Papandonatos GD, Cobb NK, Mushro A, Fang Y, Abrams DB. Improving adherence to web-based cessation programs: a randomized controlled trial study protocol. Trials. 2013;14(48) doi: 10.1186/1745-6215-14-48. [DOI] [PMC free article] [PubMed] [Google Scholar]
- Graham AL, Cobb NK, Papandonatos GD, Moreno JL, Kang H, Tinkelman DG, Abrams DB. A randomized trial of Internet and telephone treatment for smoking cessation. Arch Intern Med. 2011;171(1):46–53. doi: 10.1001/archinternmed.2010.451. [DOI] [PMC free article] [PubMed] [Google Scholar]
- Graham AL, Papandonatos GD, Bock BC, Cobb NK, Baskin-Sommers A, Niaura R, Abrams DB. Internet- vs. telephone-administered questionnaires in a randomized trial of smoking cessation. Nicotine Tob Res. 2006;8(Suppl 1):S49–57. doi: 10.1080/14622200601045367. [DOI] [PMC free article] [PubMed] [Google Scholar]
- Harder VS, Stuart EA, Anthony JC. Propensity score techniques and the assessment of measured covariate balance to test causal associations in psychological research. Psychol Methods. 2010;15(3):234–249. doi: 10.1037/a0019623. [DOI] [PMC free article] [PubMed] [Google Scholar]
- Heatherton TF, Kozlowski LT, Frecker RC, Fagerström KO. The Fagerström Test for Nicotine Dependence: a revision of the Fagerström Tolerance Questionnaire. Br J Addict. 1991;86(9):1119–1127. doi: 10.1111/j.1360-0443.1991.tb01879.x. [DOI] [PubMed] [Google Scholar]
- Ho DE, Imai K, King G, Stuart EA. Matching as nonparametric preprocessing for reducing model dependence in parametric causal inference. Political Analysis. 2007;15:199–236. doi: 10.1093/pan/mpl013. [DOI] [Google Scholar]
- Imai K, Keele L, Tingley D, Yamamoto T. Unpacking the black box of causality: Learning about causal mechanisms from experimental and observational studies. American Political Science Review. 2011;105(04):765–789. doi: 10.1017/S000305541100041. [DOI] [Google Scholar]
- Imbens GW. Nonparametric estimation of average treatment effects under exogeneity: A review. Review of Economics & Statistics. 2004;86:4–29. doi: 10.1162/003465304323023651. [DOI] [Google Scholar]
- Lee BK, Lessler J, Stuart EA. Weight trimming and propensity score weighting. PLoS One. 2011;6(3):e18174. doi: 10.1371/journal.pone.0018174. [DOI] [PMC free article] [PubMed] [Google Scholar]
- Lumley T. Analysis of complex survey samples: Survey 3.30 package manual. 2014;2014(22 Dec) http://cran.r-project.org/web/packages/survey/survey.pdf. [Google Scholar]
- Maher CA, Lewis LK, Ferrar K, Marshall S, De Bourdeaudhuij I, Vandelanotte C. Are health behavior change interventions that use online social networks effective? A systematic review. J Med Internet Res. 2014;16(2):e40. doi: 10.2196/jmir.2952. [DOI] [PMC free article] [PubMed] [Google Scholar]
- McCaffrey DF, Griffin BA, Almirall D, Slaughter ME, Ramchand R, Burgette LF. A tutorial on propensity score estimation for multiple treatments using generalized boosted models. Stat Med. 2013;32(19):3388–3414. doi: 10.1002/sim.5753. [DOI] [PMC free article] [PubMed] [Google Scholar]
- McCaffrey DF, Ridgeway G, Morral AR. Propensity score estimation with boosted regression for evaluating causal effects in observational studies. Psychol Methods. 2004;9(4):403–425. doi: 10.1037/1082-989X.9.4.403. [DOI] [PubMed] [Google Scholar]
- McCausland KL, Curry LE, Mushro A, Carothers S, Xiao H, Vallone DM. Promoting a Web-Based Smoking Cessation Intervention: Implications for Practice. Cases in Public Health Communication & Marketing, 5 Proc. 2011:3–26. doi: 10.2196/jmir.2277. [DOI] [Google Scholar]
- Millington R. Buzzing Communities: How to Build Bigger, Better, and More Active Online Communities. Lexington, KY: FeverBee; 2012. [Google Scholar]
- National Jewish Health. QuitLogix® Frequently Asked Questions. 2015 Archived at http://www.webcitation.org/6YGMc1Nu6.
- Nielsen J. The 90-9-1 Rule for Participation Inequality in Social Media and Online Communities. 2006 Archived at http://www.webcitation.org/6VmCdF1C3.
- North American Quitline Consortium. Web-Based Services in the US and Canada. 2014 Archived at http://www.webcitation.org/6VmCxFNsj.
- Preece J, Nonnecke B, Andrews D. The top five reasons for lurking: improving community experience for everyone. Comput Human Behav. 2004;20(2):201–223. doi: 10.1016/j.chb.2003.10.015. [DOI] [Google Scholar]
- Prochaska JO, DiClemente CC, Norcross JC. In search of how people change. Applications to addictive behaviors. Am Psychol. 1992;47(9):1102–1114. doi: 10.1037//0003-066x.47.9.1102. [DOI] [PubMed] [Google Scholar]
- Rabius V, Pike KJ, Wiatrek D, McAlister AL. Comparing internet assistance for smoking cessation: 13-month follow-up of a six-arm randomized controlled trial. J Med Internet Res. 2008;10(5):e45. doi: 10.2196/jmir.1008. [DOI] [PMC free article] [PubMed] [Google Scholar]
- Richardson A, Graham AL, Cobb N, Xiao H, Mushro A, Abrams D, Vallone D. Engagement promotes abstinence in a web-based cessation intervention: cohort study. J Med Internet Res. 2013;15(1):e14. doi: 10.2196/jmir.2277. [DOI] [PMC free article] [PubMed] [Google Scholar]
- Ridgeway G. Generalized Boosted Regression Models: GBM 2.1 package manual. 2014 Archived at http://www.webcitation.org/6VmDRxKeU.
- Ridgeway G, McCaffrey DF, Morral A, Ann B, Burgette L. Toolkit for Weighting and Analysis of Nonequivalent Groups: TWANG 1.4 package manual. 2014. [Google Scholar]
- Rosenbaum PR. Observational studies. New York, NY: Springer; 2002. [Google Scholar]
- Skinner HA. The drug abuse screening test. Addict Behav. 1982;7(4):363–371. doi: 10.1016/0306-4603(82)90005-3. [DOI] [PubMed] [Google Scholar]
- Stuart EA, Marcus SM, Horvitz-Lennon MV, Gibbons RD, Normand SL. Using Non-experimental Data to Estimate Treatment Effects. Psychiatr Ann. 2009;39(7):41451. doi: 10.3928/00485713-20090625-07. [DOI] [PMC free article] [PubMed] [Google Scholar]
- The Community Roundtable. The 2013 State of Community Management: The Value of Community Management. 2013 http://www.slideshare.net/rhappe/2013-socm-vocmfinal.
- van Mierlo T, Voci S, Lee S, Fournier R, Selby P. Superusers in social networks for smoking cessation: analysis of demographic characteristics and posting behavior from the Canadian Cancer Society’s smokers’ helpline online and StopSmokingCenter.net. J Med Internet Res. 2012;14(3):e66. doi: 10.2196/jmir.1854. [DOI] [PMC free article] [PubMed] [Google Scholar]
- Velicer WF, Diclemente CC, Rossi JS, Prochaska JO. Relapse situations and self-efficacy: an integrative model. Addict Behav. 1990;15(3):271–283. doi: 10.1016/0306-4603(90)90070-e. [DOI] [PubMed] [Google Scholar]
- Wangberg SC, Nilsen O, Antypas K, Gram IT. Effect of tailoring in an internet-based intervention for smoking cessation: randomized controlled trial. J Med Internet Res. 2011;13(4):e121. doi: 10.2196/jmir.1605. [DOI] [PMC free article] [PubMed] [Google Scholar]
- Wanner M, Martin-Diener E, Bauer G, Braun-Fahrlander C, Martin BW. Comparison of trial participants and open access users of a web-based physical activity intervention regarding adherence, attrition, and repeated participation. J Med Internet Res. 2010;12(1):e3. doi: 10.2196/jmir.1361. [DOI] [PMC free article] [PubMed] [Google Scholar]
Associated Data
This section collects any data citations, data availability statements, or supplementary materials included in this article.