Abstract
Recent studies revealed layers of enhanced aerosol scattering in the upper troposphere and lower stratosphere over Asia (Asian Tropopause Aerosol Layer (ATAL)) and North America (North American Tropospheric Aerosol Layer (NATAL)). We use a sectional aerosol model (Community Aerosol and Radiation Model for Atmospheres (CARMA)) coupled with the Community Earth System Model version 1 (CESM1) to explore the composition and optical properties of these aerosol layers. The observed aerosol extinction enhancement is reproduced by CESM1/CARMA. Both model and observations indicate a strong gradient of the sulfur-to-carbon ratio from Europe to the Asia on constant pressure surfaces. We found that the ATAL is mostly composed of sulfates, surface-emitted organics, and secondary organics; the NATAL is mostly composed of sulfates and secondary organics. The model also suggests that emission increases in Asia between 2000 and 2010 led to an increase of aerosol optical depth of the ATAL by 0.002 on average which is consistent with observations.
Key Points
The Asian Tropopause Aerosol Layer is composed of sulfate, primary organics, and secondary organics
The North American Tropospheric Aerosol Layer is mostly composed of sulfate and secondary organics
Aerosol Optical Depth of Asian Tropopause Aerosol Layer increases by 0.002 from 2000 to 2010
Keywords: ATAL, NATAL
1. Introduction
Recently, a layer of enhanced aerosol scattering associated with the Asian Summer Monsoon was observed by Stratospheric Aerosol and Gas Experiment II (SAGE II) [Thomason and Vernier, 2013] and CALIPSO [Vernier et al., 2011a]. The observed enhancement, referred to as the Asian Tropopause Aerosol Layer (ATAL), occurs during June-July-August in the broad region bounded by 0°–160°E, 15°–45°N. The layer extends vertically from about 13 to 18 km. CALIPSO backscatter observations show that the ATAL has been present since CALIPSO observations began in 2006. Thomason and Vernier [2013] and Vernier et al. [2015] show that the ATAL existed since 1999 in SAGEII data but was not detected prior to 1998. The source of the ATAL remains unclear. The Asian monsoon circulation transports Asian pollution from the boundary layer to the stratosphere, where satellites observe strong enhancements of carbon monoxide, HCN, and H2O [Park et al., 2009; Randel et al., 2010]. The Asian summer monsoon will also transport aerosol and precursor gases. However, in the first modeling study of the ATAL, Neely et al. [2014] show that the ATAL may originate from emissions over a wide region, including both Europe and Asia. The results of Neely et al. [2014] also suggest that the ATAL was likely present before 1998, but observations were most likely obscured by volcanic aerosol (i.e., from the Pinatubo eruption in 1991). One caveat of the Neely et al. [2014] study is that it utilized a sulfate-only model without aqueous chemistry.
Both SAGE II [Thomason and Vernier, 2013] and CALIPSO [Vernier et al., 2011a] observe a similar aerosol layer over North America, the North American Tropospheric Aerosol Layer (NATAL), which is weaker than the ATAL. Neely et al. [2014] also simulated this layer in conjunction with the ATAL. The NATAL is associated with the North American monsoon located in the Southwestern United States and Mexico [Adams and Comrie, 1997]. The sources, composition, and physical properties of the NATAL are likely to differ from the ATAL since the underlying lower tropospheric chemistry is greatly different. For example, the NATAL does not exhibit enhanced stratospheric CO [Park et al., 2009]. The transport mechanisms in the NATAL are also likely somewhat different than in the ATAL. Randel et al. [2012] show that both the ATAL and NATAL are regions in which water vapor enters the stratosphere in June-July-August (JJA); however, the isotopic composition of the water differs.
Aerosol that is pumped into the stratosphere may affect climate significantly by scattering sunlight back to space and absorbing radiation locally [Stocker et al., 2013]. Therefore, aerosol layers in upper troposphere and lower stratosphere (UTLS) may be important if they persist or their particles are transported into the stratosphere. The properties of the ATAL and the NATAL remain unclear due to limited in situ measurements. The composition and size distribution of the particles are important properties to determine since they control the impact of the aerosol on the radiation field. This study will address the composition, source, and optical properties of the ATAL and NATAL using a sectional aerosol model.
2. Methods
We analyze the properties of the ATAL and NATAL using a general circulation model (Community Earth System Model version 1 (CESM1)) coupled with a sectional aerosol microphysics model (Community Aerosol and Radiation Model for Atmospheres (CARMA)) [Toon et al., 1988; Bardeen et al., 2008]. CESM1/CARMA includes primary emitted organics, secondary organics, dust, sea salt, black carbon, and sulfate. In CARMA, we track two types of aerosol in two sets of radius bins. One type consists of sulfuric acid particles formed through nucleation and condensation of water and sulfur acid vapor, which primarily occurs locally. The other set of bins includes particles containing mixtures of organics, black carbon, sea salt, dust, and condensed sulfate. Gas phase sulfur chemistry is modeled using the algorithms described in English et al. [2011]. CARMA includes formation of cloud-borne sulfate through aqueous chemistry as well as SO2 formation from dimethyl sulfide as simulated by Model for Ozone and Related chemical Tracers (MOZART) [Emmons et al., 2010]. MOZART [Emmons et al., 2010] tracks five species of volatile organic compounds as precursors of secondary organic aerosol (SOA). To better quantify the formation of SOA, CARMA applies a volatility-basis-set approach that was introduced in Pye et al. [2010]. The aerosol scavenging schemes are from Rasch et al. [2000] and Barth et al. [2000]. The model considers both in-cloud and below-cloud scavenging. The scavenging coefficient below cloud is dependent on aerosol size and precipitation rate, similar to Henzing et al. [2006]. Aerosol extinction coefficients are calculated using Mie scattering theory. For the mixed particles a core shell structure is assumed. The core is composed of black carbon and dust, while the shell is composed of a combination of all other materials that are possibly in a liquid state including sulfate, organics, salt, and condensed water. The relative contribution of different materials can vary with time and space. This radiative information is then coupled to the dynamics of CESM1 through its radiation code. The simulations are carried out with 2° horizontal resolution and 56 vertical levels. In the region from 13 to 18 km altitude the simulations use about seven vertical levels. A 5 year spin-up run was first carried out so that the lower stratospheric aerosol layer reached a quasi-equilibrium state. Then two sets of ensembles are carried out for the years 2000 and 2010 with prescribed sea surface temperature, respectively. Each set of ensemble consists of three members with different initial conditions.
Organic emission rates, including primary particles and gases that form secondary particles, are taken from Amann et al. [2011] and the Global Fire Emission Database (GFED version 3) [Van der Werf et al., 2006, 2010]. SO2 emission inventories are introduced in Emmons et al. [2010]: anthropogenic SO2 emission rates come from EDGAR-FT2000 (http://www.mnp.nl/edgar/), with the exception that Asian emission inventories are taken from the Regional Emission inventory for Asia [Ohara et al., 2007]. SO2 emissions from biomass burning are estimated by GFED (version 2) [Van der Werf et al., 2006] and Fire INventory from NCAR [Wiedinmyer et al., 2011]. Biogenic emissions of volatile organic compounds (VOCs, including isoprene and monoterpenes) are estimated by Guenther et al. [2006]. Stratospheric volcanic emissions are excluded in this study.
Model results are compared to the limited in situ aerosol measurements in the Asian UTLS. CARIBIC (Civil Aircraft for the Regular Investigation of the atmosphere Based on a Instrument Container) provides observations of trace gases and aerosols since 1997 through intercontinental flights at 9–12 km altitude, which is at the lower edge of the ATAL [Brenninkmeijer et al., 2007]. We use CARIBIC aerosol elemental analysis data [Martinsson et al., 2014] from 2005 to 2014 collected during 330 flights from Frankfurt in Germany to East Asia (Guangzhou, China), Southeast Asia (Bangkok, Thailand), and the Indian subcontinent (Chennai, India). Detailed sampling and elemental analysis methods are described in Nguyen et al. [2006] and Martinsson et al. [2014].
3. Results
Figure1 shows the simulated aerosol extinction ratio, defined as the total extinction (i.e., aerosol extinction plus molecular extinction) divided by the molecular extinction, at a wavelength of 1000 nm averaged from 15° to 45° N, over the period June, July, and August 2000. A layer of enhanced aerosol scattering, Box 1, extends from ∼14 km to 18 km vertically, and from ∼0° to 120°E. The location and shape of the simulated layer of enhanced scattering is consistent with SAGE II observations from Thomason and Vernier [2013]. However, our model simulation also predicts an aerosol enhancement mainly composed of mineral dust extending from the surface up to 13 km above Africa, Box 2, which is not seen in the CALIPSO [Vernier et al., 2011a] or SAGE II [Thomason and Vernier, 2013] observations. Thomason and Vernier [2013] used a filter for eliminating the effects of clouds on their observations, which depends on the aerosol absolute extinction and the extinction ratio at two wavelengths (1000 nm and 525 nm). When we apply the same filter, the layer over Africa disappears, which suggests that the cloud filter used in Thomason and Vernier [2013] may mask a fraction of aerosol that has relatively big particles with high extinction coefficients.
Figure 1.
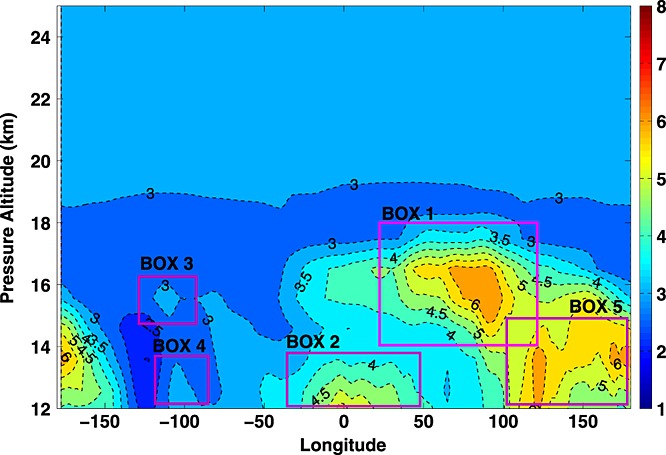
Aerosol extinction ratio at 1000 nm averaged between 15° and 45°N during JJA seasons using emissions from 2000. Contour interval is 0.5.
In addition to simulating the ATAL, our model also predicts a weaker, less extended aerosol layer near ∼15 km over North America centered at 100°W longitude, Box 3, consistent with the location of the North American Monsoon [Adams and Comrie, 1997]. This simulated structure is consistent with the observations of CALIPSO and SAGE II [Vernier et al., 2011a; Thomason and Vernier, 2013] and modeled by Neely et al. [2014]. The simulated NATAL peak extinction ratio is only 48% of that of the simulated ATAL. Below the NATAL, another aerosol enhancement region extending up to 13 km is also predicted by the model, Box 4. This lower layer is mainly composed of SOA over North America where copious biogenic VOCs are known to be emitted. Similarly, the ATAL is adjacent to a lower layer extending downward and eastward centered around 120°E, Box 5. Both layers associated with Asia are composed of materials transported from the surface. However, those in the ATAL are pumped up by the Asian summer monsoon and confined into the anticyclone. These lower layers have not been reported from satellite data.
The simulated peak value of the ATAL extinction ratio is about 3 times that observed by SAGE II [Thomason and Vernier, 2013]. Simulated hygroscopic growth on aerosols may contribute to the disagreement. CARMA parameterizes hygroscopic growth with relative humidity [Bardeen et al., 2008]. In the UTLS, relative humidity is high and extinction increases strongly with high humidity. In reality, however, particles may not grow due to the low temperatures in the UTLS. Sensitivity tests with no hygroscopic growth in the upper troposphere and above shows up to 30% decrease in the extinction of the ATAL, which still leaves the model a factor of 2 higher than observations. It is also conceivable that SAGE II-derived products preferentially exclude aerosol with high extinctions that are colocated with cloud due to filtering that attempts to remove cirrus cloud [Thomason and Vernier, 2013]. In situ data may be needed to constrain both model humidity parameterization and satellite retrievals. If, in fact, particles do not grow when relative humidity increases at low temperatures, it would be important for theories of cirrus cloud formation [Koop et al., 2000]. In addition, the model may overestimate the aerosol loading in the ATAL region possibly due to an underestimation of wet scavenging. It is also possible that the model overestimates particle size. The ratio of the extinction at 525 nm to 1020 nm in the model is centered at 3–3.5, while from SAGE II it is 4–4.5 [Thomason and Vernier, 2013], which is consistent with the model overestimating size, or the SAGE II retrieval algorithm rejecting larger aerosols. The modeled particle effective radius is between 0.1 and 0.2 µm in the ATAL region. Unfortunately, there are no in situ data to compare the model results to in this region.
Several groups have investigated the aerosol composition of the tropical UTLS. Froyd et al. [2009], for instance, show the tropical tropopause layer (TTL) contains sulfate and organic particles in roughly equal proportions based on two campaigns over tropical Central America. In addition, while English et al. [2011] and Neely et al. [2013] show that sulfates alone cannot explain the extinction in the TTL observed by SAGE II below about 20 km, Brühl et al. [2012] show that in addition to sulfates, organics contribute to the aerosol extinction in the TTL observed by SAGE II.
CARIBIC provides data on the sulfur-to-carbon mass ratio in the upper troposphere over Europe and Asia, as shown in Figure2. Simulated values are averaged from 200 to 300 mb, pressures which are below the ATAL. Because the CARIBIC data (circles) are from samples take during individual flights over a period of time, actual meteorological conditions produce some variability. Both simulations and observations show a strong decline of the sulfur-carbon ratio from higher latitudes (e.g., Europe, 50–70% sulfur-to-carbon (S/C)) to lower latitudes (e.g., Chennai, Bangkok, and Guangzhou, 10–20% S/C). Part of the reason for the decline in the S/C ratio as latitude decreases is that the tropopause is lower at higher latitudes so that more stratospheric sulfate is present along planes of constant pressure as shown in Figure2. In addition, more organics are emitted over India and China than over Europe, which are transported upward in the Asian summer monsoon. CARIBIC data were taken at the base of the ATAL. CESM1/CARMA simulations (not shown in this paper) suggest that the S/C ratio does not vary by more than 10% from 14 to 16 km in the middle to upper troposphere but increases rapidly in the lower stratosphere.
Figure 2.
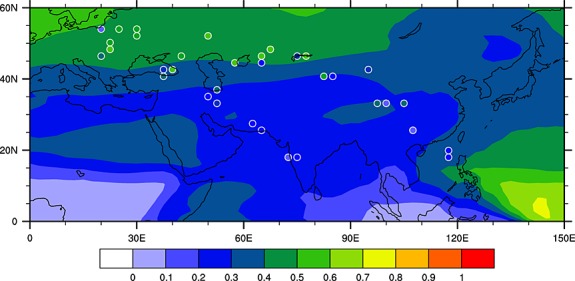
Sulfur-to-carbon (S/C) mass ratio of JJA shown in the panel averaged from 200 to 300 mb using 2010 emissions. Model simulations are shown in contour background. CARIBIC observations are shown as circles.
The simulation results shown in Figure3 suggest the ATAL to be mostly composed of organics (roughly 60% by mass) and sulfate (roughly 40%) given 2010 emissions. The simulated NATAL composition is 80% organics with 20% sulfate (Figure3). The simulated ATAL and NATAL is mostly composed of sulfate and organics, which is consistent with Froyd et al. [2009] who showed that the aerosol composition over Central America is also a mixture of organics and sulfate. Simulations also suggest that the effective radius of mixed particles (mostly composed of organics at 100 mb) is between 0.2 and 0.3 µm in both ATAL and NATAL, while the effective radius of pure sulfate particles (33% of total sulfate mass is in pure sulfates, leaving 67% of sulfate in the mixed particles) is below 0.1 µm, indicating pure sulfates were been formed locally to the layers.
Figure 3.
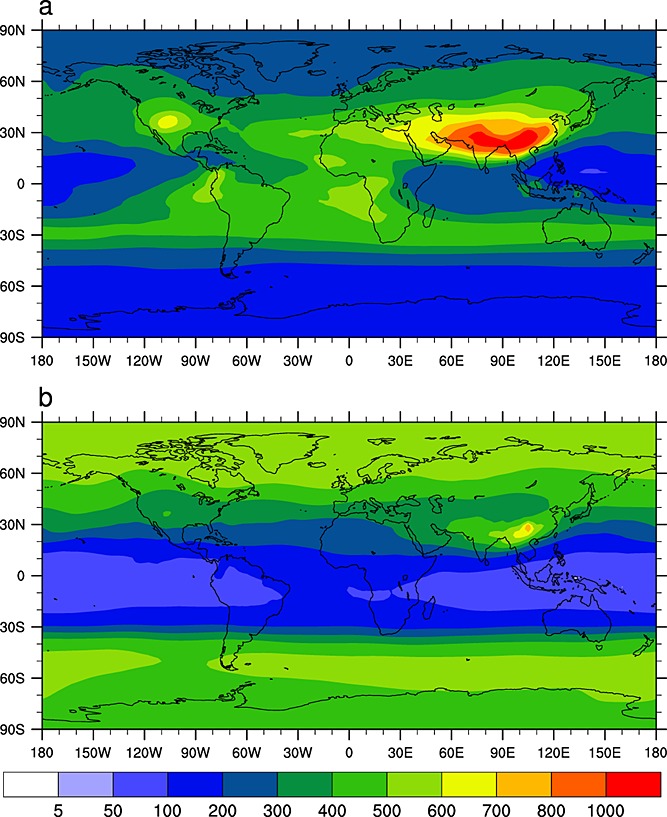
(a) Simulated organic mass (µg/m2) between 100 mb to 230 mb; (b) simulated sulfate.
According to the CESM1/CARMA results shown here, primary organic aerosol (POA) and secondary organic aerosol (SOA) make comparable contributions to the ATAL (Figure4). However, the aerosol enhancement over North America is mostly due to SOA.
Figure 4.
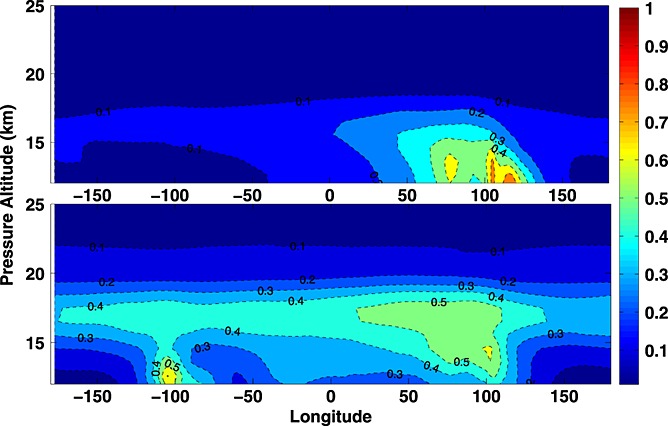
(top) POA and (bottom) SOA mass mixing ratios (ppb) simulated by CESM1/CARMA in the ATAL during the JJA season. Contour interval is 0.1 ppb.
4. Discussion
In addition to the ATAL and NATAL (see Figure1), this study finds other aerosol enhancement features in the upper troposphere that are not currently recognized in observations. These aerosol features extend downward and eastward from both the ATAL and the NATAL (an additional enhancement due to dust is found over Africa). The layer downward and eastward of the NATAL is also composed of SOA associated with strong biogenic emission from the surface. The layer eastward and downward of the ATAL is dominated by POA.
Background stratospheric aerosols increased from 2000 to 2010 [Solomon et al., 2011; Vernier et al., 2011b]. Using a conservative method to remove ice clouds in SAGEII and CALIPSO data, Vernier et al. [2015] show the aerosol optical depth (AOD) at 525 nm of the ATAL has increased from 0.003 in year 2000 to roughly 0.005 in year 2010. Vernier et al. [2011b] and Neely et al. [2013] suggest recent anthropogenic increases in SO2 from Asia cannot explain a global stratospheric aerosol increase since 2000, which is largely due to small volcanic eruptions. Here we explore the contribution of Asian emissions to the aerosol in the UTLS by completing two sets of simulations with ensembles of three members each. One set of ensembles uses emissions for the year 2000 and the other emissions for the year 2010. Emission databases are introduced in section 2. The emissions in midlatitudes, especially anthropogenic SO2 and VOCs vary between 2000 and 2010 over Asia, Europe, and North America. Volcanic emissions are excluded in both years. Figure5 shows column AOD (from 13 to 18 km) at 532 nm averaged from 15°N to 45°N in JJA of 2010 (red curve) and 2000 (blue curve), respectively. Error bars denote data variability (standard deviation) inside ensemble runs (three members with slightly different initial conditions). The modeled AOD of the ATAL is up to a factor of 2 higher than reported in Vernier et al. [2015] as discussed in the context of Figure1. This test suggests that the AOD was generally higher in 2010 for latitudes from 15° to 45°N at all longitudes. A statistically significant AOD increase is found in the ATAL region (0°–120°E). AOD changes at other longitudes including the NATAL (70°W–120°W) are within data variability inside ensembles. This study suggests the emission increase in Asia between 2000 and 2010 has lead to an increase in the optical depth of the ATAL region by about 0.002 on average, which is similar to that the estimate by Vernier et al. [2015]. The sulfate mass fraction in the ATAL is similar between 2000 and 2010 (roughly 40%); the growth in optical depth comes from increased emissions of SO2 (increasing by 13%), primary organics (7.3%), and anthropogenic SOA (30%) in the region of ATAL (15°–45°N, 0°–120°E).
Figure 5.
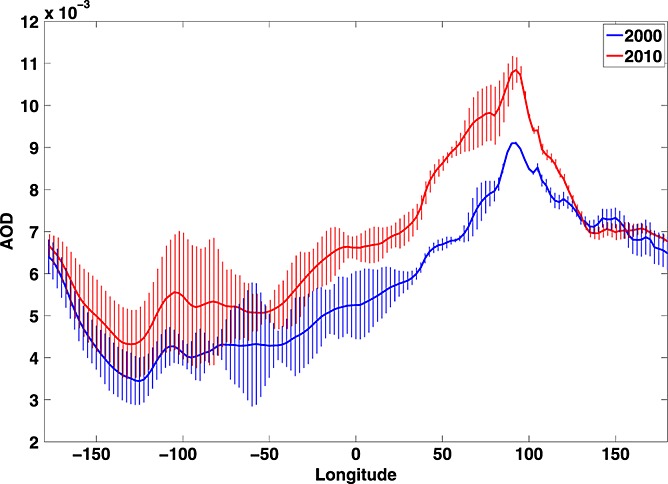
Column AOD (from 13 to 18 km, at 532 nm) averaged from 15° to 45°N in JJA. Red line denotes AOD of 2010; blue line denotes AOD of 2000. Error bars represent variability (standard deviation) inside ensemble runs.
5. Summary
A three-dimensional climate model coupled with a sectional aerosol model (CESM1/CARMA) is used to analyze the composition and optical properties of the ATAL and the NATAL. The modeled aerosol extinction ratio peaks in the UTLS over Asia in a layer extending from 14 to 18 km, which is consistent with SAGE II observations [Thomason and Vernier, 2013] and CALIPSO observations [Vernier et al., 2011a]. The simulations reproduce the S/C ratio established by in situ measurements of the CARIBIC observatory [Martinsson et al., 2014] from 200 mb to 300 mb over Europe and Asia. The S/C ratio decreases from higher latitudes to lower latitudes, which possibly results in part from more organics emitted over India and China than over Europe. According to the simulations, the ATAL is mostly composed of mixed organics and sulfates with an effective radius of 0.2–0.3 µm, and in situ generated sulfate particles with an effective radius below 0.1 µm. Due to the high occurrence of cirrus clouds over India and China, aerosol measurements from satellite-based remote sensing instruments are difficult. We predict larger extinctions in the ATAL than observed, which could be due to satellites failing to detect the aerosol in high humidity, cloudy regions. Alternatively, the hygroscopic growth of the aerosols in our model may be too great, which may be of importance to theories of cirrus cloud nucleation. Or, our model may overpredict aerosol mass or size in the ATAL. Our simulations reproduce the NATAL with weaker intensity compared with the ATAL during the JJA season as observed. While the ATAL has a strong POA contribution, the simulated NATAL is mostly composed of biogenic SOA. Simulations also suggest recent increased anthropogenic emission of SO2 as well as organic aerosols and gases in Asia lead to an increase in optical depth of the ATAL region by 0.002 on average between 2000 and 2010.
Acknowledgments
This work was supported by NASA award NNX12AC64G and NASA award NNX14AR56G. The CESM project is supported by the National Science Foundation and the Office of Science (BER) of the U.S. Department of Energy. Computing resources (ark:/85065/d7wd3xhc) were provided by the Climate Simulation Laboratory at NCAR’s Computational and Information Systems Laboratory (CISL), sponsored by the National Science Foundation and other agencies. Neely was supported by the NSF via NCAR’s Advanced Study Program. We thank Andreas Stohl and Klimont Zbigniew for providing ECLIPSE emission data for black carbon and organics. CARIBIC data are available from personal communication (http://www.caribic-atmospheric.com/).
The Editor thanks Peter Colarco and an anonymous reviewer for their assistance in evaluating this paper.
References
- Adams DK. Comrie AC. The North American monsoon. Bull. Am. Meteorol. Soc. 1997;78:2197–2213. , and, doi: 10.1175/1520-0477(1997)078<2197:TNAM>2.0.CO;2. [Google Scholar]
- Amann M. Cost effective control of air quality and greenhouse gases in Europe: Modeling and policy applications. Environ. Modell. Softw. 2011;26:1489–1501. , et al. ( [Google Scholar]
- Bardeen CG, Toon OB, Jensen EJ, Marsh DR. Harvey VL. Numerical simulations of the three-dimensional distribution of meteoric dust in the mesosphere and upper stratosphere. J. Geophys. Res. 2008;113 , and, D17202, doi: 10.1029/2007JD009515. [Google Scholar]
- Barth MC, Rasch PJ, Kiehl JT, Benkovitz CM. Schwartz SE. Sulfur chemistry in the National Center for Atmospheric Research Community Climate Model: Description, evaluation, features, and sensitivity to aqueous chemistry. J. Geophys. Res. 2000;105(D1):1387–1415. , and, doi: 10.1029/1999JD900773. [Google Scholar]
- Brenninkmeijer CAM. Civil Aircraft for the regular investigation of the atmosphere based on an instrumented container: The new CARIBIC system. Atmos. Chem. Phys. 2007;7:4953–4976. , et al. (, doi: 10.5194/acp-7-4953-2007. [Google Scholar]
- Brühl C, Lelieveld J, Crutzen PJ. Tost H. The role of carbonyl sulphide as a source of stratospheric sulphate aerosol and its impact on climate. Atmos. Chem. Phys. 2012;12:1239–1253. , and, doi: 10.5194/acp-12-1239-2012. [Google Scholar]
- Emmons LK. Description and evaluation of the Model for Ozone and Related chemical Tracers, version 4 (MOZART-4) Geosci. Model Dev. 2010;3:43–67. , et al. (, doi: 10.5194/gmd-3-43-2010. [Google Scholar]
- English JM, Toon OB, Mills MJ. Yu F. Microphysical simulations of new particle formation in the upper troposphere and lower stratosphere. Atmos. Chem. Phys. 2011;11(17):9303–9322. , and, doi: 10.5194/acp-11-9303-2011. [Google Scholar]
- Froyd KD, Murphy DM, Sanford TJ, Thomson DS, Wilson JC, Pfister L. Lait L. Aerosol composition of the tropical upper troposphere. Atmos. Chem. Phys. 2009;9(13):4363–4385. [Google Scholar]
- Guenther A, Karl T, Harley P, Wiedinmyer C, Palmer PI. Geron C. Estimates of global terrestrial isoprene emissions using MEGAN (Model of Emissions of Gases and Aerosols from Nature) Atmos. Chem. Phys. 2006;6:3181–3210. [Google Scholar]
- Henzing JS, Olivié DJL. van Velthoven PFJ. A parameterization of size resolved below cloud scavenging of aerosols by rain. Atmos. Chem. Phys. 2006;6:3363–3375. , and, doi: 10.5194/acp-6-3363-2006. [Google Scholar]
- Koop T, Luo B, Tsias A. Peter T. Water activity as the determinant for homogeneous ice nucleation in aqueous solutions. Nature. 2000;406:611–614. doi: 10.1038/35020537. , and, doi: 10.1038/35020537. [DOI] [PubMed] [Google Scholar]
- Martinsson BG, Friberg J, Andersson SM, Weigelt A, Hermann M, Assmann D, Voigtländer J, Brenninkmeijer CAM, van Velthoven PJF. Zahn A. Comparison between CARIBIC aerosol samples analysed by accelerator-based methods and optical particle counter measurements. Atmos. Meas. Tech. 2014;7:2581–2596. , and, doi: 10.5194/amt-7-2581-2014. [Google Scholar]
- Neely RR., III Recent anthropogenic increases in SO2 from Asia have minimal impact on stratospheric aerosol. Geophys. Res. Lett. 2013;40 , et al. (, doi: 10.1002/grl.50263. [Google Scholar]
- Neely RR, III, Yu P, Rosenlof KH, Toon OB, Daniel JS, Solomon S. Miller HL. The contribution of anthropogenic SO2 emissions to the Asian tropopause aerosol layer. J. Geophys. Res. Atmos. 2014;119:1571–1579. , and, doi: 10.1002/2013JD020578. [Google Scholar]
- Nguyen HN, Gudmundsson A. Martinsson BG. Design and calibration of a multi-channel aerosol sampler for studies of the tropopause region from the CARIBIC platform. Aerosol Sci. Technol. 2006;40:649–655. [Google Scholar]
- Ohara T, Akimoto H, Kurokawa J, Horii N, Yamaji K, Yan X. Hayasaka T. An Asian emission inventory of anthropogenic emission sources for the period 1980–2020. Atmos. Chem. Phys. 2007;7:4419–4444. [Google Scholar]
- Park M, Randel WJ, Emmons LK. Livesey NJ. Transport pathways of carbon monoxide in the Asian summer monsoon diagnosed from Model of Ozone and Related Tracers (MOZART) J. Geophys. Res. 2009;114 , and, D08303, doi: 10.1029/2008JD010621. [Google Scholar]
- Pye HOT, Chan AWH, Barkley MP. Seinfeld JH. Global modeling of organic aerosol: The importance of reactive nitrogen (NOx and NO3) Atmos. Chem. Phys. 2010;10:11,261–11,276. , and, doi: 10.5194/acp-10-11261-2010. [Google Scholar]
- Randel WJ, Park M, Emmons L, Kinnison D, Bernath P, Walker KA, Boone C. Pumphrey H. Asian monsoon transport of pollution to the stratosphere. Science. 2010;328:611–613. doi: 10.1126/science.1182274. , and, doi: 10.1126/science.1182274. [DOI] [PubMed] [Google Scholar]
- Randel WJ, Moyer E, Park M, Jensen E, Bernath P, Walker K. Boone C. Global variations of HDO and HDO/H2O ratios in the upper troposphere and lower stratosphere derived from ACE-FTS satellite measurements. J. Geophys. Res. 2012;117 , and, D06303, doi: 10.1029/2011JD016632. [Google Scholar]
- Rasch PJ, Barth MC, Kiehl JT, Schwartz SE. Benkovitz CM. A description of the global sulfur cycle and its controlling processes in the National Center for Atmospheric Research Community Climate Model, version 3. J. Geophys. Res. 2000;105(D1):1367–1385. , and, doi: 10.1029/1999JD900777. [Google Scholar]
- Solomon S, Daniel JS, Neely RR, Vernier J-P, Dutton EG. Thomason LW. The persistently variable “Background” stratospheric aerosol layer and global climate change. Science. 2011;333(6044):866–870. doi: 10.1126/science.1206027. , and, doi: 10.1126/science.1206027. [DOI] [PubMed] [Google Scholar]
- Stocker TF. Technical summary. In: Stocker TF, editor. Climate Change 2013: The Physical Science Basis. Contribution of Working Group I to the Fifth Assessment Report of the Intergovernmental Panel on Climate Change. Cambridge, U. K., and New York: Cambridge Univ. Press; 2013. pp. 33–115. , edited by et al., et al. (,, doi: 10.1017/CBO9781107415324.005. [Google Scholar]
- Thomason LW. Vernier J-P. Improved SAGE II cloud/aerosol categorization and observations of the Asian tropopause aerosol layer: 1989–2005. Atmos. Chem. Phys. 2013;13:4605–4616. , and, doi: 10.5194/acp-13-4605-2013. [Google Scholar]
- Toon OB, Turco RP, Westphal D, Malone R. Liu MS. A multidimensional model for aerosols—description of computational analogs. J. Atmos. Sci. 1988;45(15) , and ), doi: 10.1175/1520-0469(1988) [Google Scholar]
- van der Werf GR, Randerson JT, Giglio L, Collatz GJ, Kasibhatla PS. Arellano AF. Interannual variability in global biomass burning emissions from 1997 to 2004. Atmos. Chem. Phys. 2006;6:3423–3441. [Google Scholar]
- van der Werf GR, Randerson JT, Giglio L, Collatz GJ, Mu M, Kasibhatla PS, Morton DC, DeFries RS, Jin Y. van Leeuwen TT. Global fire emissions and the contribution of deforestation, savanna, forest, agricultural, and peat fires (1997–2009) Atmos. Chem. Phys. 2010;10:11,707–11,735. , and, doi: 10.5194/acp-10-11707-2010. [Google Scholar]
- Vernier J-P, Thomason LW. Kar J. CALIPSO detection of an Asian tropopause aerosol layer. Geophys. Res. Lett. 2011a;38 , and, L07804, doi: 10.1029/2010GL046614. [Google Scholar]
- Vernier J-P. Major influence of tropical volcanic eruptions on the stratospheric aerosol layer during the last decade. Geophys. Res. Lett. 2011b;38 , et al. (, L12807, doi: 10.1029/2011GL047563. [Google Scholar]
- Vernier J-P, Fairlie TD, Natarajan M, Wienhold FG, Bian J, Martinsson BG, Crumeyrolle S, Thomason LW. Bedka K. Increase in upper tropospheric and lower stratospheric aerosol levels and its potential connection with Asian Pollution. J. Geophys. Res. Atmos. 2015;120:1608–1619. doi: 10.1002/2014JD022372. , and, doi: 10.1002/2014JD022372. [DOI] [PMC free article] [PubMed] [Google Scholar]
- Wiedinmyer C, Akagi SK, Yokelson RJ, Emmons LK, Al-Saadi JA, Orlando JJ. Soja AJ. The Fire Inventory from NCAR (FINN): A high resolution global model to estimate the emissions from open burning. Geosci. Model Dev. 2011;4(3):625–641. [Google Scholar]


