

Abstract
An innovative approach was developed for the discovery of new natural products by combining mass spectrometric metabolic profiling with genomic analysis, and resulted in the discovery of the columbamides, a new class of di- and tri-chlorinated acyl amides with cannabinomimetic activity. Three species of cultured marine cyanobacteria, Moorea producens 3L, Moorea producens JHB and Moorea bouillonii PNG, were subjected to genome sequencing and analysis for their recognizable biosynthetic pathways, and this information was then compared with their respective metabolomes as detected by MS-profiling. By genome analysis, a presumed regulatory domain was identified upstream of several previously described biosynthetic gene clusters in two of these cyanobacteria, M. producens 3L and M. producens JHB. A similar regulatory domain was identified in the M. bouillonii PNG genome, and a corresponding downstream biosynthetic gene cluster was located and carefully analyzed. Subsequently, MS-based molecular networking identified a series of candidate products, and these were isolated and their structures rigorously established. Based on their distinctive acyl amide structure, the most prevalent metabolite was evaluated for cannabinomimetic properties and found to be a moderate affinity ligand for CB1.
Marine cyanobacteria have emerged as a bountiful source of structurally diverse and biologically active natural products, some of which have inspired the development of new pharmaceutical agents.1 Using the orthologous methods of genome mining and, rapid mass spectrometric dereplication followed by careful structure elucidation, the discovery process of new secondary metabolites is becoming increasingly streamlined and efficient. The genomics approach provides information about the type of biosynthetic gene cluster present, and correspondingly, structural predictions about the natural products produced.2–4 In cyanobacteria, polyketide synthases (PKS), nonribosomal peptide synthetases (NRPS) or hybrids of these two, are most commonly encountered, and are generally amenable to informatic-based deductions of structure.5 With the mass spectrometric based metabolomics approach, deductions can be made about the number of compounds and compound classes present within a natural product extract. In addition, combining high resolution mass spectrometry (HRMS) together with the molecular ion isotopic pattern and MS2-based fragmentation analyses, it is possible to develop tentative structural information about unknown compounds. Therefore, combining genomics and metabolomics makes possible the linkage of specific compounds to gene clusters and vice versa, and this information can be used to enhance the discovery and isolation of new natural products.6, 7
Herein we describe the discovery of a new class of acyl amides based on genome comparisons and mass spectrometric metabolic profiling of three cyanobacterial strains of the genus Moorea (formerly known as Lyngbya8). This genus is known to produce many structurally diverse and biologically active natural products.9 Moorea producens 3L, collected in Curaçao, produces the tubulin polymerization inhibitor curacin A, the molluscicide barbamide and the antimalarial compound carmabin.10–13 Moorea producens JHB, obtained from shallow coastal waters in Jamaica, is known for its production of the sodium channel blocker jamaicamide and the fungicide hectochlorin.14, 15 Complementing these, Moorea bouillonii PNG from Papua New Guinea produces the cytotoxic apratoxins A–C and lyngbyabellin A (Table 1).16, 17
Table 1.
Moorea Species Studied in This Report, Their Origins and Reported Natural Products, and References to Previously Described Biosynthetic Gene Clusters. A phylogenetic analysis of these strains was previously published.9, 18
| Strain | Origin | Compounds | Cluster Known? | NCBI accession number |
|---|---|---|---|---|
|
| ||||
| Moorea producens 3L | Curaçao | Barbamide19, Dechlorobarbamide20 | Yes 13 | HQ696501 |
|
| ||||
| Carmabin A-B21 | Yes 11 | NZ_GL890970 | ||
|
| ||||
| Curacin A-C12, Curazole22 | Yes 23 | HQ696500 | ||
|
| ||||
|
Moorea producens JHB JHB22Aug96-1 |
Jamaica - Hector’s Bay | Hectochlorin15 | Yes 24 | AY974560 |
|
| ||||
| Jamaicamides A-C14 | Yes 14 | AY522504 | ||
|
| ||||
|
Moorea bouillonii PNG PNG19May05-8 |
Papua New Guinea - Pigeon Island | Apratoxin A-C25 | Yes 16 | - |
|
| ||||
| Lyngbyabellin A17 | Yes unpublished | - | ||
Improvements in whole genome sequencing and bioinformatics tools have resulted in a more facile identification of the biosynthetic gene clusters responsible for the formation of natural products.26 In particular, the biosynthetic gene clusters encoding polyketides and non-ribosomal peptides are readily detected and subsequent structure predictions are possible.27 Nevertheless, questions still remain whether an identified biosynthetic gene cluster is functionally expressed and if it is responsible for the production of a new or a known natural product. Due to the relative lack of molecular biology techniques, such as mutagenic gene knock-outs and heterologous expression systems, for cyanobacterial Moorea strains as well as filamentous marine cyanobacteria in general, other methods must be used to unequivocally relate a given gene cluster to a specific natural product. For example, functional expression of distinctive biosynthetic enzymes from these clusters and characterization of their specificity and chemical reactivity has been used in several cases to confirm the connection between gene cluster and compound (e.g. barbamide, curacin A, jamaicamide A14, 28, 29). Another conceivable approach is to identify similar or nearly identical biosynthetic genes between different cyanobacterial genomes, and to compare this information with that generated from parallel metabolomic studies. In the current study, this latter approach was taken in that all of the NRPS and PKS biosynthetic gene clusters of the Moorea strains listed above were identified in their respective genomic data sets, and this information was then juxtaposed with mass spectrometric profiles observed with the Molecular Networks algorithm30 to identify a family of functionally expressed novel metabolites. Subsequently, these metabolites were isolated in high purity from laboratory cultures and their structures rigorously determined as a series of acyl amides with unique positions of chlorination. Owing to their structural relationship to anandamide and other cannibinomimetic compounds, the two major compounds columbamides A and B were evaluated for cannabinoid receptor CB1 and CB2 binding efficacy, and found to be the most potent analogs yet isolated from the marine world.31
RESULTS AND DISCUSSION
Identification of Biosynthetic Gene Cluster
The genome of M. producens 3L was obtained by Sanger and 454 sequencing11 whereas those of M. producens JHB and M. bouillonii PNG were sequenced using Illumina Hiseq; in addition, for M. bouillonii PNG PACBIO sequencing was also performed. Assembly of all genomes utilized SPAdes 3.0 and 3.132, 33 with BayesHammer [NN2] read error correction.34 In each case, the source cyanobacteria were contaminated with heterotrophic bacteria that were associated with the filament sheath. As a result, a modest complexity metagenomic dataset was obtained, and therefore the sequence data were binned to obtain the low GC cyanobacterial sequences (43.6% GC) separate from the higher GC content contaminants. Table 2 depicts the quality of the three draft genomes using the QUality ASsessment Tool (QUAST) for Genome Assemblies.35 The published genome from M. producens 3L had 161 contigs while the DNA sequences for M. producens JHB and M. bouillonii PNG were more fragmented with 960 and 579 contigs, respectively. The approximate sizes of the Moorea genomes appear to be between 8–9.5 MB (Table 2).
Table 2.
QUAST (QUality ASsessment Tool for Genome Assemblies) Results for the Three Moorea Strains.
| 3L | JHB 22Aug96-1 | PNG 19May05-8 | |
|---|---|---|---|
| # contigs | 161 | 960 | 579 |
| Largest contig | 593,782 | 144,691 | 135,461 |
| Total length | 8,478,612 | 9,501,724 | 8,576,967 |
| N50 | 123,305 | 20,017 | 31,790 |
| L50 | 19 | 145 | 77 |
| GC (%) | 43.68 | 43.67 | 43.65 |
Because the focus of this study was to detect biosynthetic gene clusters and their respective encoded compounds, we performed a manual assembly to close gaps (unpublished data) in cases where putative biosynthetic gene clusters were split between two contigs. Biosynthetic gene clusters were identified in the three draft genomes using common bioinformatics tools, including AntiSMASH and NaPDos.27, 36, 37 The genome of M. producens 3L contains six PKS, NRPS or hybrid biosynthetic pathways that include the curacin A, barbamide and carmabin pathways. The M. producens JHB strain has eight biosynthetic pathways in addition to those encoding for jamaicamide and hectochlorin production. In the genome of M. bouillonii PNG, seven PKS/NRPS-based biosynthetic pathways are present, including those for apratoxin and lyngbyabellin biosynthesis.
From LC-MS results as well as previous reports, M. producens 3L and M. producens JHB produce large amounts of the hybrid PKS-NRPS metabolites curacin A and jamaicamide A, respectively.12, 14 The biosynthetic gene clusters for both of these natural products are known, and intriguingly, they each are located adjacent to a regulatory serine histidine kinase gene.38 This regulatory kinase is highly homologous between the two Moorea strains (96.1% identity based on protein sequence), suggesting the hypothesis that it is specifically associated with highly expressed natural product gene clusters. We therefore reasoned that searching for the gene encoding this regulatory enzyme within the M. bouillonii PNG genome sequence might identify new natural product biosynthetic gene clusters. Such a BLAST search was conducted using the entirety of the kinase protein sequence from M. producens 3L (WP_008191774.1), and revealed one highly homologous sequence in the M. bouillonii PNG genome. Investigation of the gene neighborhood for this kinase revealed a new and undescribed biosynthetic gene cluster with several unique features, as described below.39 To evaluate the potential expression of novel metabolites by this gene cluster, the metabolic profile of each strain was analyzed by mass spectrometric molecular networking30, 40 and then utilized in a comparative metabolomics approach to complement the genomic analysis.
Metabolic Profiling of Moorea Strains
Cultured biomass of M. producens 3L, M. producens JHB and M. bouillonii PNG was harvested and chemically extracted, and the metabolic profile of each was evaluated using molecular networking.30 This mass spectrometry based tool uses fragmentation patterns to determine the relative similarity of different metabolites. Molecules with similar fragmentation patterns cluster together and are visualized as a series of nodes (=molecules) and edges (=similarities) in Cytoscape. In addition, by comparing MS2-fragmentation patterns against the natural product MS/MS-library, the dereplication process is accelerated, and novel compound classes can be easily identified. In the current case, the extracts were analyzed using both ion trap (ITMS) and QTof mass spectrometers; this allowed production of a robustly annotated network by utilizing chemical standards generated from our in-house pure compound library41 as well as accurate formula assignments from the HRMS data. Figure 2 depicts the molecular network obtained from combining the datasets generated from analysis of the extracts of M. producens 3L, M. producens JHB and M. bouillonii PNG. The color of the node reflects the strain [M. producens 3L (red), M. producens JHB (yellow) and M. bouillonii PNG (green)]. The size of each individual node reflects the abundance of the compound based on the number of MS2-spectra scans present. The square shaped nodes indicate matches to previously characterized compounds. Each node is labeled with its respective parent mass.
Figure 2.

Molecular network (A) derived from mass spectrometric analysis of extracts of M. producens 3L (red), M. producens JHB (yellow), M. bouillonii PNG (green). In the nodes, squares indicate consensus MS/MS spectra to compounds in a MS/MS-library of known molecules. The respective compound name of an identified molecule is given next to the square node. The node size is representative of the numbers of MS2-spectra obtained for that specific m/z. The thickness of the edges between nodes indicates the degree of similarity between their respective MS2 spectra. Multiple clusters per compound derives from the fact that [M+H]+ and [M+Na]+ parent ions sometimes fragment differently. The black rectangles indicate the clusters of interest and are enlarged in B.
The major compounds produced by M. producens 3L are the curacins,12 barbamide13 and carmabins,21 whereas those of Moorea producens JHB are the hectochlorins24 and jamaicamides.14 The metabolic profile of M. bouillonii PNG reflects the biosynthesis of lyngbyabellin A17 and the apratoxins.16 In addition, two clusters (marked with black squares) were particularly interesting because the isotopic pattern of the parent masses indicated di- and tri-chlorinated species. In addition, the relatively large size of the nodes reflected the fact that these molecules were abundant in M. bouillonii PNG. Moreover, these features of size and chlorination were generally in accord with the prediction of the new biosynthetic gene cluster in M. bouillonii PNG. Consequently, the biosynthetic gene cluster was analyzed in greater detail, the encoded compounds were isolated, and their chemical structures elucidated by NMR, resulting in the discovery of columbamides A (1), B (2) and C (3).
Analysis of the Col Biosynthetic Gene Cluster
Table 3 and Figure 3 summarize the deduced function of each gene and depict its involvement in the putative biosynthetic pathway. Based on the subsequent structure elucidation of the columbamides, the gene cluster is designated as ‘col’. Natural product biosynthetic gene clusters are often found associated with transposases; in this case, two were identified at the presumed 5′-end boundary of the gene cluster (Orf1, Orf2).14, 24, 42 These genetically mobile elements can play a role in the horizontal acquisition and distribution of natural product gene clusters between different strains.43 The initial biosynthetic enzyme of the cluster, ColA, encodes for a putative acyl-CoA synthetase. Cyanobacterial biosynthetic gene clusters often contain acyl-ACP synthetase starting units (jamaicamide JamA, hectochlorin HctA)14, 24 and commonly hexanoic acid is loaded onto an acyl-carrier protein. In this case, BlastP analysis revealed a 63% identity between colA and puwC of the lipopeptide puwainaphycin biosynthetic gene cluster and a 57% identity between colA and the fatty acyl ACP ligase of the olefin-synthase (OLS)-pathway.18, 44 The OLS-pathway is responsible for hydrocarbon production in cyanobacteria and utilizes long-chain fatty acids as initial substrates.18 Based on subsequent structure elucidation of the compounds formed by this biosynthetic gene cluster, the colA gene loads dodecanoic acid onto the acyl carrier protein ColC.
Table 3.
Deduced Functions of the Open Reading Frames in the col Gene Cluster.
| Protein | Amino acids | Proposed function | Sequence Similarity (Protein, Origin) | Identity/Similarity | Accession No. |
|---|---|---|---|---|---|
| ORF7 | 413 | sucrose synthase, Moorea producens | 97%, 98% | WP_008191839.1 | |
| ORF6 | 91 | transposase, Leptolyngbya sp. PCC 7376 | 66%, 80% | WP_015134379.1 | |
| ORF5 | 51 | glycyl-tRNA synthetase subunit alpha, Streptococcus pneumoniae GA17570 | 28%, 40% | EGI82761.1 | |
| ORF4 | 384 | sucrose synthase, Moorea producens | 98%, 98% | WP_008191839.1 | |
| ORF3 | 34 | - | |||
| ORF2 | 37 | transposase, Dolichospermum circinale | 61%, 75% | WP_028082114.1 | |
| ORF1 | 33 | transposase, Nostoc flagelliforme str. Sunitezuoqi | 74%, 85% | ADO19008.1 | |
| ColA | 583 | Dodecanoyl-ACP synthetase |
PuwC, Cylindrospermum alatosporum CCALA 988 fatty acyl ACP ligase, Moorea bouillonii PNG5-198 |
63%/79% 57%/71% |
AIW82280.1 AHH34187.1 |
| ColB | 432 | unknown | HNH endonuclease, Moorea producens | 77%, 87% | WP_008186580.1 |
| ColC | 119 | ACP | short chain dehydrogenase family protein, Mycobacterium ulcerans str. Harvey | 31%/50% | EUA89990.1 |
| ColD | 463 | Halogenase | CylC, Cylindrospermum licheniforme UTEX B 2014 p-aminobenzoate N-oxygenase, Leptolyngbya sp. Heron Island J |
48%/66% 27%/47% |
AFV96137.1 ESA35271.1 |
| ColE | 471 | Halogenase | CylC, Cylindrospermum licheniforme UTEX B 2014 p-aminobenzoate N-oxygenase AurF, Oscillatoria acuminata |
47%/62% 30%, 44% |
AFV96137.1 WP_015146466.1 |
| ColF | 3712 | KS-AT-(DH)-KR-ACP-KS-AT-DH-ER-KR-ACP | CrpB, Nostoc sp. ATCC 53789 | 53%, 69% | ABM21570.1 |
| ColG | 2227 | C-A(Ser)-OMT-NMT-PCP-R | NcpB, Nostoc sp. ATCC 53789 | 51%, 66% | AAO23334.1 |
| ColH | 35 | unknown | hypothetical protein, Alicyclobacillus pohliae | 54%, 36% | WP_018133539.1 |
| ColI | 459 | Acyltransferase | Acyltransferase, Mycobacterium tuberculosis | 16%, 32% | WP_031725540.1 |
| ORF1′ | 723 | choloylglycine hydrolase-like protein, Lyngbya majuscula | 73%, 83% | AAS98791.1 | |
| ORF2′ | 41 | hypothetical protein, Lyngbya majuscula | 91%, 91% | AAS98793.1 | |
| ORF3′ | 33 | hypothetical protein, Gloeocapsa sp. PCC 73106] | 81%, 93% | WP_006530731.1 | |
| ORF4′ | 49 | hypothetical protein, Moorea producens | 97%, 96% | WP_008191272.1 | |
| ORF5′ | 355 | tRNA 2-selenouridine synthase, Moorea producens | 96%, 97% | WP_008191777.1 | |
| ORF6′ | 31 | hypothetical protein, Moorea producens | 84%, 84% | WP_008180717.1 | |
| ORF7′ | 1169 | Regulatory enzyme | guanylate cyclase, Moorea producens | 94%, 96% | WP_008191774.1 |
| ORF8′ | 220 | putative exosortase, PEP-CTERM interaction domain protein, Moorea producens | 80%, 88% | WP_008189692.1 | |
| ORF9′ | 269 | putative peptidoglycan-binding domain-containing protein, Moorea producens | 97%, 98% | WP_008189690.1 | |
| ORF10′ | 424 | zinc protease, Desulfotomaculum alkaliphilum | 26%, 47% | WP_031514442.1 | |
| ORF11′ | 428 | peptidase M16, Moorea producens | 97%, 98% | WP_008189686.1 |
Figure 3.

Proposed biosynthetic pathway of the columbamides in M. bouillonii PNG. AS: acyl synthetase, ACP: acyl carrier protein, Hal: halogenase, KS: β-ketoacyl-ACP synthase; AT: acyl transferase, DH: β-hydroxy-acyl-ACP dehydratase, KR: β-ketoacyl-ACP reductase, ER: enoyl reductase, C: condensation domain, A: adenylation domain, MT: methyltransferase, PCP: peptidyl carrier protein, R: Reductase, AcylT: Acyltransferase. Using multiple bioinformatic methods, the first DH domain in ColF appears to be absent and is therefore colored in light grey. As discussed in the text, the DH domain in the second PKS module of ColF is believed to provide this biochemical property.
The next gene in the cluster, colB, encodes for a putative HNH endonuclease [77% identity to HNH-endonuclease of M. producens 3L (WP_008186580.1)]. A functional role for ColB is not apparent at this time. The next two genes colD and colE most likely encode for a new type of halogenase, although the initial BLAST-hits for these were for oxygenases. Cyanobacteria have a variety of unique genes that encode for proteins involved in the halogenation of natural products. Examples include HctB in hectochlorin biosynthesis, BarB1 and BarB2 in barbamide biosynthesis and the cryptic halogenase CurA in curacin A biosynthesis.45–47 For ColD and ColE, the BlastP search yielded weak hits to p-aminobenzoate N-oxygenases AurF (ColD: 27% identity, 47% similarity, ColE: 30% identity, 44% similarity) and to the protein CylC (ColD: 48% identity, 66% similarity, ColE: 47% identity, 62% similarity), which is potentially a cryptic halogenase involved in the carbon-carbon bond activation of cylindrocyclophane biosynthesis.48, 49 The former gene, aurF, is involved in the biosynthesis of aureothin; however, the exact functioning and mechanism of the encoded enzyme is controversial. The Hertweck group identified AurF as a di-manganese enzyme, while the Zhao group reported AurF as a non-heme di-iron monoxygenase. Finally, the Bollinger group recently reported that it catalyzes a four-electron oxidation within a di-iron cluster.50–52 The similarity in protein structure of ColD and ColE to AurF suggests that the halogenation mechanism at an unactivated center on an alkyl chain might be similar to the oxidation of aminoarenes to nitroarenes. Consistent with this deduction, the cylC gene product is likely involved in the carbon-carbon bond activation of cylindrocyclophane, possibly through a cryptic chlorination event.48, 49 Ultimately, through isolation of the encoded compounds 1–3, it was deduced that one putative halogenase introduces either one or two chlorine atoms at the terminal end of the alkyl chain whereas the other introduces a chlorine atom at the ω-7 position of the fatty acid chain. Clearly, halogenation of these positions involves a highly unusual C-H bond activation and clearly warrants future investigation.
The next gene in the cluster, colF, matches to a bimodular PKS motif. The protein sequence shows 53% similarity to CrpB, responsible for cryptophycin biosynthesis in Nostoc sp. ATCC 53789.53 In this biosynthetic sequence, the acyl ACP is extended by two rounds of ketide extension by the two PKS modules found in ColF. Bioinformatics analysis in concert with the elucidated structure indicated the presence of the following domain structure: KS-AT-(DH)-KR-ACP-KS-AT-DH-ER-KR-ACP. Based on the structure of the isolated compound, the first polyketide module should contain a dehydratase domain. However, using common bioinformatics tools such as Delta BlastP, AntiSMASH and 2metDB, a dehydratase domain was not detectable.27, 54, 55 Interestingly, the curacin A pathway also has expected DH domains in each of the CurG, CurH, CurI, CurJ and CurK proteins, but only three functional DH domains were evident.23, 56 It is believed that these functional DH domains provide the required biochemical activity for those modules in which the domain is absent; however, to date the mechanism behind this presumed multiple use of DH domains remains unknown.
Next, the NRPS module (ColG) extends the acyl ACP by an amino acid. Based on the Stachelhaus predictions, the amino acid residues in the substrate-binding pocket of the A-domain are consistent with those encoding for the amino acid serine (Supporting Information Table S1).57, 58 The absence of an epimerase domain suggests that L-serine is incorporated into the molecule; this configuration was confirmed through subsequent hydrolysis and Marfey’s analysis (Figure S10). Using the Delta BlastP function of the NCBI, two methyltransferase domains were identified and subsequent structure elucidation confirmed the presence of one O-methyl and one N-methyl group. The sequences of the ColG methyltransferases were compared to known O- and N-methyltransferases (see Supporting Information for multiple sequence alignments Table S2 and Table S3). The N-methyltransferase domain of ColG shares an 80% identity to the N-methyltransferase domain of BarG. By contrast, the O-methyltransferase domain of ColG does not share a high sequence homology to any known O-methyltransferase, perhaps due to its unique positioning with an NRPS module. This is the first report for such an arrangement.59 Lastly, the peptidyl carrier protein (PCP) bound product is released by a reductase-releasing mechanism, presumably as a primary alcohol. The reductase domain shows a 48% identity and 66% similarity to the LtxA release domain of the lyngbyatoxin biosynthetic gene cluster, a terminating domain which has been demonstrated to catalyze an NADPH-dependent reductive cleavage to form a primary alcohol.60 ColH encodes for a small hypothetical protein (35 amino acids), whose function is not clear at this time. In a final post-modular assembly step, ColI, a predicted acyltransferase, is thought to acetylate the primary alcohol to form columbamides A (1) and B (2).
Structure Elucidation of Columbamides
Cultured M. bouillonii PNG biomass was repetitively extracted with CH2Cl2/MeOH (2:1, v:v) and fractionated using normal phase vacuum liquid chromatography (NP VLC). A fraction containing a relatively abundant series of lipid metabolites containing multiple halogen atoms was further purified using a reversed-phase C18-column followed by preparative HPLC purification. The structure elucidation of columbamide A was accomplished using an integrated approach that made use of traditional analytical data as well as bioinformatics from the gene cluster. For example, the molecular formula was determined considering the HRMS data, the isotopic pattern of the parent ion, and information deduced from the biosynthetic pathway. According to the latter, the formula should contain halogen atoms, one nitrogen atom, four oxygen atoms, two methyl groups and a fatty acid chain. Using this information, the three molecular formulas were determined as C23H41Cl2NO4 for columbamide A (1), C23H40Cl3NO4 for columbamide B (2) and C21H39Cl2NO3 for columbamide C (3).
The planar structures of each of the three analogues were deduced from 1D and 2D NMR data. (Supporting Information, Figures S1–S9, S11–S21). The major metabolite, columbamide A (1), possessed an N-methyl amide as revealed from a three proton singlet (distributed between δH 2.95 and δH 2.82 due to two rotamers around the CO-N-bond61) that showed an HMBC correlation to the amide carbonyl carbon at δC 173.5. This carbon was connected by HMBC to a distinctive spin system comprised of two methylenes (δH 4.26/4.20, δH 3.58/3.48) that bordered either side of a deshielded methine (δH 4.90/4.27). An O-methyl group, appearing as a three-proton singlet at δH 3.32/3.34, was attached to the more shielded of these two methylene groups, according to HMBC data. An acetoxy group was attached to the second methylene group (δH 4.26/4.20) as revealed by HMBC correlations from both a three-proton singlet at δH 2.04/2.05 and the deshielded methylene protons to an acetoxy carbonyl at δC 170.9. Location of this functionalized serinol fragment distal to the amide carbonyl was confirmed by HMBC correlations from H-18 to C-1 and H3-17 to both C-1 and C-18 (Table 4, Figure 4).
Table 4.
1H and 13C NMR Spectroscopic Data for Columbamides A (1), B (2) and C (3) in CDCl3 at 600 MHz for 1H and 150 MHz for 13C (* overlapping signals, chemical shift values in parentheses are those resulting from minor conformer).
| Columbamide A (1) | Columbamide B (2) | Columbamide C (3) | |||||||
|---|---|---|---|---|---|---|---|---|---|
|
| |||||||||
| # | δC, type | δH (J [Hz]) | HMBC | δC | δH (J [Hz]) | HMBC | δC | δH (J [Hz]) | HMBC |
| 1 | 173.5, C | 173.1 | - | 174.2 | |||||
| 2 | 34.2, CH2 | 2.40, m | 1, 3, 4 | 33.9 | 2.40, m | 1, 3, 4 | 34.2 | 2.41, m | 1, 3, 4 |
| 3 | 28.6, CH2 | 2.32, m | 2, 4, 5 | 28.0 | 2.32, m | 4, 5 | 28.0 | 2.33, m | 2, 4, 5 |
| 4 | 129.3, CH | 5.45, m | 3, 6, 4, 5 | 129.3 | 5.45, m | 6 | 129.0 | 5.46, m | 3, 4, 5, 6 |
| 5 | 131.1, CH | 5.45, m | 3, 4, 5 6 | 131.1 | 5.45, m | 6 | 131.0 | 5.46, m | 3, 4, 5, 6 |
| 6 | 32.5, CH2 | 1.99, m | 4,5,7,8 | 32.3 | 1.99, m | 4, 5, 7 | 32.0 | 1.99, m | 4, 5, 7, 8 |
| 7 | 29.1, CH2 | 1.35, m* | 5, 6, 8, 9 | 28.6 | 1.33, m | 6, 8 | 28.7 | 1.34, m | 5, 6, 9 |
| 8 | 26.2, CH2 | 1.35, m* | 7, 9, 10 | 25.9 | 1.42, m | 9 | 26.0 | 1.39, m | 6, 7,9, 10 |
| 9 | 38.5, CH2 | 1.70, h (8.9, 7.7) | 7, 8, 10 | 38.5 | 1.71, m | 8, 10, 11 | 38.3 | 1.70, tp (10.5, 5.5, 4.3) | 7, 8, 10, 11 |
| 10 | 64.3, CH | 3.88, ddd (12.8, 8.1, 4.9) | 8, 9, 11, 12 | 63.9 | 3.88, ddd (12.8, 8.1, 5.0) | 8, 9, 11, 12 | 64.1 | 3.88, tt (8.2, 4.9) | 8, 9, 11, 12 |
| 11 | 38.5, CH2 | 1.70, h (8.9, 7.7) | 9, 10, 12 | 38.5 | 1.71, dtd (12.1, 8.8, 8.1, 4.1) | 9, 10, 12 | 38.3 | 1.70, tp (10.5, 5.5, 4.3) | 8, 9, 10, 12, 13 |
| 12 | 26.5, CH2 | 1.53, td (9.1, 5.0) | 10, 11, 13, 14 | 25.9 | 1.43, m | 11 | 26.0 | 1.54, ddt (23.2, 13.1, 6.1) | 10, 11, 14 |
| 13 | 28.2, CH2 | 1.35, m* | 11, 12, 13, 14,15 | 28.6 | 1.33, m | 12, 14 | 28.6 | 1.33, m | 11, 12, 14, 15 |
| 14 | 26.9, CH2 | 1.45, dq (13.5, 6.7) | 12, 13,15,16 | 25.8 | 1.55, m | 12, 13, 15, 16 | 26.4 | 1.45, dq (13.0, 6.6, 5.9) | 12, 13, 15, 16 |
| 15 | 32.6, CH2 | 1.78, p (6.9) | 13,14,16 | 43.5 | 2.2, m | 13, 14, 16 | 32.4 | 1.78, p (6.9) | 13, 14, 16 |
| 16 | 45.2, CH | 3.53, t (6.7) | 14, 15 | 73.5 | 5.75, t (6.0) | 14 | 45.0 | 3.54, t (6.7) | 14, 15 |
| 17 | 31.9 (27.6), CH3 | 2.95, s (2.82, s) | 1, 18 1, 18 |
31.6 (27.3) | 2.96, s (2.82, s) | 1, 18 | 33.8 (27.4) | 3.02, s (2.84, s) | 1, 18 |
| 18 | 52.1 (55.3), CH | 4.90, tt (6.8, 6.8) (4.27, m) | 1, 17,19, 20 | 51.9 (55.1) | 4.90, tt (5.5, 5.5) (4.27, m) | 57.8 (57.8) | 4.38, tt (5.2,5.2) (4.13, tt (6.3, 6.3)) | 1, 17, 19, 20 | |
| 19 | 71.1, CH2 | 3.58, dd (10.3, 6.9) 3.48, dd (10.4, 5.3) |
18, 20, 23 | 70.9 70.8 70.7 |
3.58, dd (10.3, 6.8) 3.49, dd (10.3, 5.1) |
18, 20, 23 | 70.9 | 3.57, dd (10.3, 4.9) 3.67, dd (10.2, 7.4) |
18, 20, 19 |
| 20 | 62.2, CH2 | 4.26, dd (11.5, 7.9) 4.20, dd (11.9, 4.8) |
1, 18, 19, 21 | 61.9 | 4.27, dd (11.5, 7.9) 4.20, dd (11.8, 4.9) |
18, 19, 21 | 62.3 | 3.79, d (3.9) 3.76, m |
18, 19 |
| 21 | 170.9, C | - | 170.6 | - | - | - | - | ||
| 22 | 21.0, CH3 | 2.04, s 2.05, s |
21 | 20.7 | 2.04, s 2.05, s |
21 | - | - | |
| 23 | 59.1, CH3 | 3.32, s 3.34, s |
19 | 59.0 | 3.32, s 3.34, s |
19 | 59.1 (59.1) | 3.34, s (3.35, s) | 19 |
Figure 4.

Selected 2D-NMR data for columbamide A.
A 1,2-disubstituted alkene was evident from the two nearly identical alkene protons at δH 5.45 connected by HSQC to carbons with chemical shifts of δC 129.3 and 131.1. These protons showed COSY-correlations to allylic methylene protons at δH 2.32 and 1.99. The former of these allylic protons was located adjacent to the C-2 protons at δH 2.40 by HMBC, thereby placing the olefin at C-4/C-5. The E-geometry of the double bond was indicated by characteristic 1H and 13C NMR chemical shifts for isolated olefins in alkyl chains (e.g. methyl elaidate and methyl oleate).62 This was confirmed by measurement of the 3JHH coupling constant (14 Hz) between the two olefinic protons from the 13C satellites observed in the HSQC spectrum (Figure S22).63
One chlorine atom was located attached to a terminal methylene group at δH 3.53 (δC 45.2, C-16), and by its appearance as a triplet, indicated an adjacent second methylene group at δH 1.78 (δC 32.6, C-15). This latter methylene showed a COSY correlation to yet another methylene group at δH 1.45 (δC 26.9, C-14). An H2BC NMR experiment, providing correlations between protons and carbons specifically separated by two bonds, defined the methylene at δH 1.45 to be adjacent to a methylene carbon at δC 28.2 with associated protons at δH 1.35 (C-13).64 H2BC data further placed this δC 28.2 carbon adjacent to a methylene at δH 1.53 (δC 26.5, C-12). By COSY, this methylene was adjacent to yet another CH2 group at δH 1.70 (δC 38.5, C-11). Finally, this latter resonance was located by COSY and HMBC next to the second site of chlorination (C-10) with a characteristic methine resonance at δH 3.88 (δC 64.3).
Confirmation that the second chlorine atom resided at the ω-7 position was obtained by locating this functional group at the C-10 position relative to the carboxylate of a hexadecenoic acid derivative. Despite overlap in both the proton and carbon dimensions between the methylenes to either side of C-10, an HMBC from the α-chloro methine proton to a carbon resonance at δc 26.2 allowed connectivity to the upstream portion of the carbon chain. This connectivity of C-10 to C-9 to C-8 could also be established from two sequential H2BC correlations (Figure 4 and Table 4). H2BC correlations from H2-8 (δH 1.35) to C-7 (δC 29.1) were reinforced by HMBC correlations from H2-9 to C-7. By COSY as well as H2BC, the C-7 methylene could be placed adjacent to the somewhat deshielded allylic methylene at δH 1.99 (H2-6). As this methylene was already assigned in relationship to the carboxylate terminus, an (E)-10,16-dichlorohexadec-4-enoate residue was defined.
The only difference between columbamides A (1) and B (2) was the presence of an additional chlorine atom. The location of this addition was indicated by the triplet proton at δH 5.75 with its associated carbon shift of δC 73.5 ppm, indicative of a terminal gem-dichloro functionality. Indeed, these bands replaced those of the terminal chloro-methylene group in columbamide A (1) [see Supporting Information for stacked 1H- and 2D-NMR spectra (Figures S1, S11–17) and Table 4]. In addition, the adjacent methylene group (C-15) was more deshielded (δH 2.2 and δC 43.5). The other portions of the molecule were identical to columbamide A.
In similar fashion, the structure of columbamide C was easily deduced as being the same as columbamide A but lacking the acetoxy group at C-20 [see Supporting Information for stacked 1H and 2D-NMR spectra (Figures S1, S18–21) and Table 4]. The chemical shifts of the hexadecenoic acid portion of columbamide C were identical to columbamide A. The lack of the acetoxy group at C-20 resulted in a more shielded shift of the hydroxy-substituted methylene group at δH 3.79/3.76 (C-20) and the adjacent α-proton (C-18) δH 4.38/4.13.
Next, the stereocenter of the dimethylated and acetylated serinol residue was established through Marfey’s analysis. D- and L-N-methyl-O-methyl-serinol standards were synthesized according to standard protocols.65 The two standards were derivatized with Marfey’s reagent (L-FDAA) and compared to the derivatized hydrolysate of columbamide A. From the matching retention times, it was clear that this residue derived from L-serine, in accordance with the analysis of the biosynthetic pathway (Figure S10).
Biological Properties of Columbamides
The relative structural homology between the columbamides and the endogenous cannabinoid ligands, anandamide and 2-arachidonoyl glycerol, led us to evaluate the two most plentiful columbamides (1, 2) for binding properties to the cannabinoid receptors CB1 and CB2. Columbamide A and B were found to be potent ligands for the CB1 and CB2 receptor [for CB1 (± standard error): columbamide A: Ki = 0.59 ± 0.08 μM, columbamide B: Ki = 0.41 ± 0.06 μM; for CB2: columbamide A: Ki = 1.03 ± 0.12 μM, columbamide B: Ki = 0.86 ± 0.09 μM], with columbamide B being slightly more active than columbamide A. Both compounds showed almost twofold greater affinity for CB1 compared to CB2. Previous studies have reported the isolation of other cyanobacterial derived acyl amides, such as mooreamide A,31 serinolamide A and B,66, 67 grenadamide and semiplenamide A, B and G.66 All of these compounds were shown to have binding activity with the cannabinoid receptors CB1 and CB2. Comparing Ki-values, columbamide B (Ki = 0.41 μM) is slightly more active for CB1 than the previously reported marine-derived CB1 ligand mooreamide A (Ki = 0.47 μM). However, the columbamides are not as CB1 receptor selective as was mooreamide A.31 These two columbamides are the highest affinity ligands for CB1 and CB2 ever identified from marine natural products.31
CONCLUSION
Employing a combination of orthologous techniques, such as genome mining and mass spectrometric networking, led to the isolation and characterization of the structurally unique acyl amides columbamides A–C (1–3). The Global Natural Products Social Networking is an efficient tool for dereplicating known compounds as well as identifying new compound classes.41 Using the Cytoscape platform, nodes are labeled by parent mass, colored by strain, shaped by library hits and sized by number of spectra. Armed with this information, large numbers of metabolites can be easily visualized and assessed, and interesting new targets for isolation can be rapidly detected. In addition, the pie chart node application allows identification of which compounds are shared between Moorea strains and which compounds are unique to each strain.68 In the current study, we found that the majority of secondary metabolites are strain specific. Further, we came to focus on the identification of several unknown products of M. bouillonii PNG. Through molecular networking the columbamides were detected, and this information was integrated with genomic information. However, the fragmentation pattern of columbamide C, due to the lack of the acetyl group, was different from the fragmentation pattern of columbamide A and B, and therefore, columbamide C grouped into a different cluster (Figure 2). These new natural products are interesting for the concise integration of structural units, and the uniqueness of the positions of chlorination. In this regard, this pathway, along with others such as that for cylindrocyclophane,48, 49 appears to possess a novel type of halogenase distinct from the 2-oxoglutarate-dependent radical halogenases we and others previously characterized as a part of the barbamide biosynthetic pathway.28, 46 These new metabolites are biologically significant as a result of their potent inhibition of the CB1 and CB2 receptors. Comparison of the genomes from M. producens JHB and 3L led to the identification of a highly homologous serine histidine kinase sensor closely associated with major secondary metabolite biosynthetic gene clusters (jamaicamide A in JHB and curacin A in 3L, Figure 1). The concept of a “genome hot spot” for secondary metabolite production is quite intriguing, both as an aid in informatically locating new biosynthetic gene clusters as well as potentially understanding their regulation. However, whether the locus of the biosynthetic gene cluster itself plays a crucial role or if the guanylate cylase with its serine histidine kinase domain plays an important function in regulating secondary metabolite production remain unanswered.
Figure 1.

MultiGeneBlast result for the columbamide, jamaicamide A and curacin A biosynthetic gene clusters. At the 3′ end of each pathway is an open reading frame for a putative regulatory serine histidine kinase (*).
EXPERIMENTAL SECTION
General Experimental Procedures
Semipreparative HPLC were performed on a Waters 515 pump system equipped with a Waters 996 PDA. Optical rotations were measured on a Jasco P-2000 polarimeter. IR spectra were measured on a Thermo Electron Corporation Nicolet IR 100 FT-IR. 1H and 13C NMR spectra were recorded on a 600 MHz Bruker Avance III spectrometer with a 1.7 mm Bruker TXI cyroprobe. Spectra were referenced to residual CDCl3 solvent signal with resonances at δH/C 7.26/77.1.
Cyanobacteria
Moorea bouillonii PNG05-198 was collected in May 2005 by SCUBA in 3–10 m water depth where it was found growing tangled around the coral Stylophora pistillata off Pigeon Island, Papua New Guinea. M. producens 3L was originally collected near CARMABI Research Station in Curaçao, Netherlands Antilles. Moorea producens JHB 22Aug96-1 was collected in Hector’s Bay, Jamaica. Live cultures have been maintained in SW BG-11 media under laboratory conditions.
Metabolic Profiling
Each strain was grown in SW BG-11 media. After harvest, the cells were freeze-dried and extracted with (2:1, v:v) CH2Cl2/MeOH. The extraction procedure was repeated until the supernatant was colorless. After removal of the solvent, the extracts were dissolved in CH3CN. To remove compounds that would not elute from reversed-phase column material, each extract was purified using a disposable 100 mg reversed-phase C18-catridge (Bond Elut-C18 OH, 100 mg, 1 mL, Agilent Technologies). The column was conditioned with CH3CN, and then an aliquot of extract was added to the column and eluted with 4 mL CH3CN. The solvent was removed and the residue dissolved in CH3CN to give a 10 mg/mL solution. The samples were analyzed via HPLC coupled to a Thermo Finnigan LCQ Advantage Max mass spectrometer or an Agilent 6530 Accurate Mass Q-TOF MS system. The Thermo Finnigan mass spectrometer was attached to a Thermo Finnigan Surveyor Autosampler-Plus, a LC-Pump-Plus and a PDA-Plus system. ESI conditions were set to 325 °C capillary temperature, 5 kV source voltage, 69 psi sheath gas flow rate. Four scan events were set up: positive total ion count from m/z 100–2000, followed by three data-dependent MS2 scans of the first, second and third most intense ions from the first scan event. The collision energy was 35%, the minimum intensity 105 counts, isolation width m/z 2, the dynamic exclusion count of 5 with a repeat duration of 1 min and an exclusion list of 25 and an exclusion duration of 1.5 min.
The Agilent 6530 Accurate Mass Q-TOF MS system was attached to a 1290 Infinity Binary LC system (Agilent Technologies). ESI conditions were set to 300 °C capillary temperature, 3.5 kV VCap, 10 L/min gas flow. The scan events were set up as follows: positive total ion count from m/z 100–1700, followed by data-dependent MS2 scans. The collision energy was ramped with a 0.5 slope and a 30 offset, 3 precursors per cycle were fragmented with a MS Abs. threshold of 200, isolation width of m/z 1.3 and an active exclusion count of 5 with a repeat duration of 0.5 min.
The same gradient was used on both machines. The separation was performed using a Phenomenex Kinetex C-18 100 Å 100 x 4.6 mm column with a 700 μL/min flow and a linear gradient from 5% A (A: CH3CN, B: 0.1% HCOOH in H2O) for 3 min to 100% A in 45 min which was maintained for 10 min. Afterwards the column was equilibrated back to starting conditions.
The data was converted to mzXML format, a text-based format for mass spectrometry data by using MSConvert, part of the ProteoWizard package69 and uploaded to the Global Natural Products Social Molecular Networking website. The mass spectrometry data is available through MassIVE Public GNPS Datasets (MSV000079016, gnps.ucsd.edu). These data were analyzed using the molecular networking workflow.41 The input data was searched against annotated reference spectra of the MS2-library within GNPS. The GNPS MS2-library contains ITMS and QTof reference spectra of previously isolated compounds of the Gerwick laboratory.41
Computationally, the algorithms compare MS2-spectra by their similarity and assign similarity scores. The basic underlying algorithm was published in detail elsewhere.30, 40, 41, 68 For the network presented in this paper, the parent mass peak tolerance was set to 2 Da and the ion tolerance for mass fragments was set to 0.5 Da. The minimum cluster size was set to 1 and the cosine score was set to 0.7. For visualization, the created molecular networks were imported into the program Cytoscape 2.8.3.70 Each node was labeled with their respective parent mass. The edges between nodes indicated the level of similarity between nodes with thicker lines indicating higher similarity. Hits to library inputs were marked as squares. The size of the node is representative for the number of MS2-spectra present for each parent mass. To visualize which compounds are shared between the three Moorea strains, the pie-chart creating tool (nodeCharts plugin for Cytoscape) was used.68 Pie slices are proportional to number of MS2 spectra for each parent mass and are therefore a proxy for its relative quantity. To simplify the network, nodes created by solvent background were removed from the network.
Isolation of Genomic DNA
Genomic DNA was isolated from live cultures of Moorea producens JHB and Moorea bouillonii PNG using a standard phenol: chloroform: isoamyl alcohol (PCI) extraction protocol. In brief, two grams (wet weight) of cultured biomass were rinsed with fresh SW BG-11 media and flash frozen in liquid nitrogen and ground to a fine powder using a pre-chilled mortar and pestle. The powder was resuspended in 10 volumes of lysis buffer (10 mM Tris pH 8, 0.1 M EDTA pH 8, 0.5% w/v SDS and 20 μg/mL RNase) and incubated at 37 °C for 30 min. Proteinase K was added (100 μg/mL final concentration) and samples were incubated at 50 °C for 1 h. After cooling the samples to room temperature (rt), one volume of equilibrated phenol (Life Technologies) was added and samples were mixed for 10 min. Phases were separated by centrifugation at 3,300 rcf for 10 min, and the aqueous phase was removed to a new tube. The phenol extraction was repeated twice followed by a chloroform: isoamyl alcohol (24:1) (Life Technologies) extraction. DNA was precipitated and purified by ethanol precipitation. Genomic DNA was quantified using a NanoDrop (Thermo Scientific) and qualified by gel electrophoresis. Genomic DNA was sequenced at the genomics core facility at the University of Michigan using Illumina HiSeq and at the University of California San Diego genomics facility using PACBIO (M. bouillonii PNG). Assembly was done using the SPAdes Genome Assember 3.0 followed by Opera to produce cyanobacterial scaffolds.32 Further binning was performed to obtain cyanobacterial – specific scaffolds.
Bioinformatics Analysis
Biosynthetic gene clusters were identified using the genome mining software programs AntiSMASH, NaPDoS and met2db.27, 37, 54 NRPS adenylation domain substrate predictions were made using NRPSpredictor2.71 Annotations were refined using Delta BlastP to identify conserved domains.55 Phylogenetic analysis was performed by comparing the N- and O-methyltransferase domains using the web-based tool at www.phylogeny.fr. Sequences of methyltransferases were obtained from SBSPKS.72 The nucleotide sequence of the columbamide pathway genes has been submitted to GenBank under the accession number KP715425.
Structure Elucidation
About 5.5 g (wet weight) of M. bouillonii PNG were repetitively extracted with CH2Cl2/MeOH (2:1, v:v) yielding 389 mg of extract. Subsequently the extract was fractionated by silica gel vacuum liquid chromatography (VLC) using a stepwise gradient solvent system of increasing polarity beginning from 100% hexanes to 100% EtOAc to 100% MeOH yielding nine sub-fractions. The fraction eluting with 40% EtOAc and 60% hexanes (fraction D, 3.8 mg) was separated further using a 100 mg reversed-phase C18 solid phase extraction cartridge (Bond Elut-C18 OH, 100 mg, 1 mL, Agilent Technologies) and a stepwise gradient solvent system of 25%, 50%, 75%, 100% CH3CN/H2O, respectively. The 75% eluting fraction was further purified using reversed-phase HPLC: Phenomenex Kinetex C-18 100 Å 100 x 10 mm column with a 4 mL/min flow and a linear gradient from 75% A (A: CH3CN, B: H2O) for 3 min to 95% A in 24 min. Afterwards, the column was equilibrated back to starting conditions. The yield of columbamide A was 2 mg, columbamide B 1 mg and columbamide C 0.5 mg.
Columbamide A (1)
[α]D23 −11.3 (c 0.27, CHCl3); IR (neat) νmax 2927, 2856, 1621, 1452, 1124, 1089, 1046 cm−1; 1H and 13C NMR, Table 4 and Supporting Information; HRESIMS m/z 466.2478 [M+H]+ (calcd for C23H42O4NCl2, 466.2485); MS/MS (CID 32.3%; [M+H]+) m/z (%): 370 (100), 398 (30), 334 (27), 102 (14), 362 (6).
Columbamide B (2)
[α]D 23 8.7 (c 0.77, CHCl3); IR (neat) νmax 2928, 2853, 1627, 1467 cm−1; 1H and 13C NMR, Table 4 and Supporting Information; HRESIMS m/z 500.2087 [M+H]+ (calcd mass for C23H41O4NCl3, 500.2096); MS/MS (CID 32.5%; [M+H]+) m/z (%): 404 (100), 368 (99), 432 (35), 396 (30), 102 (17), 162 (7).
Columbamide C (3)
[α]D 23 −27.5 (c 0.2, CHCl3); IR (neat) νmax 3401, 2931, 2859, 1627, 1465, 1124 cm−1; 1H and 13C NMR, Table 4 and Supporting Information; HRESIMS m/z 424.2377 [M+H]+ (calcd mass for C21H40O3NCl2, 424.2380); MS/MS (CID 32.1%; [M+H]+) m/z (%): 356 (100), 320 (46), 370 (17), 120 (4).
Marfey’s Analysis of Columbamide A and Synthesis of Standards
To a solution of columbamide A (1) (0.4 mg) in MeOH (100 μL) was added 9N HCl (200 μL) and the reaction stirred in microwave reactor at 140 °C. After 20 min the reaction was quenched by 200 μL of saturated sodium bicarbonate solution, followed by addition of 45 μL of L-FDAA (0.5% solution in acetone). The solution was heated at 40 °C for 60 min then quenched by addition of 150 μL of 2 N HCl. The mixture was diluted with 200 μL of CH3CN and 30 μL of the solution was analyzed by using the HPLC-ITMS described above.
The standard alcohols were synthesized according to the literature procedure.65 Esterification of O-methyl-serine (4) followed by Boc protection gave product 5 in 82% yield over two steps. Reduction of ester 5 with NaBH4 gave alcohol 6, which was protected with TBDMS to give compound 7. It was deprotected using TFA and the crude product was reacted with L-FDAA Marfey’s reagent, in the presence of excess Hunig’s base, to prepare the standards. The O-methyl-L-serine gave the R-enantiomer of alcohol 8 while the O-methyl-D-serine resulted in the S-enantiomer of compound 8. The Marfey’s derivatives L-FDAA of the hydrolysate and standards were analyzed with HPLC-ITMS by using a Phenomenex Luna 5 μm C18 column (4.6 x 250 mm). The HPLC conditions started with 10 % CH3CN and 90% HCOOH (0.1%) in H2O followed by a gradual increase to 50% CH3CN and 50% HCOOH in H2O (0.1%) over 100 min at a flow rate of 0.4 mL/min with monitoring the total ion count from 100–2000 m/z. The retention time for the L-FDAA derivative of the S-alcohol was 72.4 min, while it was 64.3 min for the R-alcohol. The retention time of the L-FDAA derivative of the hydrolysate product gave a peak with retention time of 64.7 min, corresponding to the R-alcohol from the L-serine.
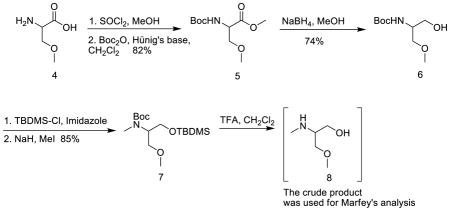
Synthesis of methyl 2-(tert-butoxycarbonylamino)-3-methoxypropanoate (5)
To a solution of D-or L-O-methyl serine (0.15 g, 1.26 mmol) in MeOH (3 mL) at 0 °C was added thionyl chloride (1 mL) dropwise. The reaction mixture was warmed to room temperature and stirred overnight. The solvent was evaporated to give a yellow solid, which was used without further purification.
A mixture of O-methyl-serine methyl ester hydrochloride salt in CH2Cl2 (7 mL) at 0 °C was added to Hünig’s base (0.66 mL, 3.78 mmol) and Boc-anhydride (275 mg, 1.26 mmol). The reaction mixture was warmed to rt and stirred overnight, after which it was diluted with CH2Cl2 (10 mL), washed with 1N HCl and brine. The combined organic layer was dried over anhydrous Na2SO4 and evaporated. It was purified by flash chromatography on silica gel in CH2Cl2/hexanes (75–100%) to give methyl 2-(tert-butoxycarbonyl)-3-methoxypropanoate 5 as yellow oil (0.23 g, 82%). 1H NMR (5,500 MHz, CDCl3) δ 5.37 (d, J = 8.5 Hz, 1H), 4.41 (dd, J = 8.2, 3.8 Hz, 1H), 3.83 – 3.77 (m, 1H), 3.76 (s, 3H), 3.59 (dd, J = 9.5, 3.5 Hz, 1H), 3.35 (s, 3H), 1.45 (s, 9H). 13C NMR (125 MHz, CDCl3): δ 171.4, 155.7, 80.1, 72.7, 59.4, 54.0, 52.6, 28.4. LRESIMS m/z 234.17 [M + H]+ (calcd for C10H20NO5 234.13).
Synthesis of tert-butyl 1-hydroxy-3-methoxypropan-2-ylcarbamate (6)
To a stirred solution of ester 5 (75 mg, 0.32 mmol) in MeOH at 0 °C was added NaBH4 in several portions. The reaction mixture was stirred at rt overnight, treated with water, and extracted with ethyl acetate. The combined organic layer was washed with brine, dried over anhydrous Na2SO4 and evaporated. The residue was purified by flash chromatography on silica gel in ethyl acetate/hexanes (10–30%) to afford 6 as a colorless oil (48 mg, 74%). 1H NMR (6, 500 MHz, CDCl3) δ 5.26 (br s, 1H), 3.77 – 3.73 (m, 2H), 3.68 – 3.64 (m, 1H), 3.56 (dd, J = 9.4, 3.8 Hz, 1H), 3.50 (dd, J = 9.5, 4.5 Hz, 1H), 3.37 (s, 3H), 1.45 (s, 9H). 13C NMR (125 MHz, CDCl3) δ 156.3, 79.8, 72.9, 63.5, 59.3, 51.6, 28.5. LRESIMS m/z 206.34 [M + H]+ (calcd for C9H20NO4 206.14).
Synthesis of tert-butyl 1-(tert-butyldimethylsilyloxy)-3-methoxypropan-2-yl(methyl)carbamate (7)
To a solution of alcohol 6 (34 mg, 0.17 mmol) in CH2Cl2 (2 mL) at 0 °C was added tert-butyldimethylsilyl chloride (26 mg, 0.17 mmol) and imidazole (13 mg, 0.19 mmol). The reaction was stirred overnight at rt, and then quenched by addition of water. The organic layer was separated, washed with 2N HCl, dried over anhydrous Na2SO4 and evaporated. The crude product was used in the next step without additional purification.
To a solution of tert-butyl 1-(tert-butyldimethylsilyloxy)-3-methoxypropan-2-ylcarbamate in THF (1 mL) was added NaH (60% dispersion in mineral oil, 22 mg, 0.47 mmol) at 0 °C. After stirring at the same temperature for 30 min, a solution of MeI (30 μL, 0.59 mmol) in DMF (30 μL) was added. The reaction mixture was warmed to rt and stirred overnight. It was quenched with H2O, and the organic layer was separated. The aqueous layer was extracted with EtOAc and the combined organic layer was dried over anhydrous Na2SO4 and concentrated. The residue was purified by flash chromatography on silica gel in CH2Cl2 to give product 7 (48 mg, 85%). [α]D22 −12.6 (c 1.0, CHCl3) for the S-enantiomer of 7 (derivative from O-methyl-L-serine). [α]D22 +10.7 (c 1.0, CHCl3) for the R-enantiomer of 7 (derivative from O-methyl-D-serine). 1H NMR (7, 500 MHz, CDCl3): δ 4.24 (br s, 1H), 3.75–3.66 (m, 2H), 3.61 – 3.57 (m, 1H), 3.53–3.47 (m, 2H), 3.33 (s, 3H), 2.84 (s, 3H), 1.46 (s, 9H), 0.89 (s, 9H), 0.15 (s, 6H). 13C NMR (125 MHz, CDCl3): δ 156.3, 79.7, 71.0, 62.1, 59.0, 57.2, 31.6, 28.8, 26.2, −5.3. LRESIMS m/z 334.18 [M + H]+ (calcd for C16H36NO4Si 334.24).
CB1 and CB2 Receptor Binding Assays
CB1 and CB2 displacements assays were performed according to previously reported protocol.73 Membranes from HEK-293 cells stably transfected with human recombinant CB1 receptor (Bmax = 2.9 pmol/mg protein) or human recombinant CB2 receptor (Bmax = 6.0 pmol/mg protein) were incubated with the high affinity ligand [3H]-CP-55,940 (0.4 nM/Kd = 0.11 nM and 0.53 nM/Kd = 0.19 nM for CB1 and CB2, respectively). The radioactive ligand was displaced with 10 μM WIN 55212-2 as the heterologous competitor to determine non-specific binding (Ki values 8.8 nM and 0.9 nM for CB1 and CB2, respectively). The compounds were tested according to the protocol described by the manufacturer (Perkin Elmer). Displacement curves were obtained by incubating columbamides A and B with [3H]-CP-55,940, for 90 min at 30 °C. Ki values were calculated by applying the Cheng-Prusoff equation to the IC50 values obtained from GraphPad for the displacement of the bound radioligand by increasing concentrations of the test compounds. Data are means of at least three replicates.
Supplementary Material
Acknowledgments
Karin Kleigrewe was supported by a fellowship within the Postdoc-Programme of the German Academic Exchange Service (DAAD); Robin Kinnel was supported by the Hamilton College; Anton Korobeynikov was supported in part by the Russian Science Foundation (grant 14-50-069). This work was supported from NIH-R01 GM107550 and NIH CA108874.
Footnotes
Stachelhaus prediction, multiple sequence alignments of methyltransferases, NMR data and Marfey’s analysis chromatograms. This material is available free of charge via the Internet at http://pubs.acs.org.
References
- 1.Gerwick WH, Moore BS. Chem Biol. 2011;19:85–98. doi: 10.1016/j.chembiol.2011.12.014. [DOI] [PMC free article] [PubMed] [Google Scholar]
- 2.Corre C, Challis GL. Nat Prod Rep. 2009;26:977–986. doi: 10.1039/b713024b. [DOI] [PubMed] [Google Scholar]
- 3.Müller R, Wink J. Int J Med Microbiol. 2014;304:3–13. doi: 10.1016/j.ijmm.2013.09.004. [DOI] [PubMed] [Google Scholar]
- 4.Nett M. Prog Chem Org Nat Prod. 2014;99:199–245. doi: 10.1007/978-3-319-04900-7_4. [DOI] [PubMed] [Google Scholar]
- 5.Micallef ML, D’Agostino PM, Al-Sinawi B, Neilan BA, Moffitt MC. Mar Genomics. 2014;21:1–12. doi: 10.1016/j.margen.2014.11.009. [DOI] [PubMed] [Google Scholar]
- 6.Medema MH, Paalvast Y, Nguyen DD, Melnik A, Dorrestein PC, Takano E, Breitling R. PLoS Comput Biol. 2014;10 doi: 10.1371/journal.pcbi.1003822. [DOI] [PMC free article] [PubMed] [Google Scholar]
- 7.Kersten RD, Yang YL, Xu Y, Cimermancic P, Nam SJ, Fenical W, Fischbach MA, Moore BS, Dorrestein PC. Nat Chem Biol. 2011;7:794–802. doi: 10.1038/nchembio.684. [DOI] [PMC free article] [PubMed] [Google Scholar]
- 8.Engene N, Rottacker EC, Kastovsky J, Byrum T, Choi H, Ellisman MH, Komarek J, Gerwick WH. Int J Syst Evol Microbiol. 2012;62:1171–8. doi: 10.1099/ijs.0.033761-0. [DOI] [PMC free article] [PubMed] [Google Scholar]
- 9.Engene N, Gunasekera SP, Gerwick WH, Paul VJ. Appl Environ Microbiol. 2013;79:1882–1888. doi: 10.1128/AEM.03793-12. [DOI] [PMC free article] [PubMed] [Google Scholar]
- 10.McPhail KL, Correa J, Linington RG, Gonzalez J, Ortega-Barria E, Capson TL, Gerwick WH. J Nat Prod. 2007;70:984–8. doi: 10.1021/np0700772. [DOI] [PMC free article] [PubMed] [Google Scholar]
- 11.Jones AC, Monroe EA, Podell S, Hess WR, Klages S, Esquenazi E, Niessen S, Hoover H, Rothmann M, Lasken RS, Yates JR, 3rd, Reinhardt R, Kube M, Burkart MD, Allen EE, Dorrestein PC, Gerwick WH, Gerwick L. Proc Natl Acad Sci USA. 2011;108:8815–20. doi: 10.1073/pnas.1101137108. [DOI] [PMC free article] [PubMed] [Google Scholar]
- 12.Gerwick WH, Proteau PJ, Nagle DG, Hamel E, Blokhin A, Slate DL. J Org Chem. 1994;59:1243–1245. [Google Scholar]
- 13.Chang Z, Flatt P, Gerwick WH, Nguyen VA, Willis CL, Sherman DH. Gene. 2002;296:235–47. doi: 10.1016/s0378-1119(02)00860-0. [DOI] [PubMed] [Google Scholar]
- 14.Edwards DJ, Marquez BL, Nogle LM, McPhail K, Goeger DE, Roberts MA, Gerwick WH. Chem Biol. 2004;11:817–33. doi: 10.1016/j.chembiol.2004.03.030. [DOI] [PubMed] [Google Scholar]
- 15.Marquez BL, Watts KS, Yokochi A, Roberts MA, Verdier-Pinard P, Jimenez JI, Hamel E, Scheuer PJ, Gerwick WH. J Nat Prod. 2002;65:866–71. doi: 10.1021/np0106283. [DOI] [PubMed] [Google Scholar]
- 16.Grindberg RV, Ishoey T, Brinza D, Esquenazi E, Coates RC, Liu WT, Gerwick L, Dorrestein PC, Pevzner P, Lasken R, Gerwick WH. PLoS One. 2011;6:e18565. doi: 10.1371/journal.pone.0018565. [DOI] [PMC free article] [PubMed] [Google Scholar]
- 17.Luesch H, Yoshida WY, Moore RE, Paul VJ, Mooberry SL. J Nat Prod. 2000;63:611–615. doi: 10.1021/np990543q. [DOI] [PubMed] [Google Scholar]
- 18.Coates RC, Podell S, Korobeynikov A, Lapidus A, Pevzner P, Sherman DH, Allen EE, Gerwick L, Gerwick WH. PLoS One. 2014;9:e85140. doi: 10.1371/journal.pone.0085140. [DOI] [PMC free article] [PubMed] [Google Scholar]
- 19.Orjala J, Gerwick WH. J Nat Prod. 1996;59:427–30. doi: 10.1021/np960085a. [DOI] [PubMed] [Google Scholar]
- 20.Sitachitta N, Marquez BL, Williamson RT, Rossi J, Roberts MA, Gerwick WH, Nguyen VA, Willis CL. Tetrahedron. 2000;56:9103–9113. [Google Scholar]
- 21.Hooper GJ, Orjala J, Schatzman RC, Gerwick WH. J Nat Prod. 1998;61:529–33. doi: 10.1021/np970443p. [DOI] [PubMed] [Google Scholar]
- 22.Esquenazi E, Coates C, Simmons L, Gonzalez D, Gerwick WH, Dorrestein PC. Mol Biosyst. 2008;4:562–70. doi: 10.1039/b720018h. [DOI] [PMC free article] [PubMed] [Google Scholar]
- 23.Chang Z, Sitachitta N, Rossi JV, Roberts MA, Flatt PM, Jia J, Sherman DH, Gerwick WH. J Nat Prod. 2004;67:1356–67. doi: 10.1021/np0499261. [DOI] [PubMed] [Google Scholar]
- 24.Ramaswamy AV, Sorrels CM, Gerwick WH. J Nat Prod. 2007;70:1977–86. doi: 10.1021/np0704250. [DOI] [PubMed] [Google Scholar]
- 25.Luesch H, Yoshida WY, Moore RE, Paul VJ, Corbett TH. J Am Chem Soc. 2001;123:5418–23. doi: 10.1021/ja010453j. [DOI] [PubMed] [Google Scholar]
- 26.Calteau A, Fewer DP, Latifi A, Coursin T, Laurent T, Jokela J, Kerfeld CA, Sivonen K, Piel J, Gugger M. BMC Genomics. 2014;15:977. doi: 10.1186/1471-2164-15-977. [DOI] [PMC free article] [PubMed] [Google Scholar]
- 27.Blin K, Medema MH, Kazempour D, Fischbach MA, Breitling R, Takano E, Weber T. Nucleic Acids Res. 2013;41:W204–W212. doi: 10.1093/nar/gkt449. [DOI] [PMC free article] [PubMed] [Google Scholar]
- 28.Flatt PM, O’Connell SJ, McPhail KL, Zeller G, Willis CL, Sherman DH, Gerwick WH. J Nat Prod. 2006;69:938–44. doi: 10.1021/np050523q. [DOI] [PubMed] [Google Scholar]
- 29.Gu L, Wang B, Kulkarni A, Gehret JJ, Lloyd KR, Gerwick L, Gerwick WH, Wipf P, Hakansson K, Smith JL, Sherman DH. J Am Chem Soc. 2009;131:16033–5. doi: 10.1021/ja9071578. [DOI] [PMC free article] [PubMed] [Google Scholar]
- 30.Watrous J, Roach P, Alexandrov T, Heath BS, Yang JY, Kersten RD, van der Voort M, Pogliano K, Gross H, Raaijmakers JM, Moore BS, Laskin J, Bandeira N, Dorrestein PC. Proc Natl Acad Sci USA. 2012;109:E1743–52. doi: 10.1073/pnas.1203689109. [DOI] [PMC free article] [PubMed] [Google Scholar]
- 31.Mevers E, Matainaho T, Allara’ M, Di Marzo V, Gerwick W. Lipids. 2014;49:1127–1132. doi: 10.1007/s11745-014-3949-9. [DOI] [PubMed] [Google Scholar]
- 32.Bankevich A, Nurk S, Antipov D, Gurevich AA, Dvorkin M, Kulikov AS, Lesin VM, Nikolenko SI, Pham S, Prjibelski AD, Pyshkin AV, Sirotkin AV, Vyahhi N, Tesler G, Alekseyev MA, Pevzner PA. J Comput Biol. 2012;19:455–77. doi: 10.1089/cmb.2012.0021. [DOI] [PMC free article] [PubMed] [Google Scholar]
- 33.Nurk S, Bankevich A, Antipov D, Gurevich AA, Korobeynikov A, Lapidus A, Prjibelski AD, Pyshkin A, Sirotkin A, Sirotkin Y, Stepanauskas R, Clingenpeel SR, Woyke T, McLean JS, Lasken R, Tesler G, Alekseyev MA, Pevzner PA. J Comput Biol. 2013;20:714–37. doi: 10.1089/cmb.2013.0084. [DOI] [PMC free article] [PubMed] [Google Scholar]
- 34.Nikolenko SI, Korobeynikov AI, Alekseyev MA. BMC Genomics. 2013;14:1471–2164. doi: 10.1186/1471-2164-14-S1-S7. [DOI] [PMC free article] [PubMed] [Google Scholar]
- 35.Gurevich A, Saveliev V, Vyahhi N, Tesler G. Bioinformatics. 2013;29:1072–5. doi: 10.1093/bioinformatics/btt086. [DOI] [PMC free article] [PubMed] [Google Scholar]
- 36.Medema MH, Blin K, Cimermancic P, de Jager V, Zakrzewski P, Fischbach MA, Weber T, Takano E, Breitling R. Nucleic Acids Res. 2011;39:W339–46. doi: 10.1093/nar/gkr466. [DOI] [PMC free article] [PubMed] [Google Scholar]
- 37.Ziemert N, Podell S, Penn K, Badger JH, Allen E, Jensen PR. PLoS One. 2012;7:29. doi: 10.1371/journal.pone.0034064. [DOI] [PMC free article] [PubMed] [Google Scholar]
- 38.Katayama M, Ohmori M. J Bacteriol. 1997;179:3588–93. doi: 10.1128/jb.179.11.3588-3593.1997. [DOI] [PMC free article] [PubMed] [Google Scholar]
- 39.Medema MH, Takano E, Breitling R. Mol Biol Evol. 2013;30:1218–23. doi: 10.1093/molbev/mst025. [DOI] [PMC free article] [PubMed] [Google Scholar]
- 40.Nguyen DD, Wu CH, Moree WJ, Lamsa A, Medema MH, Zhao X, Gavilan RG, Aparicio M, Atencio L, Jackson C, Ballesteros J, Sanchez J, Watrous JD, Phelan VV, van de Wiel C, Kersten RD, Mehnaz S, De Mot R, Shank EA, Charusanti P, Nagarajan H, Duggan BM, Moore BS, Bandeira N, Palsson BO, Pogliano K, Gutierrez M, Dorrestein PC. Proc Natl Acad Sci USA. 2013;110:24. doi: 10.1073/pnas.1303471110. [DOI] [PMC free article] [PubMed] [Google Scholar]
- 41.Yang JY, Sanchez LM, Rath CM, Liu X, Boudreau PD, Bruns N, Glukhov E, Wodtke A, de Felicio R, Fenner A, Wong WR, Linington RG, Zhang L, Debonsi HM, Gerwick WH, Dorrestein PC. J Nat Prod. 2013;76:1686–99. doi: 10.1021/np400413s. [DOI] [PMC free article] [PubMed] [Google Scholar]
- 42.Moffitt MC, Neilan BA. Appl Environ Microbiol. 2004;70:6353–6362. doi: 10.1128/AEM.70.11.6353-6362.2004. [DOI] [PMC free article] [PubMed] [Google Scholar]
- 43.Kidwell MG, Lisch DR. Evolution. 2001;55:1–24. doi: 10.1111/j.0014-3820.2001.tb01268.x. [DOI] [PubMed] [Google Scholar]
- 44.Mareš J, Hájek J, Urajová P, Kopecky J, Hrouzek P. PLoS One. 2014;9:e111904. doi: 10.1371/journal.pone.0111904. [DOI] [PMC free article] [PubMed] [Google Scholar]
- 45.Pratter SM, Ivkovic J, Birner-Gruenberger R, Breinbauer R, Zangger K, Straganz GD. ChemBioChem. 2014;15:567–574. doi: 10.1002/cbic.201300345. [DOI] [PubMed] [Google Scholar]
- 46.Galonic DP, Vaillancourt FH, Walsh CT. J Am Chem Soc. 2006;128:3900–1. doi: 10.1021/ja060151n. [DOI] [PubMed] [Google Scholar]
- 47.Khare D, Wang B, Gu L, Razelun J, Sherman DH, Gerwick WH, Hakansson K, Smith JL. Proc Natl Acad Sci USA. 2010;107:14099–104. doi: 10.1073/pnas.1006738107. [DOI] [PMC free article] [PubMed] [Google Scholar]
- 48.Nakamura H, Hamer HA, Sirasani G, Balskus EP. J Am Chem Soc. 2012;134:18518–18521. doi: 10.1021/ja308318p. [DOI] [PMC free article] [PubMed] [Google Scholar]
- 49.Nakamura H, Balskus EP. Synlett. 2013;24:1464–1470. doi: 10.1055/s-0033-1338879. [DOI] [PMC free article] [PubMed] [Google Scholar]
- 50.Li N, Korboukh VK, Krebs C, Bollinger JM., Jr Proc Natl Acad Sci USA. 2010;107:15722–7. doi: 10.1073/pnas.1002785107. [DOI] [PMC free article] [PubMed] [Google Scholar]
- 51.Choi YS, Zhang H, Brunzelle JS, Nair SK, Zhao H. Proc Natl Acad Sci USA. 2008;105:6858–63. doi: 10.1073/pnas.0712073105. [DOI] [PMC free article] [PubMed] [Google Scholar]
- 52.Winkler R, Richter ME, Knupfer U, Merten D, Hertweck C. Angew Chem Int Ed Engl. 2006;45:8016–8. doi: 10.1002/anie.200603060. [DOI] [PubMed] [Google Scholar]
- 53.Magarvey NA, Beck ZQ, Golakoti T, Ding Y, Huber U, Hemscheidt TK, Abelson D, Moore RE, Sherman DH. ACS Chem Biol. 2006;1:766–79. doi: 10.1021/cb6004307. [DOI] [PubMed] [Google Scholar]
- 54.Bachmann BO, Ravel J. Methods Enzymol. 2009;458:181–217. doi: 10.1016/S0076-6879(09)04808-3. [DOI] [PubMed] [Google Scholar]
- 55.Boratyn GM, Schaffer AA, Agarwala R, Altschul SF, Lipman DJ, Madden TL. Biol Direct. 2012;7:1745–6150. doi: 10.1186/1745-6150-7-12. [DOI] [PMC free article] [PubMed] [Google Scholar]
- 56.Akey DL, Razelun JR, Tehranisa J, Sherman DH, Gerwick WH, Smith JL. Structure. 2010;18:94–105. doi: 10.1016/j.str.2009.10.018. [DOI] [PMC free article] [PubMed] [Google Scholar]
- 57.Stachelhaus T, Mootz HD, Marahiel MA. Chem Biol. 1999;6:493–505. doi: 10.1016/S1074-5521(99)80082-9. [DOI] [PubMed] [Google Scholar]
- 58.Röttig M, Medema MH, Blin K, Weber T, Rausch C, Kohlbacher O. Nucleic Acids Res. 2011;39:W362–W367. doi: 10.1093/nar/gkr323. [DOI] [PMC free article] [PubMed] [Google Scholar]
- 59.Ansari MZ, Sharma J, Gokhale RS, Mohanty D. BMC Bioinformatics. 2008;9:454. doi: 10.1186/1471-2105-9-454. [DOI] [PMC free article] [PubMed] [Google Scholar]
- 60.Edwards DJ, Gerwick WH. J Am Chem Soc. 2004;126:11432–3. doi: 10.1021/ja047876g. [DOI] [PubMed] [Google Scholar]
- 61.Laursen JS, Engel-Andreasen J, Fristrup P, Harris P, Olsen CA. J Am Chem Soc. 2013;135:2835–2844. doi: 10.1021/ja312532x. [DOI] [PubMed] [Google Scholar]
- 62.Gunstone FD, Pollard MR, Scrimgeour CM, Vedanayagam HS. Chem Phys Lipids. 1977;18:115–129. doi: 10.1016/0009-3084(77)90031-7. [DOI] [PubMed] [Google Scholar]
- 63.Luy B, Hauser G, Kirschning A, Glaser SJ. Angew Chem Int Ed Engl. 2003;42:1300–1302. doi: 10.1002/anie.200390335. [DOI] [PubMed] [Google Scholar]
- 64.Petersen BO, Vinogradov E, Kay W, Würtz P, Nyberg NT, Duus JØ, Sørensen OW. Carbohyd Res. 2006;341:550–556. doi: 10.1016/j.carres.2005.11.020. [DOI] [PubMed] [Google Scholar]
- 65.Gao YR, Guo SH, Zhang ZX, Mao S, Zhang YL, Wang YQ. Tetrahedron Lett. 2013;54:6511–6513. [Google Scholar]
- 66.Montaser R, Paul VJ, Luesch H. ChemBioChem. 2012;13:2676–2681. doi: 10.1002/cbic.201200502. [DOI] [PMC free article] [PubMed] [Google Scholar]
- 67.Gutiérrez M, Pereira AR, Debonsi HM, Ligresti A, Di Marzo V, Gerwick WH. J Nat Prod. 2011;74:2313–2317. doi: 10.1021/np200610t. [DOI] [PMC free article] [PubMed] [Google Scholar]
- 68.Winnikoff JR, Glukhov E, Watrous J, Dorrestein PC, Gerwick WH. J Antibiot. 2014;67:105–12. doi: 10.1038/ja.2013.120. [DOI] [PMC free article] [PubMed] [Google Scholar]
- 69.Kessner D, Chambers M, Burke R, Agus D, Mallick P. Bioinformatics. 2008;24:2534–2536. doi: 10.1093/bioinformatics/btn323. [DOI] [PMC free article] [PubMed] [Google Scholar]
- 70.Smoot ME, Ono K, Ruscheinski J, Wang PL, Ideker T. Bioinformatics. 2011;27:431–432. doi: 10.1093/bioinformatics/btq675. [DOI] [PMC free article] [PubMed] [Google Scholar]
- 71.Röttig M, Medema MH, Blin K, Weber T, Rausch C, Kohlbacher O. Nucleic Acids Res. 2011;39:W362–W367. doi: 10.1093/nar/gkr323. [DOI] [PMC free article] [PubMed] [Google Scholar]
- 72.Anand S, Prasad MVR, Yadav G, Kumar N, Shehara J, Ansari MZ, Mohanty D. Nucleic Acids Res. 2010:1–10. doi: 10.1093/nar/gkq340. [DOI] [PMC free article] [PubMed] [Google Scholar]
- 73.Melck D, Bisogno T, De Petrocellis L, Chuang H, Julius D, Bifulco M, Di Marzo V. Biochem Biophys Res Commun. 1999;262:275–84. doi: 10.1006/bbrc.1999.1105. [DOI] [PubMed] [Google Scholar]
Associated Data
This section collects any data citations, data availability statements, or supplementary materials included in this article.