Abstract
Objectives
Anemia caused by nutritional deficiencies, such as iron and copper deficiencies, is a global health problem. Iron and copper deficiencies have their most profound effect on the developing fetus/infant, leading to brain development deficits and poor cognitive outcomes. Tissue iron depletion or chronic anemia can induce cellular hypoxic signaling. In mice, chronic hypoxia induces a compensatory increase in brain blood vessel outgrowth. We hypothesized that developmental anemia, due to iron or copper deficiencies, induces angiogenesis/vasculogenesis in the neonatal brain.
Methods
To test our hypothesis, three independent experiments were performed where pregnant rats were fed iron- or copper-deficient diets from gestational day 2 through mid-lactation. Effects on the neonatal brain vasculature were determined using qPCR to assess mRNA levels of angiogenesis/vasculogenesis-associated genes and GLUT1 immunohistochemistry (IHC) to assess brain blood vessel density and complexity.
Results
Iron deficiency, but not copper deficiency, increased mRNA expression of brain endothelial cell- and angiogenesis/vasculogenesis-associated genes (i.e. Glut1, Vwf, Vegfa, Ang2, Cxcl12, and Flk1) in the neonatal brain, suggesting increased cerebrovascular density. Iron deficiency also increased hippocampal and cerebral cortical blood vessel branching by 62% and 78%, respectively.
Discussion
This study demonstrates increased blood vessel complexity in the neonatal iron-deficient brain, which is likely due to elevated angiogenic/vasculogenic signaling. At least initially, this is probably an adaptive response to maintain metabolic substrate homeostasis in the developing iron-deficient brain. However, this may also contribute to long-term neurodevelopmental deficits.
Keywords: Iron deficiency, Copper deficiency, Anemia, Brain, Development, Neovasculogenesis, Angiogenesis, Blood-brain-barrier
Introduction
According to the World Health Organization, anemia, characterized by reduced blood oxygen carrying capacity, affects nearly 2 billion people worldwide.1 Approximately 50% of all anemia cases are due to iron deficiency, termed iron deficiency anemia (IDA). Anemia is also associated with other nutritional disorders such as copper, vitamin A, vitamin B12, folate and riboflavin deficiencies or parasitic diseases such as malaria.1
Iron and copper deficiencies have their most profound effect on the developing fetus/neonate, leading to deleterious effects on brain development (see recent reviews).2–5 In rodents, developmental iron and copper deficiencies impair axon myelination, neuronal maturation, neurotransmitter function, and cellular energy metabolism in the developing brain.2–5 These deficits ultimately result in long-term functional and behavioral impairments.2–6
Oxygen and nutrient delivery, and therefore the brain vasculature, is critically important for brain development and function. The brain vasculature is remarkably plastic, reorganizing in response to changes in blood oxygen content to ensure proper tissue perfusion.7 In the adult rat, chronic mild hypoxia increases brain blood vessel density by nearly double after three weeks exposure.8 Importantly, chronic mild hypoxia during rat postnatal development also increases blood vessel density in neonatal and weanling rats.9 Hypoxia-induced angiogenesis (extension and branching of existing vessels) and vasculogenesis (recruitment of endothelial progenitor cells to form new vessels) likely both contribute to increased blood vessel density in the hypoxic brain.
The expression of numerous genes involved in angiogenesis and vasculogenesis (e.g. vascular endothelial growth factor A, Vegfa/VEGFA, Angiopoietin 2, Ang2/ANG2, chemokine (C-X-C ligand) 12, Cxcl12/SDF1, and VEGF receptor 2, Flk1/FLK1) are upregulated in the hypoxic brain through hypoxia inducible factor 1α, HIF1α-dependent or -independent mechanisms.9,11–13 Together the interaction of VEGFA and ANG2 with endothelial cell receptors FLK1 and TIE2 results in destabilization of existing vessels, reorganization of the extracellular matrix, and endothelial cell proliferation and migration.7,14,15 In addition, SDF-1 recruits circulating endothelial progenitor cells, expressing the SDF-1 receptor CXCR4.16 Together these signaling events lead to increased blood vessel growth and branching in the brain.
IDA ultimately leads to tissue hypoxia and induction of HIF1 signaling.17–19 IDA throughout pregnancy was recently shown to induce placental HIF1 protein expression, reflecting the relatively hypoxic environment for the fetus.17 Fetal/neonatal IDA upregulates P15 hippocampal mRNA expression of Slc2a1 (Glut1), Vegfa, and Cxcl12, suggesting the potential for increased angiogenesis and vasculogenesis signaling in the IDA brain.18 Copper deficiency leads to hypoxia and increased HIF2 signaling in the rodent duodenum20 but was also shown to reduce HIF1 signaling in cell culture.21 Both iron and copper deficiencies lower rodent brain iron levels.3,22 Surprisingly, the effects of iron or copper deficiency on the developing brain vasculature have not been assessed.
We hypothesized that fetal/neonatal IDA and copper deficiency anemia induce expression of vasculogenesis- and angiogenesis-associated genes, leading to increased vasculature in the neonatal brain. Fetal/neonatal IDA increased neonatal rat brain mRNA levels for endothelial cell marker genes (Glut1 and Vwf) and angiogenesis/vasculogenesis-associated genes (Ang2, Vegfa, Flk1, and Cxcl12) in three independent experiments. Blood vessel branching was also increased in the neonatal IDA hippocampus and cerebral cortex.
Materials and Methods
Animals and diets
The three experiments described in this study were originally utilized to address a different set of hypotheses.23–25 To minimize animal usage, rat pups from the original experiments were also used to address the objectives of the current study. Briefly, in all experiments, sperm-positive Sprague-Dawley rats were purchased commercially (Charles River Laboratories, Wilmington, MA). Dietary treatments of dams began immediately upon arrival on embryonic day 2 (E2). In Experiment 1 (Exp. 1) and Exp. 2, dams were assigned to one of 3 dietary treatment groups: control, copper-deficient (CuD) iron-deficient (FeD) (n=4–5 dams per group). In Exp. 3, dams were assigned to either control or FeD (n=6 dams per group). FeD and CuD dams were fed an iron-deficient or copper-deficient diet, respectively (Harlan Laboratories, Madison, WI). Control dams were fed a semi-purified iron- and copper-sufficient diet. The iron content of the iron-deficient diet was increased slightly in Exp. 2 compared to Exp. 1, and increased further in Exp. 3 to produce a less severe iron deficiency.23–25 Dietary copper, iron, and zinc contents for the 3 experiments are compared in Supplemental Table 1. Full nutritional content for these semi-purified diets was previously published.24 Dams in all groups drank deionized water. Day of birth was designated as postnatal day 0 (P0). At P2, all litters were culled to 10 pups per dam.
Animals were given free access to diet and drinking water throughout the study and were housed at constant temperature and humidity on a 12h light:dark cycle. All animal studies were conducted in accordance with the principles and procedures outlined in the NIH guide for the Care and Use of Laboratory Animals. The local Institutional Animal Care and Use Committee approved these procedures.
Sample collection
In Exp. 1, brains were removed from one male P12 pup per litter (4–5 total per group), bisected at the midline, and a half-brain was placed in RNAlater (Qiagen, Valencia, CA), and processed for mRNA expression analyses as described.24 An additional male P12 pup per litter was sacrificed and a half-brain was removed and processed for metal analysis as described.24 In Exp. 2, the hippocampus and cerebral cortex were dissected and removed from two male P10 pups per litter (10 total per group), placed in RNAlater, and processed for mRNA expression analyses as described.23 An additional male P10 pup per litter was sacrificed and a half-brain was removed and processed for metal analysis as described.23 On P11, brains were removed from 1 female pup per litter (n=3–4 per group) and immersion-fixed in 10% formalin for 24 h. Female pups were used in Exp. 2 as an initial test of our hypothesis because all male pups were sacrificed on P10 and used for RNA studies. In Exp. 3, the hippocampus and cerebral cortex were dissected and removed from two male P15 pups per litter (n=11–12 total per group), placed in RNAlater, and processed for mRNA expression analyses as described.25 On P16, brains were removed from 1 male pup per litter (n=5–6 per group) and immersion-fixed in 10% formalin for 24 h. For all three experiments, whole blood and serum samples were collected from 1 or 2 pups per litter for blood hemoglobin and serum iron and ceruloplasmin activity analyses
Metal and biochemical analyses
Blood hemoglobin, serum iron and ceruloplasmin activity, and brain metal analyses were performed as described.23,24,26
Brain mRNA analysis
RNA extraction, cDNA synthesis, and quantitative real-time polymerase chain reaction (qPCR) for all experiments were carried out as described.23–25 Primer pairs for the assayed genes are outlined in Supplemental Table 2. Relative mRNA levels were calculated relative to an internal whole brain cDNA calibrator sample from a P12 control rat pup.
GLUT1 immunohistochemistry
Formalin-fixed brains from Exp. 2 and 3 were stored at 4°C in 80% ethanol until processing for immunohistochemistry (IHC). Fixed half-brains from Exp. 2 were paraffin embedded and 8 μm sagittal sections were cut beginning at the midline. Brain sections were mounted on silanized slides, deparaffinized with heat and xylenes, and hydrated in an ethanol series. Slides were washed two times (five minutes each) in PBS containing 0.025% Triton X-100 and then blocked in normal goat block (1.5% normal goat serum and 0.1% bovine serum albumin (BSA) in PBS) for 2 h at room temperature. The goat block was removed and brain sections were incubated in rabbit anti-GLUT1 antibody (1:400 dilution in PBS containing 0.1% BSA) overnight at 4°C in a humidified chamber. The GLUT1 primary antibody was a generous gift from Dr. Lester Drewes and has been previously described.27 Following two five-minute washes, brain sections were incubated in fluorescein isothiocyanate (FITC)-conjugated goat anti-rabbit IgG (1:500 dilution) for 2 h at room temperature in the dark. Sections were washed three times for five minutes each in PBS and mounted with a glycerol-based mounting media (90% glycerol, 1 μg/mL Hoechst, and 1 mg/mL p-phenylenediamine hydrochloride in 0.1M Tris, pH 8.8). Glut1 staining was visualized using a Zeiss LSM710 confocal laser-scanning fluorescent microscope (Carl Zeiss Inc., Jena, Germany). Images of the hippocampus and cerebral cortex were taken at the z-axis center of each brain section at 10x magnification. Brain blood vessels, marked with GLUT1-expressing endothelial cells, were outlined using the ‘Analyze Particles’ tool and total vessel area was calculated in a 248,534 μm2 square region of the hippocampus (dentate gyrus and CA3 sub-regions) and cerebral cortex using ImageJ software.28 To ensure that all brain sections analyzed were taken from the same brain region, the size and shape of the corpus callosum, third ventricle, and hippocampal sub-regions were examined.
Fixed half-brains from Exp. 3 were rinsed in phosphate buffered saline (PBS), embedded in 6% agarose, and 40 μm sagittal sections were cut, starting at the midline, in ice-cold PBS using a vibratome (Oxford Laboratories, San Mateo, CA). Brain sections were transferred to a 12-well plate containing PBS for free-floating IHC. The IHC procedure was carried out as described above with a few changes for free-floating tissues: all buffers contained 0.25% Triton X-100, the secondary antibody incubation contained 1 μg/mL Hoechst and was extended to overnight, and all incubations were done at room temperature with gentle rocking to improve tissue antibody penetration. Following IHC, floating sections were mounted on silanized slides with glycerol-based mounting media and GLUT1 staining was visualized using confocal microscopy. Z-stack images were captured with slices every 1 μm through the entire 40 μm section. The number of vessel branch points was counted in an 11,035,185 μm3 region of the hippocampus (dentate gyrus and CA3 sub-regions) and cerebral cortex using 3D image rendering features of the microscope’s ZEN software (Carl Zeiss Inc., Jena, Germany). Measuring vessel branch points is a validated method for assessing developmental brain angiogenesis.29,30 All brain sections analyzed were 200–300 μm from the midline and similarity of brain depth in the sagittal plane was confirmed with morphological analysis as described above.
Statistical analysis
One-way analysis of variance (ANOVA) was used for making statistical comparisons between three treatment groups. Bartlett’s test was used to assess homogeneity of variances. When variances were equal across groups, Tukey’s post hoc test was used. When variances were unequal, data were ln transformed and Tukey’s test was used. When transformation did not normalize the variances Scheffe’s post hoc test was used on the untransformed data. Student’s t-test was used to compare data between two treatment groups. When variances were unequal and not normalized by ln transformation, Welch’s correction was applied. Statistical outliers were determined by Grubbs’ test (http://www.graphpad.com/quickcalcs/Grubbs1.cfm). All data are presented as mean ± standard error of the mean (SEM). Statistical analyses and data graphing were carried out using Prism (GraphPad Software; La Jolla, CA) or Kaleidagraph (Synergy Software; Reading, PA) software. An α = 0.05 was chosen to define significant differences.
Results
Evaluating offspring copper, iron and hemoglobin status
The neonatal blood hemoglobin and tissue copper and iron measurements from all three experiments were previously reported23–25 and are summarized and compared here for completeness of this study (Table 1). In all experiments, FeD significantly lowered blood hemoglobin and serum iron concentrations, confirming IDA in these pups. FeD also lowered brain iron levels and increased brain copper levels in Exp. 1 and 2. CuD lowered serum ceruloplasmin activity and serum iron, blood hemoglobin, and brain copper levels, confirming copper deficiency anemia with secondary iron deficiency. CuD significantly lowered brain Fe levels in Exp. 1 but not Exp. 2.
Table 1.
Characteristics of rat pups after fetal/neonatal copper and iron deficiencies.
| Exp. 1 (P12) | Exp. 2 (P10) | Exp. 3 (P15/16) | |||||||
|---|---|---|---|---|---|---|---|---|---|
|
| |||||||||
| Characteristic | Control | CuD | FeD | Control | CuD | FeD | Control | FeD | |
| Hemoglobin, g/L | 112 ± 1.6a | 87.0 ± 2.3b | 51.2 ± 1.9c | 118 ± 2.2a | 96.4 ± 2.2b | 58.2 ± 4.0c | 105 ± 3.3a | 41.3 ± 5.9b | |
| Serum iron, μg/mL | 1.53 ± 0.13a | 0.63 ± 0.05b | 0.42 ± 0.05b | 1.52 ± 0.15a | 0.82 ± 0.08b | 0.31 ± 0.04c | 0.94 ± 0.05a | 0.29 ± 0.08b | |
| Ceruloplasmin, U/L | 55.4 ± 6.6a | < 0.3b | 40.3 ± 3.6a | 46.2 ± 3.0a | 4.91 ± 0.55b | 27.5 ± 3.6c | NM | NM | |
| Brain iron, μg/g | 10.9 ± 1.1a | 6.78 ± 1.20b | 4.39 ± 0.41b | 7.65 ± 1.63a | 5.40 ± 0.39a | 3.37 ± 0.08b | NM | NM | |
| Brain copper, μg/g | 1.16 ± 0.04a | 0.48 ± 0.01b | 1.60 ± 0.06c | 0.93 ± 0.02a | 0.51 ± 0.02b | 1.18 ± 0.03c | NM | NM | |
Data are presented as the mean ± SEM (n = 4–10 for Exp. 1, n=5–9 for Exp. 2 and n=5–6 for Exp. 3). Within a specific row for each experiment, means not sharing a common superscript are significantly different (P < 0.05) by one-way ANOVA and Tukey’s or Scheffe’s multiple comparison test (Exp. 1 and 2) or Student’s t-test (Exp. 3). Statistical comparisons were not performed across experiments. NM, not measured.
Effect of copper and iron deficiencies on neonatal brain vasculogenesis-associated gene expression
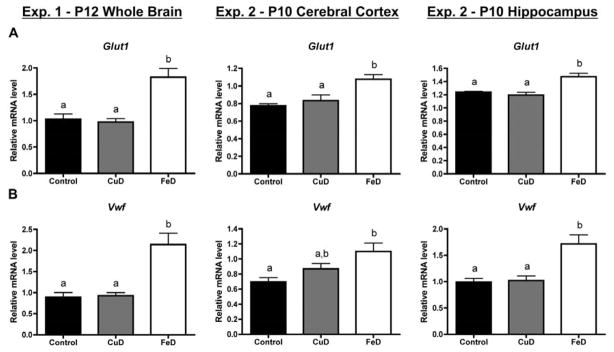
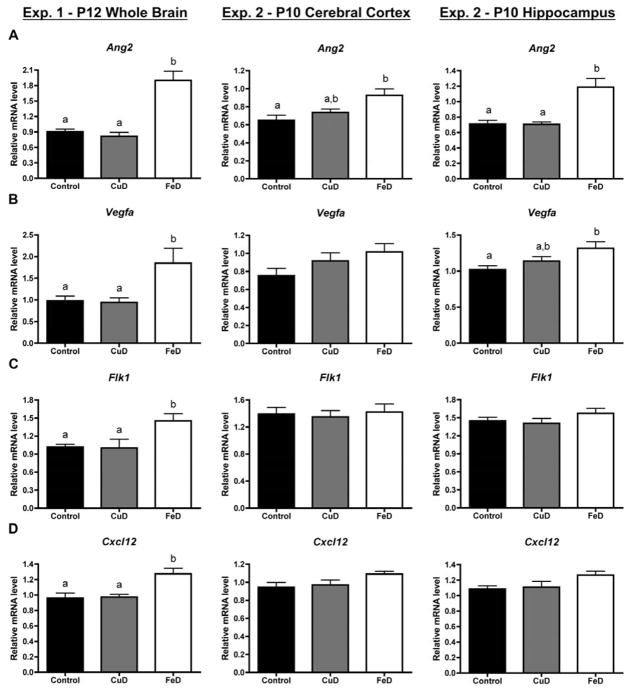
To assess the effect of fetal/neonatal copper and iron deficiencies on the neonatal brain vasculature, brain mRNA levels were assessed for brain blood vessel endothelial cell-specific genes and genes coding for proteins involved in angiogenesis or neovasculogenesis. Fetal/neonatal FeD, but not CuD, increased Glut1 mRNA levels by 77%, 39%, and 19% in the P12 whole brain, P10 cerebral cortex, and P10 hippocampus, respectively, compared to controls (Figure 1A). Similarly, Vwf mRNA levels were 140%, 58%, and 73% higher in the FeD, but not CuD, P12 whole brain, P10 cerebral cortex, and P10 hippocampus (Figure 1B). Iron deficiency increased Ang2 mRNA levels by 111%, 43%, and 68% in the P12 whole brain, P10 cerebral cortex, and P10 hippocampus, respectively (Figure 2A). P12 whole brain and P10 hippocampal Vegfa mRNA levels were 89% and 29% higher, respectively, following developmental iron deficiency (Figure 2B). Fetal/neonatal iron deficiency significantly increased Flk1 (+43%) and Cxcl12 (+33%) mRNA levels in the P12 whole brain but not the P10 cerebral cortex or hippocampus (Figure 2C & D). Copper deficiency did not significantly alter mRNA levels for Ang2, Vegfa, Flk1, or Cxcl12, compared to controls (Figure 2).
Figure 1. Fetal/neonatal iron deficiency induces expression of endothelial cell markers, Glut1 and Vwf in the P10 or P12 brain.
Half brains, hippocampi or cerebral cortices were collected from P12 (Exp. 1, n=4–5) or P10 (Exp. 2, n=8–10) pups, total RNA was extracted, and cDNA was synthesized. Quantitative real-time PCR (qPCR) was performed for Glucose transporter 1, Glut1 (A) or von Willebrand factor, Vwf (B). Relative mRNA levels are calculated relative to an internal control cDNA sample. Data are presented as the mean ± SEM. Groups not sharing a common superscript are significantly different by one-way ANOVA and Tukey’s or Scheffe’s multiple comparison test (P < 0.05).
Figure 2. Fetal/neonatal iron deficiency increases P10 or P12 brain angiogenesis/vasculogenesis-associated gene expression.
Half brains, hippocampi or cerebral cortices were collected from P12 (Exp. 1, n=4–5) or P10 (Exp. 2, n=8–10) pups, total RNA was extracted, and cDNA was synthesized. Quantitative real-time PCR (qPCR) was performed for several angiogenesis/vasculogenesis-associated genes. (A) Angiopoietin 2, Ang2 (B) Vascular endothelial cell growth factor A, Vegfa (C) Vegf receptor 2, Flk1 (D) Chemokine (C-X-C motif) ligand 12, Cxcl12. Relative mRNA levels are calculated relative to an internal control cDNA sample. Data are presented as mean ± SEM. Groups not sharing a common superscript are significantly different by one-way ANOVA and Tukey’s multiple comparison test (P < 0.05).
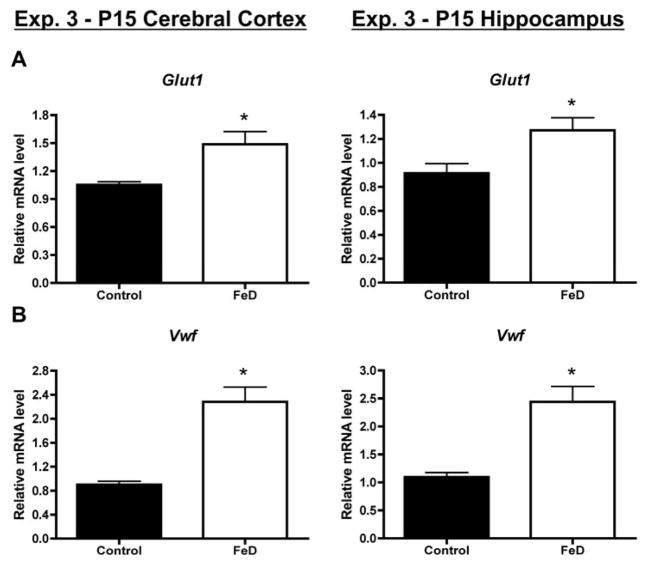
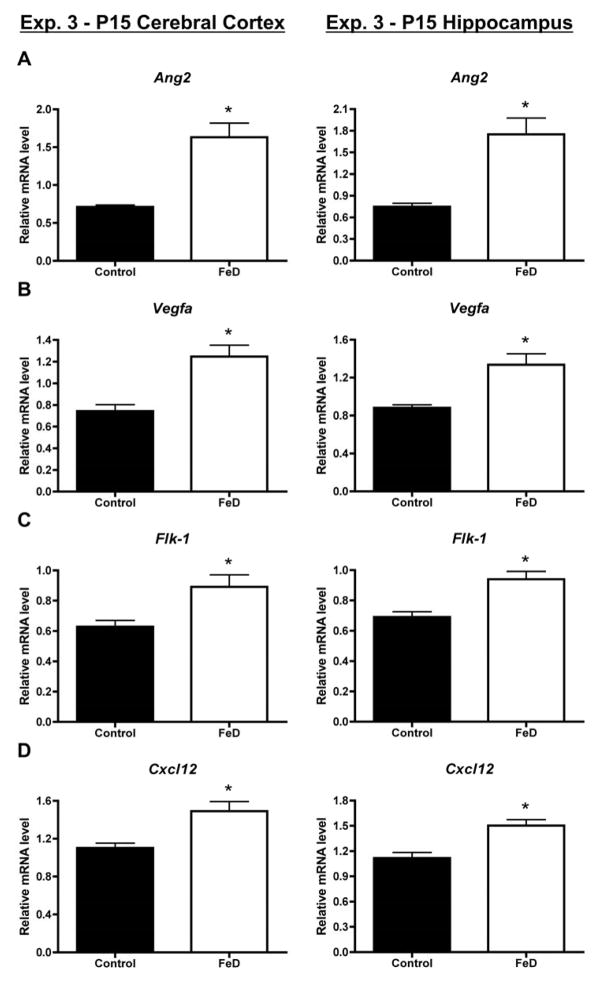
To more extensively assess the effect of fetal/neonatal iron deficiency on cerebrovasculature-associated gene expression, a third qPCR experiment was performed. As in Exp. 1 and 2, Glut1 and Vwf mRNA levels were higher in the neonatal FeD cerebral cortex and hippocampus compared to controls (Figure 3). Fetal/neonatal iron deficiency also significantly increased P15 cerebral cortical and hippocampal mRNA levels for Ang2, Vegfa, Flk1, and Cxcl12 (Figure 4). Together these mRNA data suggest increased vasculature in the neonatal iron-deficient brain.
Figure 3. Fetal/neonatal iron deficiency increases expression of endothelial cell markers, Glut1 and Vwf in the P15 cerebral cortex and hippocampus.
Hippocampi or cerebral cortices were collected from P15 (Exp. 3, n=11–12) pups, total RNA was extracted, and cDNA was synthesized. Quantitative real-time PCR (qPCR) was performed for Glucose transporter 1, Glut1 (A) or von Willebrand factor, Vwf (B). Relative mRNA levels are calculated relative to an internal control cDNA sample. Data are presented as the mean ± SEM. Asterisks indicate a statistically significant difference by Student’s t-test (P < 0.05).
Figure 4. Fetal/neonatal iron deficiency increases P15 hippocampus and cerebral cortex angiogenesis/vasculogenesis-associated gene expression.
Hippocampi or cerebral cortices were collected from P15 (Exp. 3, n=11–12) pups, total RNA was extracted, and cDNA was synthesized. Quantitative real-time PCR (qPCR) was performed for several angiogenesis/vasculogenesis-associated genes. (A) Angiopoietin 2, Ang2 (B) Vascular endothelial cell growth factor A, Vegfa (C) Vegf receptor 2, Flk1 (D) Chemokine (C-X-C motif) ligand 12, Cxcl12. Relative mRNA levels are calculated relative to an internal control cDNA sample. Data are presented as the mean ± SEM. Asterisks indicate a statistically significant difference by Student’s t-test (P < 0.05).
Effect of copper and iron deficiencies on neonatal brain vasculature
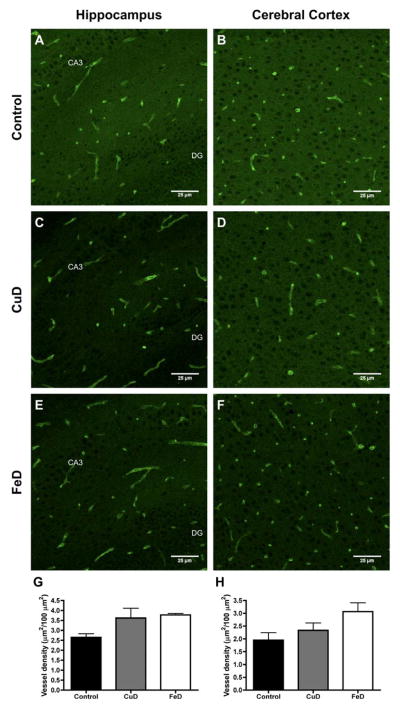
To directly examine the effect of copper and iron deficiency on neonatal brain blood vessel density, an initial GLUT1 IHC experiment was performed on 8 μm sagittal sections from Exp. 2 P11 brains and hippocampal and cerebral cortical blood vessel areal density was calculated (Figure 5). Representative GLUT1 IHC images for control, CuD, and FeD cerebral cortex and hippocampus are shown in Figure 5A–F. There was a trend towards increased blood vessel density in the P11 FeD hippocampus (+42%) and cerebral cortex (+57%) when all three groups were compared by one-way ANOVA and Tukey’s multiple comparison test (P = 0.1) (Figure 5G & H). When Student’s t-test was used to statistically compare only control and FeD blood vessel densities, p-values were 0.05 and 0.06 for the hippocampus and cerebral cortex, respectively. This directional trend toward increase blood vessel density was supportive of a more detailed brain vasculature analysis.
Figure 5. Blood vessel density in the P11 control, copper-deficient, and iron-deficient brain.
GLUT1 immunohistochemistry was performed on 8 μm sagittal brain sections from Exp. 2 P11 female pups. Confocal microscopy was used to visualize blood vessels in the control (n=3), CuD (n=4), and FeD (n=4) hippocampus and cerebral cortex. Representative images are shown in panels A–F. Areal blood vessel density was calculated for each treatment group in the hippocampus (G) and cerebral cortex (H). Data are presented as the mean ± SEM. DG, dentate gyrus. CA3, cornu Ammonis 3.
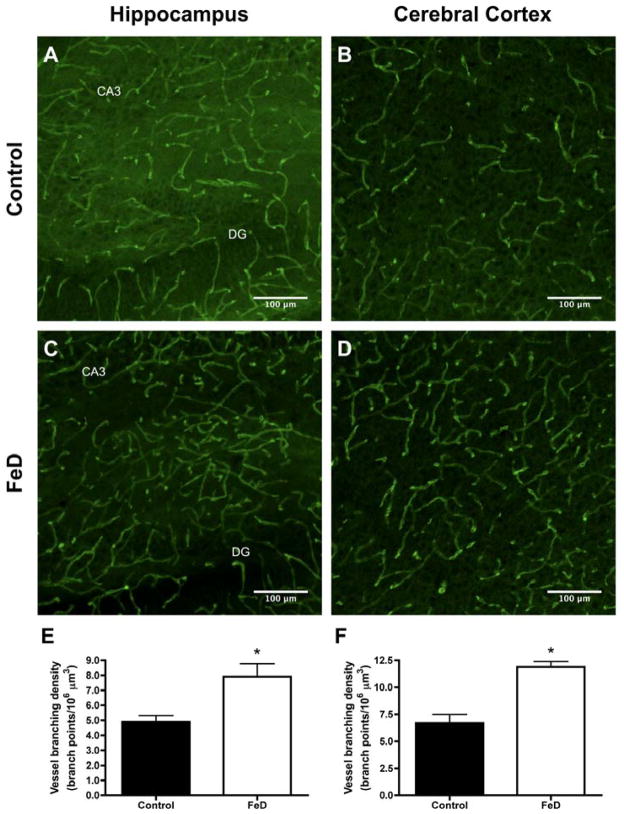
To better assess the effect of iron deficiency on the neonatal brain vasculature, a second GLUT1 IHC experiment was performed with 40 μm sagittal sections from Exp. 3 P16 brains. Representative GLUT1 IHC Z-projection images for the control and FeD P16 cerebral cortex and hippocampus are shown in Figure 6A–D. Blood vessel branching density was 62% and 78% higher in the P16 FeD cerebral cortex and hippocampus, respectively, compared to controls (Figure 6E & F; p < 0.05). These data reveal, for the first time, an increased vasculature in the iron-deficient neonatal brain.
Figure 6. Iron deficiency increases P15 brain blood vessel branching.
GLUT1 immunohistochemistry was performed on 40 μm sagittal brain sections from Exp. 3 P15 male pups. Confocal microscopy was used to visualize blood vessels in the control (n=6) and FeD (n=5) hippocampus and cerebral cortex. Z-stack images, with a slice interval of 1 μm, were captured through the entire 40 μm section. Representative z-projection images are shown in panels A–D. Blood vessel branching density was calculated for each treatment group in the hippocampus (E) and cerebral cortex (F). Data are presented as the mean ± SEM. Asterisks indicate a statistically significant difference by Student’s t-test (P < 0.05). DG, dentate gyrus. CA3, cornu Ammonis 3.
Discusson
This study shows, for the first time, increased vascular complexity in the neonatal brain following fetal/neonatal iron deficiency with anemia. This finding was supported by elevated Glut1 and Vwf mRNA levels, which in the brain are expressed predominantly in vascular endothelial cells,31,32 in the neonatal iron-deficient brain. Fetal/neonatal iron deficiency increased mRNA levels for genes involved in angiogenesis or vasculogenesis (i.e. Vegfa, Ang2, Cxcl12, and Flk1) in the neonatal brain, indicating elevation in cellular signaling for new blood vessel growth.
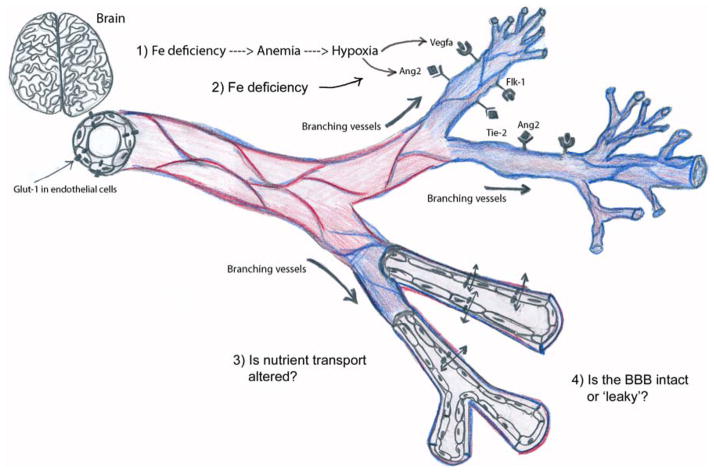
IDA increases the expression of both hypoxia inducible factor 1 alpha-dependent and -independent genes. HIF1alpha protein degradation is regulated by prolyl hydroxylase, which requires both oxygen and iron for full activity.10 Therefore, iron deficiency anemia could induce blood vessel growth through hypoxia-dependent and/or iron-dependent mechanisms (see proposed model, Figure 7). It will be beneficial for future mechanistic studies to directly interrogate prolyl hydroxylase and HIF1alpha cellular signaling in the neonatal IDA brain.
Figure 7. Proposed model of the effects of IDA on neonatal brain vasculature.
Fetal/neonatal IDA increased neonatal brain expression of genes involved in blood vessel growth (Ang2, Vegfa, Flk1, and Cxcl12). IDA also led to higher expression of blood vessel endothelial cell-specific genes (Glut1 and Vwf) and increased blood vessel branching in the neonatal brain, suggesting an induction of vasculogenesis and/or angiogenesis. IDA could increase neonatal brain vasculature through hypoxia-mediated (1) or iron-specific mechanisms (2). Additional experiments are needed to address these potential underlying molecular mechanisms and the impact of increased vasculature on functional outcomes such as nutrient transport (3) and BBB integrity (4). Copyright Thu An Nguyen.
While this study has focused on IDA, iron deficiency without anemia is estimated to affect an additional two to three billion people worldwide.33 Mouse models of neuronal-specific iron deficiency result in impaired spatial and procedural learning/memory, aberrant hippocampal neuron dendritic morphology, and impaired hippocampal and striatal energy status.34–36 These studies suggest that anemia is not required for some of the effects of iron deficiency on brain development. Interestingly, Glut1 mRNA expression is elevated in the hippocampus and nucleus accumbens of adult neuronal-specific iron-deficient mice.35 This could be the result of the altered brain energy status in these mice or it could indicate an increased brain vasculature. Future studies should examine HIF/angiogenic signaling and the brain vasculature in brain-specific models of iron deficiency to delineate the specific role of iron in this process.
We hypothesized that the anemia and tissue iron deprivation associated with iron and copper deficiencies would induce angiogenesis/vasculogenesis. However, increased blood vessel density was not observed in neonatal CuD pups despite moderate anemia and decreased serum and brain iron concentrations. CuD pups were less severely anemic and iron-deficient than FeD pups, indicating that this discrepancy could be due to a threshold effect. In addition, copper is required for HIF1 activation,21 which could outweigh any effects of moderate anemia/iron deficiency on HIF1 signaling.
The neuronal differentiation, migration, and maturation processes that occur during brain development are energy demanding, requiring oxygen and glucose delivery for aerobic metabolism. Therefore, it is not surprising that blood vessel density has been shown to correlate with energy demand.37 Since the FeD pups were also severely anemic, it is likely that at least initially, increased brain angiogenesis/vasculogenesis is an adaptive and beneficial response in an attempt to maintain nutrient substrates that are critical for the metabolism of the developing brain- including oxygen, glucose and iron. However, there are also potential maladaptive consequences (Figure 7). The brain vasculature is unique among vascular systems in that it forms a tight barrier, known as the blood-brain-barrier (BBB), to selectively regulate transfer of molecules between the blood and the brain.38 Vascular remodeling associated with angiogenesis involves degradation of the basal membrane and extracellular matrix and dissociation of pericytes from the vascular endothelial cells.14 During this remodeling, the BBB is thought to be locally immature while new vessel extensions and branches, and thus new endothelial cell connections, are formed.14 In adult rats, hypoxia-induced brain angiogenesis leads to increased BBB permeability in a VEGF-mediated process.39 These data suggest that fetal/neonatal iron deficiency induced angiogenesis/vasculogenesis may compromise BBB integrity in the neonatal brain (Figure 7).
In addition to providing more oxygen to the brain, an increase in brain vasculature indicates that blood-brain transport of additional nutrients, hormones, and signaling molecules would also be elevated (Figure 7). Ben-Shachar et al. demonstrated increased brain uptake of glucose and insulin in adult iron-deficient rat brains.40 We, and others, have observed increased brain copper levels in the neonatal and adult iron-deficient brain,23,24,41,42 which may be explained by elevated copper transport due to additional blood vessel density. Brain copper overload has been associated with neurodegenerative diseases, such as Alzheimer’s disease.43 The important question of whether the effect of fetal/neonatal iron deficiency on brain copper levels persists into the adult brain following recovery, to our knowledge, has not been addressed. The functional implications of elevated glucose, insulin, or copper in the iron-deficient brain are unclear and should be addressed in future studies.
Neurogenesis and angiogenesis are tightly coupled, responding to an overlapping set of signaling molecules, including VEGFA, ANG1 and 2, BDNF, and SDF1.44 This suggests that disruptions to angiogenic signaling, and blood vessel formation, will also have consequences for neuronal maturation. Indeed, hippocampal CA1 pyramidal neuron dendritic arborization is impaired following fetal/neonatal IDA.45 Whether the initiating event for these impairments is altered angiogenesis, aberrant neuronal maturation, or defective expression of shared signaling molecules remains to be determined.
Iron deficiency with or without anemia affects billions of people worldwide, having its most profound effect on the developing brain. Therefore, it is important to determine the molecular and structural basis for the brain developmental deficits associated with iron deficiency. Increased brain vasculature in the iron-deficient neonatal brain could have serious short- and long-term negative consequences for brain function. This novel finding opens up new avenues of research into the effects of iron deficiency on brain development.
Supplementary Material
Acknowledgments
We thank the members of the Anderson and Prohaska labs for their invaluable assistance with tissue collection and selected assays. In particular we would like to thank Ariel Johnson, Margaret Broderius and Kevin Viken. The Duluth Medical Research Institute core facilities were utilized for qPCR experiments. The Duluth Imaging Center was used for confocal microscopy. TWB received financial support from the UM Lyle and Sharon Bighley Graduate Fellowship and the UM Doctoral Dissertation Fellowship. SS received financial support from the Pathways to Advanced Degrees in Life Sciences program. Grants supporting this research included NIH 5R03HD055423-02.
Footnotes
Conflict of interest statement: The authors have no conflicts of interest to declare.
References
- 1.McLean E, Cogswell M, Egli I, Wojdyla D, de Benoist B. Worldwide prevalence of anaemia, WHO Vitamin and Mineral Nutrition Information System, 1993–2005. Public Health Nutr. 2009;12(4):444–54. doi: 10.1017/S1368980008002401. [DOI] [PubMed] [Google Scholar]
- 2.Fretham SJ, Carlson ES, Georgieff MK. The role of iron in learning and memory. Adv Nutr. 2011;2(2):112–21. doi: 10.3945/an.110.000190. [DOI] [PMC free article] [PubMed] [Google Scholar]
- 3.Lozoff B, Georgieff MK. Iron deficiency and brain development. Semin Pediatr Neurol. 2006;13(3):158–65. doi: 10.1016/j.spen.2006.08.004. [DOI] [PubMed] [Google Scholar]
- 4.Johnson WT. Copper and Brain Function. In: Lieberman HR, Kanarek RB, Prasad C, editors. Nutritional Neuroscience. Taylor and Francis Group; 2005. pp. 289–305. [Google Scholar]
- 5.Uriu-Adams JY, Scherr RE, Lanoue L, Keen CL. Influence of copper on early development: prenatal and postnatal considerations. Biofactors. 2010;36(2):136–52. doi: 10.1002/biof.85. [DOI] [PubMed] [Google Scholar]
- 6.Bastian TW, Lassi KC, Anderson GW, Prohaska JR. Maternal iron supplementation attenuates the impact of perinatal copper deficiency but does not eliminate hypotriiodothyroninemia nor impaired sensorimotor development. J Nutr Biochem. 2011;22(11):1084–90. doi: 10.1016/j.jnutbio.2010.09.007. [DOI] [PMC free article] [PubMed] [Google Scholar]
- 7.LaManna JC, Chavez JC, Pichiule P. Structural and functional adaptation to hypoxia in the rat brain. J Exp Biol. 2004;207(Pt 18):3163–9. doi: 10.1242/jeb.00976. [DOI] [PubMed] [Google Scholar]
- 8.LaManna JC, Vendel LM, Farrell RM. Brain adaptation to chronic hypobaric hypoxia in rats. J Appl Physiol. 1992;72(6):2238–43. doi: 10.1152/jappl.1992.72.6.2238. [DOI] [PubMed] [Google Scholar]
- 9.Ogunshola OO, Stewart WB, Mihalcik V, Solli T, Madri JA, Ment LR. Neuronal VEGF expression correlates with angiogenesis in postnatal developing rat brain. Brain Res Dev Brain Res. 2000;119(1):139–53. doi: 10.1016/s0165-3806(99)00125-x. [DOI] [PubMed] [Google Scholar]
- 10.Sharp FR, Bernaudin M. HIF1 and oxygen sensing in the brain. Nat Rev Neurosci. 2004;5(6):437–48. doi: 10.1038/nrn1408. [DOI] [PubMed] [Google Scholar]
- 11.Marti HH, Risau W. Systemic hypoxia changes the organ-specific distribution of vascular endothelial growth factor and its receptors. Proc Natl Acad Sci U S A. 1998;95(26):15809–14. doi: 10.1073/pnas.95.26.15809. [DOI] [PMC free article] [PubMed] [Google Scholar]
- 12.Pichiule P, LaManna JC. Angiopoietin-2 and rat brain capillary remodeling during adaptation and deadaptation to prolonged mild hypoxia. J Appl Physiol. 2002;93(3):1131–9. doi: 10.1152/japplphysiol.00318.2002. [DOI] [PubMed] [Google Scholar]
- 13.Miller JT, Bartley JH, Wimborne HJ, Walker AL, Hess DC, Hill WD, et al. The neuroblast and angioblast chemotaxic factor SDF-1 (CXCL12) expression is briefly up regulated by reactive astrocytes in brain following neonatal hypoxic-ischemic injury. BMC Neurosci. 2005;6:63. doi: 10.1186/1471-2202-6-63. [DOI] [PMC free article] [PubMed] [Google Scholar]
- 14.Baburamani AA, Ek CJ, Walker DW, Castillo-Melendez M. Vulnerability of the developing brain to hypoxic-ischemic damage: contribution of the cerebral vasculature to injury and repair? Front Physiol. 2012;3:424. doi: 10.3389/fphys.2012.00424. [DOI] [PMC free article] [PubMed] [Google Scholar]
- 15.Dore-Duffy P, LaManna JC. Physiologic angiodynamics in the brain. Antioxid Redox Signal. 2007;9(9):1363–71. doi: 10.1089/ars.2007.1713. [DOI] [PubMed] [Google Scholar]
- 16.Ceradini DJ, Kulkarni AR, Callaghan MJ, Tepper OM, Bastidas N, Kleinman ME, et al. Progenitor cell trafficking is regulated by hypoxic gradients through HIF-1 induction of SDF-1. Nat Med. 2004;10(8):858–64. doi: 10.1038/nm1075. [DOI] [PubMed] [Google Scholar]
- 17.Toblli JE, Cao G, Oliveri L, Angerosa M. Effects of iron deficiency anemia and its treatment with iron polymaltose complex in pregnant rats, their fetuses and placentas: oxidative stress markers and pregnancy outcome. Placenta. 2012;33(2):81–7. doi: 10.1016/j.placenta.2011.11.017. [DOI] [PubMed] [Google Scholar]
- 18.Carlson ES, Stead JD, Neal CR, Petryk A, Georgieff MK. Perinatal iron deficiency results in altered developmental expression of genes mediating energy metabolism and neuronal morphogenesis in hippocampus. Hippocampus. 2007;17(8):679–91. doi: 10.1002/hipo.20307. [DOI] [PubMed] [Google Scholar]
- 19.Tran PV, Fretham SJ, Wobken J, Miller BS, Georgieff MK. Gestational-neonatal iron deficiency suppresses and iron treatment reactivates IGF signaling in developing rat hippocampus. Am J Physiol Endocrinol Metab. 2012;302(3):E316–24. doi: 10.1152/ajpendo.00369.2011. [DOI] [PMC free article] [PubMed] [Google Scholar]
- 20.Matak P, Zumerle S, Mastrogiannaki M, El Balkhi S, Delga S, Mathieu JR, et al. Copper Deficiency Leads to Anemia, Duodenal Hypoxia, Upregulation of HIF-2alpha and Altered Expression of Iron Absorption Genes in Mice. PLoS One. 2013;8(3):e59538. doi: 10.1371/journal.pone.0059538. [DOI] [PMC free article] [PubMed] [Google Scholar]
- 21.Feng W, Ye F, Xue W, Zhou Z, Kang YJ. Copper regulation of hypoxia-inducible factor-1 activity. Mol Pharmacol. 2009;75(1):174–82. doi: 10.1124/mol.108.051516. [DOI] [PMC free article] [PubMed] [Google Scholar]
- 22.Pyatskowit JW, Prohaska JR. Iron injection restores brain iron and hemoglobin deficits in perinatal copper-deficient rats. J Nutr. 2008;138(10):1880–6. doi: 10.1093/jn/138.10.1880. [DOI] [PubMed] [Google Scholar]
- 23.Bastian TW, Anderson JA, Fretham SJ, Prohaska JR, Georgieff MK, Anderson GW. Fetal and neonatal iron deficiency reduces thyroid hormone-responsive gene mRNA levels in the neonatal rat hippocampus and cerebral cortex. Endocrinology. 2012;153(11):5668–80. doi: 10.1210/en.2012-1067. [DOI] [PMC free article] [PubMed] [Google Scholar]
- 24.Bastian TW, Prohaska JR, Georgieff MK, Anderson GW. Perinatal iron and copper deficiencies alter neonatal rat circulating and brain thyroid hormone concentrations. Endocrinology. 2010;151(8):4055–65. doi: 10.1210/en.2010-0252. [DOI] [PMC free article] [PubMed] [Google Scholar]
- 25.Bastian TW, Prohaska JR, Georgieff MK, Anderson GW. Fetal and neonatal iron deficiency exacerbates mild thyroid hormone insufficiency effects on male thyroid hormone levels and brain thyroid hormone-responsive gene expression. Endocrinology. 2014;155(3):1157–67. doi: 10.1210/en.2013-1571. [DOI] [PMC free article] [PubMed] [Google Scholar]
- 26.Prohaska JR. Changes in tissue growth, concentrations of copper, iron, cytochrome oxidase and superoxide dismutase subsequent to dietary or genetic copper deficiency in mice. J Nutr. 1983;113(10):2048–58. doi: 10.1093/jn/113.10.2048. [DOI] [PubMed] [Google Scholar]
- 27.Gerhart DZ, LeVasseur RJ, Broderius MA, Drewes LR. Glucose transporter localization in brain using light and electron immunocytochemistry. J Neurosci Res. 1989;22(4):464–72. doi: 10.1002/jnr.490220413. [DOI] [PubMed] [Google Scholar]
- 28.Schneider CA, Rasband WS, Eliceiri KW. NIH Image to ImageJ: 25 years of image analysis. Nat Methods. 2012;9(7):671–5. doi: 10.1038/nmeth.2089. [DOI] [PMC free article] [PubMed] [Google Scholar]
- 29.Harb R, Whiteus C, Freitas C, Grutzendler J. In vivo imaging of cerebral microvascular plasticity from birth to death. J Cereb Blood Flow Metab. 2013;33(1):146–56. doi: 10.1038/jcbfm.2012.152. [DOI] [PMC free article] [PubMed] [Google Scholar]
- 30.Murugesan N, Demarest TG, Madri JA, Pachter JS. Brain regional angiogenic potential at the neurovascular unit during normal aging. Neurobiol Aging. 2012;33(5):1004e1–16. doi: 10.1016/j.neurobiolaging.2011.09.022. [DOI] [PMC free article] [PubMed] [Google Scholar]
- 31.Yamamoto K, de Waard V, Fearns C, Loskutoff DJ. Tissue distribution and regulation of murine von Willebrand factor gene expression in vivo. Blood. 1998;92(8):2791–801. [PubMed] [Google Scholar]
- 32.Vannucci SJ, Maher F, Simpson IA. Glucose transporter proteins in brain: delivery of glucose to neurons and glia. Glia. 1997;21(1):2–21. doi: 10.1002/(sici)1098-1136(199709)21:1<2::aid-glia2>3.0.co;2-c. [DOI] [PubMed] [Google Scholar]
- 33.Stoltzfus R. Defining iron-deficiency anemia in public health terms: a time for reflection. J Nutr. 2001;131(2S-2):565S–7S. doi: 10.1093/jn/131.2.565S. [DOI] [PubMed] [Google Scholar]
- 34.Carlson ES, Tkac I, Magid R, O’Connor MB, Andrews NC, Schallert T, et al. Iron is essential for neuron development and memory function in mouse hippocampus. J Nutr. 2009;139(4):672–9. doi: 10.3945/jn.108.096354. [DOI] [PMC free article] [PubMed] [Google Scholar]
- 35.Carlson ES, Fretham SJ, Unger E, O’Connor M, Petryk A, Schallert T, et al. Hippocampus specific iron deficiency alters competition and cooperation between developing memory systems. J Neurodev Disord. 2010;2(3):133–43. doi: 10.1007/s11689-010-9049-0. [DOI] [PMC free article] [PubMed] [Google Scholar]
- 36.Fretham SJ, Carlson ES, Georgieff MK. Neuronal-specific iron deficiency dysregulates mammalian target of rapamycin signaling during hippocampal development in nonanemic genetic mouse models. J Nutr. 2013;143(3):260–6. doi: 10.3945/jn.112.168617. [DOI] [PMC free article] [PubMed] [Google Scholar]
- 37.Tuor UI, Kurpita G, Simone C. Correlation of local changes in cerebral blood flow, capillary density, and cytochrome oxidase during development. J Comp Neurol. 1994;342(3):439–48. doi: 10.1002/cne.903420310. [DOI] [PubMed] [Google Scholar]
- 38.Hawkins BT, Davis TP. The blood-brain barrier/neurovascular unit in health and disease. Pharmacol Rev. 2005;57(2):173–85. doi: 10.1124/pr.57.2.4. [DOI] [PubMed] [Google Scholar]
- 39.Schoch HJ, Fischer S, Marti HH. Hypoxia-induced vascular endothelial growth factor expression causes vascular leakage in the brain. Brain. 2002;125(Pt 11):2549–57. doi: 10.1093/brain/awf257. [DOI] [PubMed] [Google Scholar]
- 40.Ben-Shachar D, Yehuda S, Finberg JP, Spanier I, Youdim MB. Selective alteration in blood-brain barrier and insulin transport in iron-deficient rats. J Neurochem. 1988;50(5):1434–7. doi: 10.1111/j.1471-4159.1988.tb03027.x. [DOI] [PubMed] [Google Scholar]
- 41.Garcia SJ, Gellein K, Syversen T, Aschner M. Iron deficient and manganese supplemented diets alter metals and transporters in the developing rat brain. Toxicol Sci. 2007;95(1):205–14. doi: 10.1093/toxsci/kfl139. [DOI] [PubMed] [Google Scholar]
- 42.Monnot AD, Behl M, Ho S, Zheng W. Regulation of brain copper homeostasis by the brain barrier systems: effects of Fe-overload and Fe-deficiency. Toxicol Appl Pharmacol. 2011;256(3):249–57. doi: 10.1016/j.taap.2011.02.003. [DOI] [PMC free article] [PubMed] [Google Scholar]
- 43.Zatta P, Frank A. Copper deficiency and neurological disorders in man and animals. Brain Res Rev. 2007;54(1):19–33. doi: 10.1016/j.brainresrev.2006.10.001. [DOI] [PubMed] [Google Scholar]
- 44.Ward NL, Lamanna JC. The neurovascular unit and its growth factors: coordinated response in the vascular and nervous systems. Neurol Res. 2004;26(8):870–83. doi: 10.1179/016164104X3798. [DOI] [PubMed] [Google Scholar]
- 45.Brunette KE, Tran PV, Wobken JD, Carlson ES, Georgieff MK. Gestational and neonatal iron deficiency alters apical dendrite structure of CA1 pyramidal neurons in adult rat hippocampus. Dev Neurosci. 2010;32(3):238–48. doi: 10.1159/000314341. [DOI] [PMC free article] [PubMed] [Google Scholar]
Associated Data
This section collects any data citations, data availability statements, or supplementary materials included in this article.


