Abstract
Hypoxic-ischemic (HI) injury is an important cause of neurological morbidity in neonates. HI leads to pathophysiological responses, including inflammation and oxidative stress that culminate in cell death. Activation of glycogen synthase kinase 3β (GSK3β) and the signal transducer and activator of transcription (STAT3) promotes brain inflammation.
The purpose of this study was to test whether inhibition of GSK3β signalling protects against neonatal HI brain injury. Mice were subjected to HI at postnatal day (PND) 9 and treated with a selective GSK3β inhibitor, SB216763. Brain injury and caspase-3 activation, antioxidant and inflammatory mRNA responses and activation of STAT3 were analysed. Our results show that HI reduced phosphorylation of GSK3β, thus promoting its kinase activity. The GSK3β inhibitor reduced caspase-3 activation and neuronal cell death elicited by HI and reverted the effects of HI on gene expression of the anti-oxidant enzyme sod2 and mitochondrial factor pgc1α. The HI insult activated STAT3 in glial cells and GSK3β inhibition attenuated STAT3 phosphorylation and its nuclear translocation following HI. Further, GSK3β inhibition reduced HI-induced gene expression of pro-inflammatory cytokines tnfα and Il-6, while promoted the anti-inflammatory factor Il-10.
In summary, data show that GSK3β inhibition is neuroprotective in neonatal HI brain injury likely via reduced pro-inflammatory responses by blocking STAT3 signalling. Our study suggests that pharmacological interventions built upon GSK3β silencing strategies could represent a novel therapy in neonatal brain injury.
Keywords: perinatal, hypoxia-ischemia, GSK3β, STAT3, neuroinflammation, oxidative stress
1. Introduction
Hypoxia-ischemia (HI) is an important cause of brain injury and neurological morbidity in neonates, including cerebral palsy, cognitive deficits and mental retardation (Hagberg and Mallard, 2000). HI leads to a sequence of pathophysiological responses, such as glutamate excitotoxicity, inflammation and oxidative stress that culminate in an apoptosis-necrosis cell death continuum (Northington et al., 2011).
Glycogen synthase kinase 3 (GSK3) is a constitutive activated serine/ threonine protein kinase, which is highly abundant in the brain (Woodgett, 1990) and is localized both in neurons and in glial cells (Perez-Costas et al., 2010). GSK3 consists of two isoforms, GSK3α and GSK3β, and increases in GSK3β activity has been correlated with pro-apoptotic mechanisms, including inhibition of pyruvate dehydrogenase (Hoshi et al., 1996), interaction with p53 (Watcharasit et al., 2003), Bax phosphorylation (Linseman et al., 2004), and β-catenin degradation (Ciani and Salinas, 2005; Zhang et al., 1998). A role for GSK3β in inflammatory responses has also been documented, both in the periphery and in the brain. GSK3β is involved in the production of pro- and anti-inflammatory cytokines in peripheral blood mononuclear cells after Toll-like receptor (TLRs) stimulation (Martin et al., 2005). Moreover it promotes microglial migration and activation, resulting in tumour necrosis factor alpha (TNFα) production (Wang et al., 2010; Yuskaitis and Jope, 2009). GSK3β also controls the release of interleukin-6 (IL-6) via activation of the transcription factor signal transducer and activator of transcription 3 (STAT3) (Beurel and Jope, 2009).
Activation of STAT3 has been detected in neuropathological conditions including adult ischemia (Justicia et al., 2000) and neonatal HI (Shrivastava et al., 2013), and was implicated in reactive astrogliosis (Sriram et al., 2004). Also GSK3β involvement in neurological diseases has been studied in the adult (del Ser et al., 2013; Maixner and Weng, 2013), while data in newborns are more scant (Brywe et al., 2005a; Li et al., 2010; Xiong et al., 2012) and limited to observations of indirect effects of pharmacological interventions with drugs or factors not selective for GSK3β.
Here we sought to test the hypothesis that specific inhibition of GSK3β protects the neonatal brain from HI. We treated neonatal mice, exposed to HI, with a selective inhibitor of GSK3β, SB216763 (Coghlan et al., 2000). We examined the outcome of the injury by analysing parameters related to apoptotic cell death, neuronal loss, anti-oxidant response and inflammatory factors. As both GSK3β and STAT3 are mutually involved in neuroinflammation we analysed the activation of STAT3 under HI conditions and following GSK3β inactivation.
2. Material and Methods
2.1. Hypoxia-ischemia (HI)
All experiments were performed on C57/Bl6 mice housed at Experimental Biomedicine, University of Gothenburg. All experiments were conducted in accordance with Department of Agriculture (Sweden) ethics regarding animal experimentation and approved by the local Animal Ethics Committee, Gothenburg (Licence Number 139/2012). All efforts were made to minimise animal suffering and to reduce the number of animals used. HI brain injury was induced in mice pups between postnatal days 9 and 10 (PND9 and PND10; day of birth designated as PND0) according to previous protocols (Hedtjarn et al., 2002). Briefly, the left carotid artery was permanently ligated under isoflurane anaesthesia and the skin was closed using surgical glue (Vetbond, SweVet, Sweden). Animals were left to recover for one hour with the mother and were then placed in a chamber at 36°C with first normal air for 10 min, followed by a mixture of normal air and nitrogen so that the oxygen concentration was kept at 10% for 20 min. Normal air was then circulated through the chamber for 10 min after which the pups were returned to their mother and left until sacrifice. The HI insult results in unilateral brain injury in the left hemisphere ipsilateral to the artery ligation, while the contralateral (right) hemisphere remains undamaged (Svedin et al., 2007). Sham animals were subjected to anesthesia and the left carotid artery was exposed, but not ligated.
2.2. Drug administration
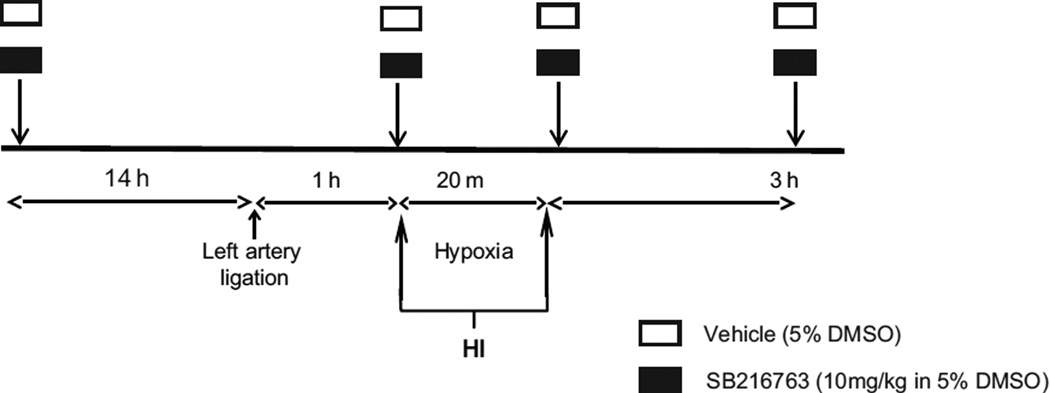
Animals were treated with repeated intraperitoneal (i.p.) injections of a selective inhibitor of GSK3β (SB216763, Sigma Aldrich, Saint Louis, USA) or dimethyl sulfoxide (DMSO, vehicle). Drug administration was performed as displayed in figure 1. Briefly, animals received the first injection 14 h before HI, the second injection immediately before exposure to hypoxia, the third injection immediately after animals were removed from the hypoxic chamber, and the last injection 3 h after the end of hypoxia. The SB216763 was freshly prepared prior to use at a concentration of 1 mg/mL containing 5% DMSO and injected at a dose of 10 mg/kg. Vehicle- and saline-treated mice received injections with equivalent volume (10 mL/kg) of 5% DMSO and 0.9% NaCl solution, respectively. The drug concentration was chosen and adapted to neonatal mice, based on protocols used in adult animal studies (Rada et al., 2012).
Fig. 1. Experimental procedure.
Animals were administered four intraperitoneal (i.p) injections of SB216763 (GSK3β inhibitor) or dimethyl sulfoxide (DMSO, vehicle). Mice received the first injection 14 h before, the second immediately before, the third immediately after and the last administration given 3 h after hypoxia-ischemia. The SB216763 was freshly prepared prior to use at a concentration of 1 mg/mL containing 5% DMSO and injected at a dose of 10 mg/kg. Vehicle-treated mice received injections with equivalent volume (10 mL/kg) of 5% DMSO.
2.3. Total protein extraction
Total protein extraction was performed from hippocampi and cortices from both ipsi- and contralateral hemispheres at 2 h post-HI (n=7 from 3 mixed litters) and at 6 h post-HI (n=8 from 6 mixed litters). Tissues were homogenized by sonication in ice-cold PBS containing 5 mM EDTA (Sigma), protease inhibitor cocktail (Sigma), phosphatase inhibitor cocktails (Sigma). Total protein concentration was measured using the NanoDrop 2000/2000c (Thermo Scientific).
2.4. Subcellular fractionation
Pups were decapitated at 6 h post-HI and the ipsi- and contra-lateral hemispheres were freshly homogenised in buffer containing 70 mmol/L sucrose, 210 mmol/L mannitol, 5 mmol/L HEPES, 1 mmol/L EDTA, protease inhibitors and phosphatase inhibitors with a Potter homogenizer, according to previous protocols (Nijboer et al., 2007). Homogenates were incubated on ice for 20 min, followed by 10 min centrifugation at 800 g at 4°C, leading to a nuclear pellet (P1). Supernatants (S1) were further centrifuged at 3,300 g to remove potential nuclear contaminant and used as the cytoplasmic fraction.
Nuclear proteins were obtained by homogenizing nuclear pellets (P1) in buffer containing 10 mmol/L HEPES (pH 7.9), 10 mmol/L KCl, 1.5 mmol/L MgCl2, 0.1 mmol/L EDTA, 0.1 mmol/L EGTA and 1 mmol/L DTT supplemented with protease inhibitors using a Potter-homogenizer. After 15 min incubation on ice, NP-40 was added (final concentration of 3%), the mixture was vortexed and centrifuged for 1 min at 10,000 g at 4°C. The nuclear pellet was resuspended in ice-cold hypertonic nuclear extraction buffer containing 20 mmol/L HEPES (pH 7.9), 420 mmol/L NaCl, 1.5 mmol/L MgCl2, 1 mmol/L EDTA, 1 mmol/L EGTA, 1 mmol/L DTT and protease inhibitors, incubated on ice for 30 min and centrifuged for 5 min at 10,000 g at 4°C. (All chemicals were supplied by Sigma Aldrich). The supernatant containing the nuclear proteins was used as the nuclear fraction. Protein concentration in both fractions were measured with the NanoDrop 2000/2000c (Thermo Scientific) and used for western blot analysis.
2.5. Western Blot
Sample lysates were mixed with 4X Laemmly Buffer (Bio-Rad Laboratories, USA) and heated (95°C) for 5 min. Protein samples (20 µg/lane) were resolved in 8–16% Criterion TGX stain Free Precast Gels according to the manufacturer's instructions (Bio-Rad Laboratories, USA). After electrophoresis, the gel was activated by UV light in the Chemidoc MP camera (Bio-Rad Laboratories, USA) and then assembled together with a PVDF transfer pack in a TBT Cassette and transferred for 7 min with standard protocol. After transferring, total proteins were visualized on PVDF membrane in the Chemidoc MP camera as stain-free blot, employing ImageLab software (Bio-Rad Laboratories, USA). For antibody detection, membranes were blocked in 30 mM Tris–HCl (pH 7.5), 100 mM NaCl and 0.1% Tween-20 (TBS-T) containing 5% fat-free milk powder for 1 h at room temperature and then incubated with the following primary antibodies overnight: rabbit-anti pSer9GSK3β (1:1000, Cell Signaling), rabbit anti-GSK3β (1:1000, Cell Signaling), rabbit anti-β-catenin (1:500, Cell Signaling), rabbit anti-pTyr705 STAT3 (1:1000, Cell Signaling), rabbit anti-STAT3 (1:10000, Cell Signaling), mouse anti-Nrf2 (1:1000, R&D Diagnostics), goat anti-laminin B (1:500, Santa Cruz Biotechnology) and rabbit anti-GADPH (1:1000, Abcam). After washing, the membranes were incubated with the appropriate peroxidase-labelled secondary antibody (Vector Laboratories, Burlingame, USA) 1 h at room temperature and visualized using the Super Signal Western Dura substrate (Pierce, Rockford, USA) and the Chemidoc MP camera (Bio-Rad Laboratories, USA). Potential interference between signals from epitopes of proteins with similar molecular weights was avoided by stripping the membranes between subsequent incubations with primary antibody. Membranes were placed in stripping buffer (62.5 mM Tris-HCl, 2% SDS, 0.8% β-mercaptoethanol) at 50°C for 30 min and then washed extensively with TBS-T. Laminin B and GADPH were used to determine the purity of cytoplasmic and nuclear fractions, respectively. Immunoreactive bands were normalized against total protein density, employing ImageLab software (Bio-Rad Laboratories, USA).
2.6. Quantitative PCR
Hippocampus and cortex RNAs were extracted with RNeasy Lipid Tissue Mini Kit (Qiagen, Solna, Sweden) at 6 h post-HI. Total RNA was measured with the NanoDrop 2000/2000c (Thermo Scientific) at 260 nm absorbance. First strand cDNA was synthesised from 500 ng RNA using QuantiTect Reverse Transcription Kit (Qiagen). Each PCR (20 µl) contained 2 µl cDNA diluted 1:10, 10 µl Quanti Fast SYBR Green PCR Master Mix (Qiagen, Sweden) and 2 µl PCR primer. The following primers (Qiagen, Solna, Sweden) were used: Mm-Gclc QuantiTech Primer Assay QT00130543, Mm-Gclm QuantiTech Primer Assay QT00174300, Mm-Sod2 QuantiTech Primer Assay QT00161707, Mm-Pgc1α QuantiTech Primer Assay QT00156303, Mm-Tfma QuantiTech Primer Assay QT00154413, Mm-Nfe2l2 QuantiTech Primer Assay QT00095270, Mm-Il10 QuantiTech Primer Assay QT00106169, Mm-Il6 QuantiTech Primer Assay QT00098875, Mm-Tfn1 QuantiTech Primer Assay QT00104006, Mm-Gusb QuantiTech Primer Assay QT00176715. The amplification protocol comprised an initial 5 min denaturation at 95°C, followed by 40 cycles of denaturation for 10 sec at 95°C and annealing/extension for 30 sec at 60°C on a LightCycler 480 (Roche, Sweden). Melting curve analysis was performed to ensure that only one PCR product was obtained. For quantification and for estimation amplification efficiency, a standard curve was generated using increasing concentrations of cDNA. The amplification transcripts were quantified with the relative standard curve and normalized against the reference gene Gusb.
2.7. Caspase-3 activity assays
Caspase-3 activity was performed as previously described (Blomgren et al., 2001). Peptide substrate, Ac-Asp-Glu-Val-Asp-aminomethyl coumarine (Ac-DEVD-AMC; #SAP3171v, Peptide Int.), was mixed with samples of hippocampus and cortex collected 6 h after HI (n=8 from 6 mixed litters). Cleavage of the substrate was measured at 37°C using Spectramax Gemini microplate fluorometer (Molecular Devices, Sunnyvale, CA), with an excitation/emission wavelength of 380/460 nm. The degradation was followed at 2 min intervals, and V-max was calculated from the entire linear part of the curve. Standard curves with AMC in the appropriate buffer were used to express the data in pico-moles of AMC (7-amino-4-methyl-coumarin) formed per min and per mg of protein.
2.8. Cerebral blood flow measurements
Cerebral blood flow (CBF) was measured in the ipsi- and contra-lateral hemispheres by liquid scintillation counting (n=8 from 3 mixed litters) at the end of HI by the iodoantipyrine method as previously described (Ek et al., 2015) in mouse pups subjected to two drug/vehicle injections (14 h before and immediately before HI). Briefly, five µCi (50 µL injection) 4-Iodo[N-methyl-14C]antipyrine (American Radiolabeled Chemicals, Saint Louis, USA) in saline was injected subcutaneously. After 60 sec the mouse was decapitated, blood collected and left/right hemispheres separated. All tissues were dissolved using Soluene-350 (Perkin-Elmer, Waltham, Massachusetts, USA). After samples were dissolved, 4.5 mL Ultima Gold (Perkin Elmer) was added and the radioactivity in samples measured in a liquid scintillation counter (Packard Instrument, USA).
2.9. Brain infarct evaluation
Brain infarct evaluation was performed measuring immunohistochemical staining of microtubule-associated protein-2 (MAP-2) according to previous protocols (Svedin et al., 2007). Animals injected with SB216763 (n=20) or DMSO (n=23) were deeply anesthetised and intracardially perfused with saline and 5% buffered formaldehyde (Histofix; Histolab, Sweden) 7 days after HI. Brains were fixed in 5% formaldehyde for 24 h, embedded in paraffin and 10 µm thick coronal sections were sliced throughout the hippocampus. For immunostaining antigen recovery was performed by boiling the sections in 10 mM sodium citrate buffer (pH 6.0) for 10 min. Nonspecific binding was blocked for 30 min in blocking solution (1% horse serum, 3% bovine serum albumin, 0.1% NaN3 in PBS). Sections were incubated in primary antibody against MAP-2 (clone HM-2, 1:1000; Sigma-Aldrich) at 4°C overnight, followed by biotinylated horse anti-mouse secondary antibodies (1:250, Vector Laboratories) for 60 min at room temperature. Visualization was performed using Vectastain ABC Elite with 0.5 mg/ml 3,3-diaminobenzidine enhanced with 15 mg/ml ammonium nickel sulphate, 2 mg/ml β-D-glucose, 0.4 mg/ml ammonium chloride, and 0.01 mg/ml β-glucose oxidase (all from Sigma-Aldrich). Stained sections were analysed under a Nikon Optiphot-2 microscope equipped with an Olympus DP50 cooled digital camera. Images were captured and processed using Micro Image version 4.0 (Olympus). Injured brain area was assessed as the MAP-2 negative area in the ipsilateral hemisphere compared to the contralateral hemisphere and reported as % of tissue loss, according to previous studies (Svedin et al., 2007).
2.10. Hippocampal progenitor cell assay
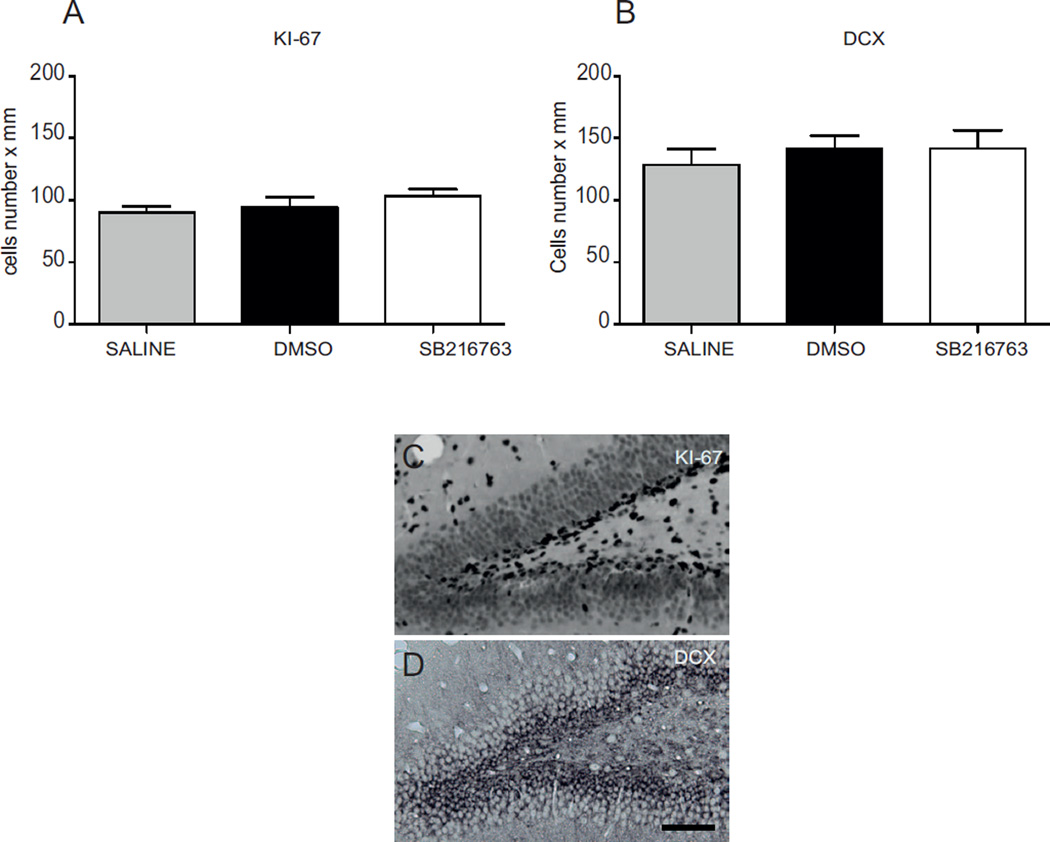
Proliferation of neuronal precursor cells was assessed by counting the number of Ki-67 and doublecortin (DCX) positive cells in the sub-granule zone (SGZ) in the dentate gyrus of the hippocampus. Animals were injected with saline, DMSO or SB216763 (n = 5/group) following the drug administration protocol shown in figure 1, but without receiving HI. Seven days after treatments mice were deeply anesthetized and perfused intracardially with PBS and 5% buffered formaldehyde (Histofix; Histolab, Gothenburg, Sweden). Brains were fixed and paraffin-embedded as described above. Seven µm thick coronal sections were sliced throughout the hippocampus. Three sections from hippocampal levels in each brain, with a distance of 350 µm between sections, were selected for Ki-67 and DCX staining. Nonspecific binding was blocked for 30 min with 4% donkey serum in PBS for 30 min. The primary antibodies monoclonal mouse anti-Ki-67 (1:75 dilution, NCL-Ki67-MM1, Novocastra TM, UK) or goat anti-doublecortin (1:200, sc-8066, Santa Cruz Biotechnology) were used and incubated at 20°C for 60 min. The appropriate biotinylated secondary antibodies (1:250 dilutions; donkey anti-mouse or donkey anti-goat, Vector Laboratories, Burlingame, CA, USA) were added for 60 min at room temperature. The sections were visualized using diaminobenzidine as described above. The total number of Ki-67 and DCX positive cells were counted in the sub-granule zone (SGZ) of the dentate gyrus in the hippocampus. The length of the SGZ was measured and the number of positive cells expressed as number per mm was counted in three sections from each brain. The average from the three sections was used as n=1 when comparing cell numbers between different brains. All counting was carried out by an investigators blinded to group assignment.
2.11. Immunohistochemical staining
Animals were killed by an i.p injection of pentobarbital at 6 h after HI for immunohistochemical analysis (n=4). Paraffin sections of brains at hippocampal level was prepared as above including deparaffination and blocking of sections with only difference being that antigen retrieval was performed by boiling sections in 1mM EDTA (pH 8) for 15 min. Single label of pSTAT3 was performed by over-night incubation with rabbit anti-pTyr705 STAT3 (1:400, Cell Signaling), followed by 2 h incubation with biotinylated horse anti-rabbit antibodies (1:250, Vector) and sections developed with a DAB kit (SK-4100, Vector) according to manufacturer’s recommendations. Double immune reactivity was performed on sections using antibodies against p-STAT3 (as above) mixed with one of the following antibodies and incubated overnight: mouse anti-glial fibrillary acidic protein (GFAP, 1:50; Sigma-Aldrich, clone G-A-5), goat anti-CD31 (1:100; RD Systems, AF3628), mouse anti-NeuN (1:50; Merck-Millipore, clone A60) or mouse anti-Iba1/AIF1 (1:750; Merck-Millipore, MABN92). All sections were then incubated at room temperature for 2 h with a mixture of secondary antibodies against appropriate species conjugated with either alexafluor-488 or −594 and examined/photographed with a Zeiss Axio Imager Z2 epifluorescence microscope.
2.12. Statistics
Statistical analyses between ipsi- and controlateral brain areas were determined using t-test. Comparisons of more than two groups were analysed with one–way ANOVA followed by Holm-Sidak’s multiple comparison test. All data are presented as mean ± SEM. Significance levels were set at *p ≤ 0.05, **p ≤ 0.005, ***p≤ 0.0005. All statistical analyses were performed using GraphPad Prism (GraphPad Software).
3. Results
3.1. GSK3β is activated in the brain after neonatal HI
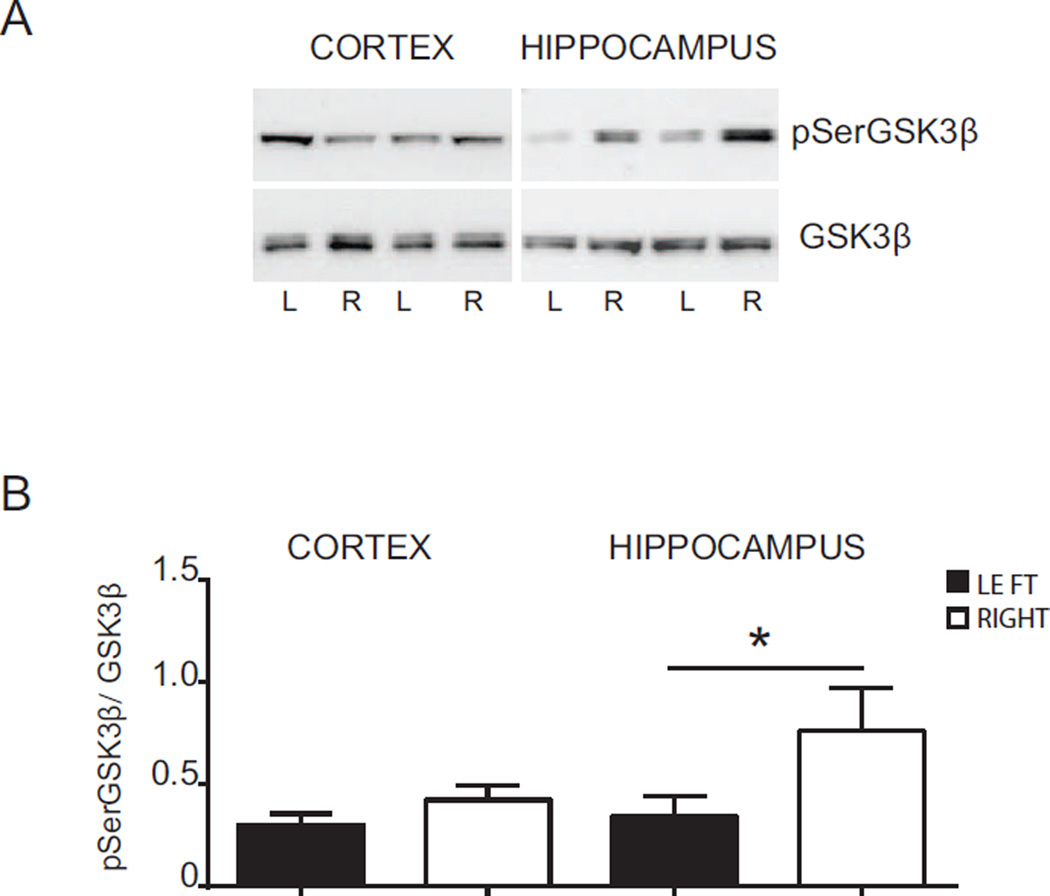
A decrease in Ser9 residue phosphorylation on GSK3β is indicative of enzyme activation. Therefore we investigated activation of GSK3β after HI by determining protein levels of pSer9GSK3β and total GSK3β (Ser9phosphorylated and non-phosphorylated form), by Western blot (Fig. 2). We evaluated the changes in the phosphorylation status of GSK3β by normalizing densitometric values obtained for pSerGSK3β with those for GSK3β (pSerGSK3β/GSK3β). For simplicity the pSerGSK3β/GSK3β value is hereafter referred to as pGSK3β. We found that 2 h after HI (without drug treatment), the pGSK3β levels were significantly lower in the ipsilateral hippocampus (0.34 ± 0.09) compared with the contralateral counterpart (0.76 ± 0.20, p = < 0.05). GSK3β phosphorylation was not modified in the cortex at this time point (Fig. 2 A and B), suggesting an early activation of GSK3β only in the hippocampus.
Fig. 2. Phosphorylation of GSK3β after hypoxia-ischemia.
(A) Western blots of pSerGSK3β and total GSK3β (GSK3β) in the cortex and hippocampus 2 h after HI. Blots are shown for ipsilateral (L) and contralateral (R) cortex and hippocampus after HI. (B) Densitometric analysis of phosphorylation status of GSK3β protein 2 h after HI in cortex and hippocampus in ipsilateral (LEFT - black bars) and contralateral (RIGHT - white bars) side. Data are presented as the mean ± SEM of ratios between density values of pSerGSK3β and GSK3β (pSerGSK3β/GSK3β). Data were analyzed by t-test, *p ≤ 0.05, n = 7 per group.
3.2. SB216763 reduces GSK3β activation after HI
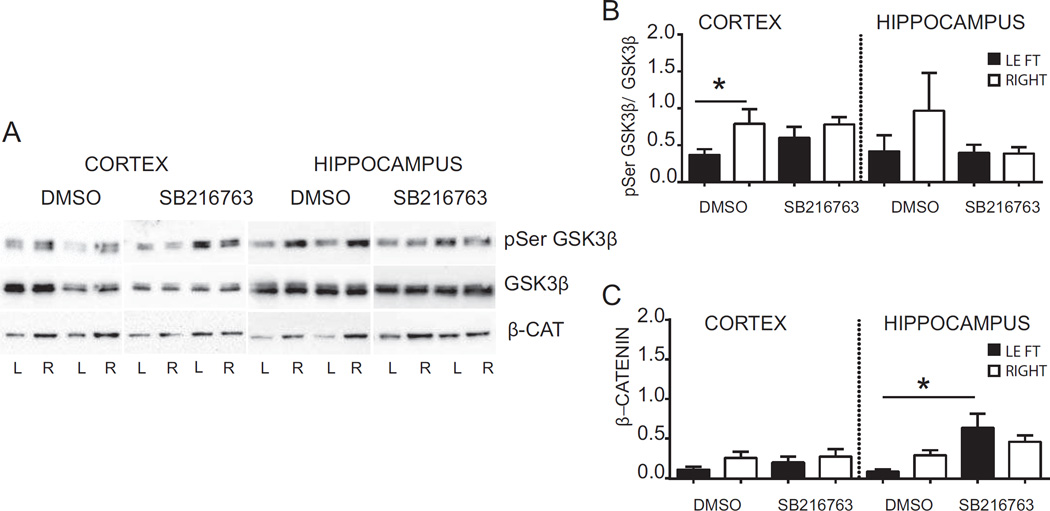
To evaluate if systemic administration of a selective GSK3β inhibitor targets GSK3β in the brain we analysed pGSK3β in hippocampi and cortices of pups subjected to HI and administered with SB216763 or DMSO (Fig. 3 A and B). Western blot analysis in DMSO- injected animals revealed that at 6 h after HI pGSK3β values were reduced in the ipsilateral cortex (0.37 ± 0.08) in comparison to the contralateral cortex (0.79 ± 0.19, p < 0.05). A similar trend was observed in the hippocampus, although this did not reach statistical significance (p > 0.05). SB216763 treatment prevented HI-induced reductions in pGSK3β both in the cortex and the hippocampus (Fig. 3 A and B). When activated, GSK3β promotes proteosomal degradation of the transcriptional co-activator β-catenin (Ciani and Salinas, 2005). To evaluate if SB216763 inhibited GSK3β activity we measured β-catenin protein expression (Fig. 3 A and C). There were no statistical significant changes in β-catenin after HI in either cortex (left: 0.12 ± 0.04 vs right: 0.26 ± 0.08; p > 0.05) or the hippocampus (left: 0.09 ± 0.02 vs right: 0.29 ± 0.06; p > 0.05). However, SB216763 increased the level of β-catenin protein expression in the ipsilateral hippocampus compared with the ipsiltaeral hippocampus in DMSO-treated animals (DMSO: 0.09 ± 0.02 vs SB216763: 0.64 ± 0.18; p < 0.05). Overall, the results indicate that GSK3β is activated 6 h after HI in the cortex, which was prevented by SB216763. Further, SB216763 induced β-catenin accumulation in the injured hippocampus.
Fig. 3. Effect of SB216763 administration on GSK3β activation and β-catenin protein expression.
(A) Western blots of pSerGSK3β, GSK3β and β-catenin in the cortex and hippocampus 6 h after HI from mice injected with SB216763 or vehicle (dimethyl sulfoxide, DMSO). Blots are shown for ipslateral (L) and contralateral (R) cortex and hippocampus after HI. (B) Densitometric analysis 6 h after HI of phosphorylation status of GSK3β protein in cortex and hippocampus from mice injected with drug (SB216763) or vehicle (DMSO). Data are presented as ratio between density value of pSerGSK3β and GSK3β (pSerGSK3β/GSK3β). (C) Densitometric analysis 6h after HI of β-catenin protein in cortex and hippocampus from mice injected with SB216763 or vehicle (DMSO). Data are shown in ipsilateral (LEFT- black bars) and contralateral (RIGHT-white bars) of respective brain areas. Data are expressed as mean ± SEM, n = 8 per group. Data were analyzed with one–way ANOVA followed by Holm-Sydak’s multiple comparison test, *p ≤ 0.05.
3.3. SB216763 reduces caspase-3 activity and improves HI outcome
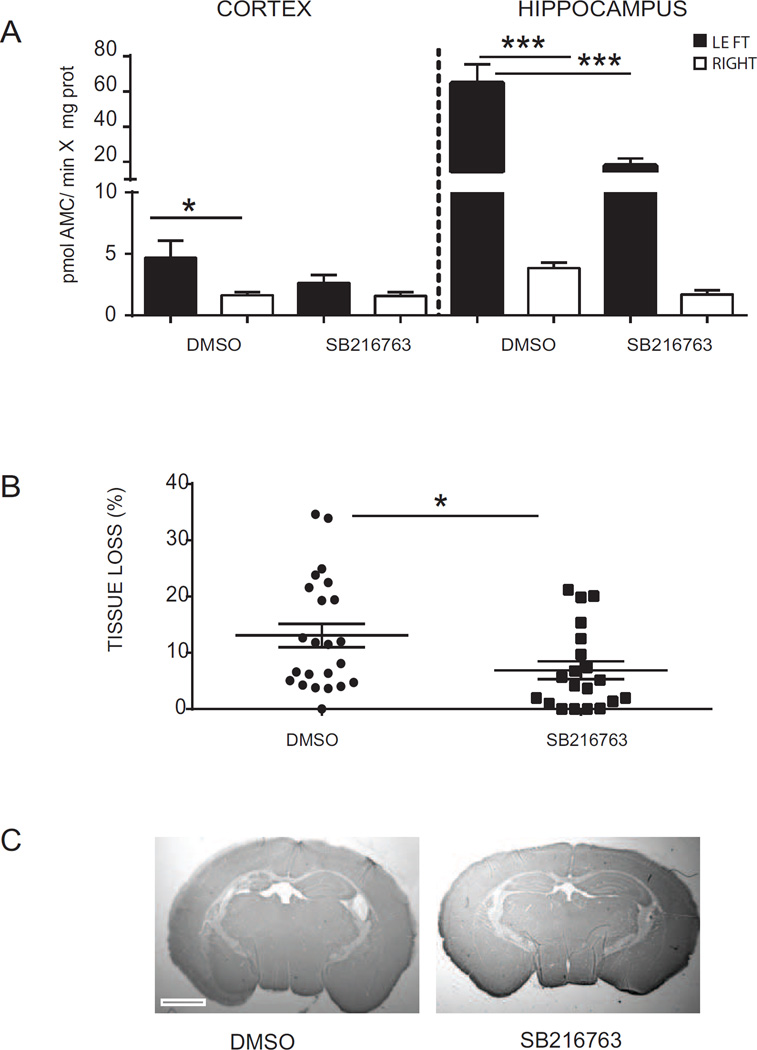
To investigate whether the inhibition of GSK3β affects cell death mechanisms we assessed the activation of caspase-3 by fluorometric assay. Caspase-3 activity was evaluated 6 h post-HI in hippocampi and cortices isolated from mice treated with SB216763 or DMSO (Fig. 4 A). Low levels of caspase-3 activity were detected in the hippocampus and cortex from the contralateral hemisphere, whereas caspase-3 enzymatic activity was upregulated in the ipsilateral cortex (left: 4.67 ± 1.41 vs right: 1.63 ± 0.25; pmol AMC/min*mg protein, p < 0.05) and in the ipsilateral hippocampus (left: 60.75 ± 10.85 vs right: 3.84 ± 0.45; pmol AMC/min*mg protein, p < 0.0005) after HI in DMSO-injected animals. Following treatment with SB216763 caspase-3 activity in the cortex was similar in the ipsilateral and contralateral hemisphere (left: 2.62 ± 0.67 vs right: 1.58 ± 0.30; pmol AMC/min*mg protein, p > 0.05). The enzymatic activity of caspase-3 in the ipsilateral hippocampus was significantly reduced by SB216763 in comparison with the control group (DMSO: 60.75 ± 10.85 vs SB216763: 13.81 ± 4.25; pmol AMC/min*mg protein, p < 0.0005).
Fig. 4. Protective effect of SB216763 in immature brain after hypoxia-ischemia.
(A) Fluorometric quantification of caspase-3 activity in ipsilateral (LEFT- black bars) and contralateral (RIGHT-white bars) cortex and hippocampus homogenates at 6 h after hypoxia-ischemia (HI). Data are expressed as mean ± SEM, n=8 per group. Data were analysed with one–way ANOVA followed by Holm-Sydak’s multiple comparison test: *p ≤ 0.05; ***p ≤ 0.0005. (B) Tissue loss analysis (MAP-2 negative area in the ipsilateral hemisphere compared to the contralateral hemisphere) at 7 days after HI in SB216763-treated mice compared with DMSO-injected mice. Data are expressed as mean ± SEM, DMSO n=20; SB216763 n=23. Data were analyzed by t-test; *p ≤ 0.05 (C) Representative photomicrographs of MAP-2-stained sections of mouse brain at hippocampus level at 7 days after HI in DMSO (left panel) and SB216763 (right panel). Scale bar equals 1 mm.
To determine whether SB216763 or the vehicle DMSO had any direct effect on cell death we measured caspase-3 in naïve animals and in sham–operated mice administered with saline, DMSO or SB21676. Neither DMSO nor SB21676 treated animals showed caspase-3 activity above naïve animals (Fig Suppl 1).
As SB216763 reduced HI-induced caspase-3 activity we next asked if GSK3β inhibition could improve neuronal outcome (Fig. 4 B and C). Neuropathological assessment was performed 7 days post-HI on brains isolated from DMSO-injected or SB216763-treated mice. Immunohistochemical staining of MAP2 protein demonstrated 13.07 ± 2.08% of tissue loss in mice injected with DMSO. The tissue loss was reduced by SB216763 administration to 6.88 ± 1.60% (p < 0.05).
3.4. SB216763 does not affect survival and proliferation of neural progenitors
As previous reports have indicated that GSK3 inactivation can promote neural progenitor proliferation (Kim et al., 2009), we next evaluated whether SB216763 impacts on the survival and proliferation of neuronal progenitors cells. Analysis of the number of Ki-67 (Fig 5 A and C) and doublecortin (DCX) (Fig 5 B and C) positive cells in the sub-granule zone (SGZ) of the dentate gyrus of the hippocampus revealed no difference between mice injected with SB216763 and those treated with DMSO or saline, thus indicating that GSK3β inactivation does not interfere with physiological neural developmental processes.
Fig. 5. SB216763 does not affect neuronal progenitor cell proliferation in the neonatal brain.
Number of Ki-67 (A) and DCX (B) positive cells were determined in the sub-granule zone (SGZ) of dentate gyrus in the hippocampus 7 days after administration of saline (gray bar), DMSO (black bar) or SB216763 (white bar). Data are expressed as mean ± SEM, n=5/group. Data were analyzed with one–way ANOVA followed by Holm-Sydak’s multiple comparison test. Photomicrographs display immunoreactivity for KI67 (C) and DCX (D) in the SGZ of the dentate gyrus of the hippocampus. Scale bar equals 100 µm.
3.5. SB216763 does not influence cerebral blood flow in mice undergoing HI
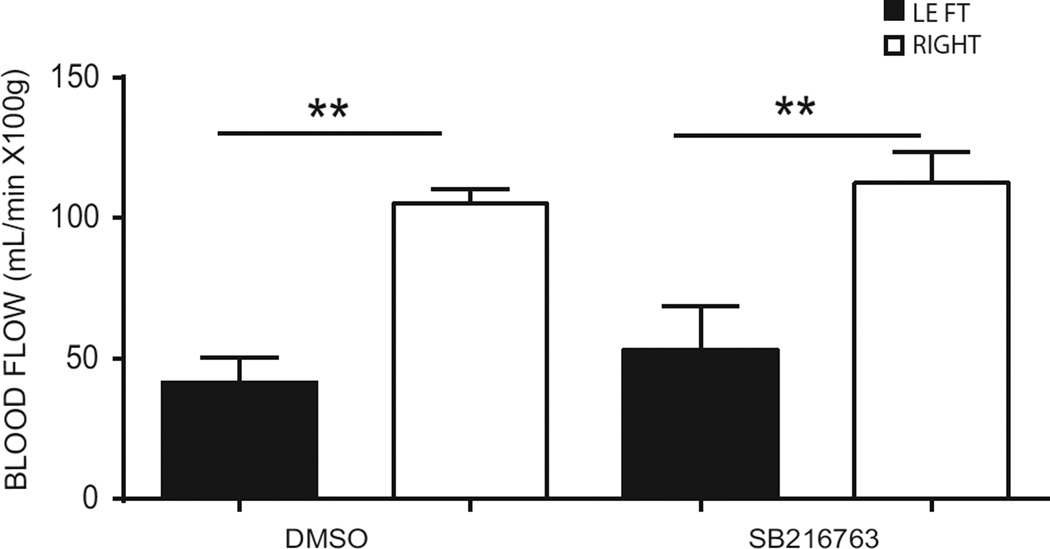
SB216763 was partially administrated before HI, which potentially could affect CBF during HI and indirectly influences the neuropathological outcome. Thus we measured CBF in pups subjected to HI after receiving the first two HI doses of SB216763 or DMSO (Fig. 6). A similar reduction in CBF in the ipsilateral hemisphere compared to the contralateral hemisphere was demonstrated both in pups injected with DMSO (left: 41.60 ± 8.73 mL/min x 100 g vs right: 105.20 ± 5.18 mL/min x 100 g, p < 0.005) and in pups treated with SB216763 (left: 53.20 ± 15.51 mL/min x 100 g vs right: 112.60 ± 10.85 mL/min x 100 g, p < 0.005), indicating that the neuroprotection by SB216763 is not due to effects on CBF during HI.
Fig. 6. Cerebral blood flow (CBF) measurements after hypoxia-ischemia in DMSO- and SB216763- treated animals.
Cerebral blood flow (CBF) was measured by the iodoantipyrine method using liquid scintillation counting of ipsilateral hemisphere (LEFT- black bars) and the contralateral hemispere (RIGHT- white bars) at the end of HI in DMSO- and SB216763- treated animals. Data are expressed as mean ± SEM, n=8. Data were analyzed with one–way ANOVA followed by Holm-Sydak’s multiple comparison test, **p<0.005.
3.6. SB216763 improves antioxidant defence after HI
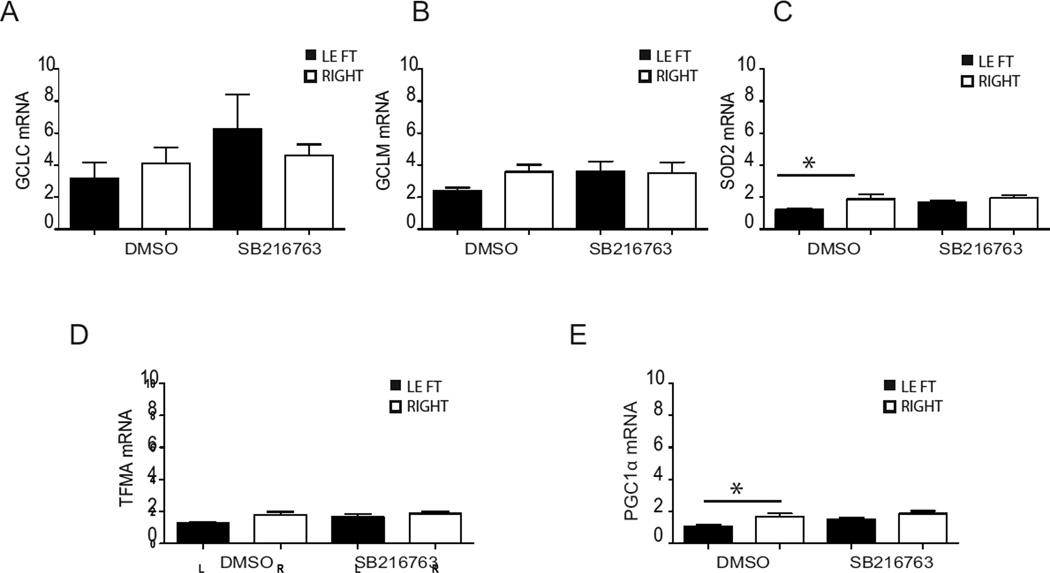
Oxidative stress is believed to contribute to neuronal cell death in neonatal HI (Correa et al., 2013). Therefore we asked whether the protective effect of SB216763 might arise from a capability to improve the antioxidant defence under HI conditions. mRNA analysis of hippocampi showed that HI in the DMSO group negatively modulated gene expression of the antioxidant superoxide dismutase 2 (sod2; left: 1.19 ± 0.06 vs right: 1.83 ± 0.28; p < 0.05; Fig. 7 C), and peroxisome proliferator-activated receptor gamma coactivator 1-alpha (pgc1α; left: 1.09 ± 0.08 vs right: 1.69 ± 0.18; p < 0.05; Fig. 7 E). Treatment with SB216763 restored the expression of these genes to control levels (Fig. 7 C & E). The mRNA expression of the transcription factor Nuclear factor erythroid-derived 2-like 2 (nrf2) increased in the ipsilateral hippocampus and cortex compared to the contralateral hippocampus and cortex after HI in both the DMSO and SB216763 groups (Suppl. 2 A). However, there were no significant changes in Nrf2 protein levels in the nuclear and cytosolic fractions between the ipsilateral and contralateral hemispheres in either the DMSO or the SB216763 group (Suppl. 2 B and C). Taken together data show some detrimental role of HI on the antioxidant defence of the immature brain, but suggest minor involvement of GSK3β in this response.
Fig. 7. Effect of SB216763 administration on mRNA expression of enzymes of the anti-oxidant defense system.
Hippocampal tissue was collected 6 h after HI. The mRNA expression for gclc (A), gclm (B), sod2 (C), tfma (D) and pgc1α (E) was analyzed in ipsilateral (LEFT-black bar) and contralateral (RIGHT-white bar) hippocampus following SB216763 or DMSO administration. The amplification transcripts were normalized against the reference gene gusb. Data are expressed as mean ± SEM, n=8/group. Data were analyzed with one–way ANOVA followed by Holm-Sydak’s multiple comparison test, *p ≤ 0.05.
3.7. SB216763 reduces pro-inflammatory cytokine production
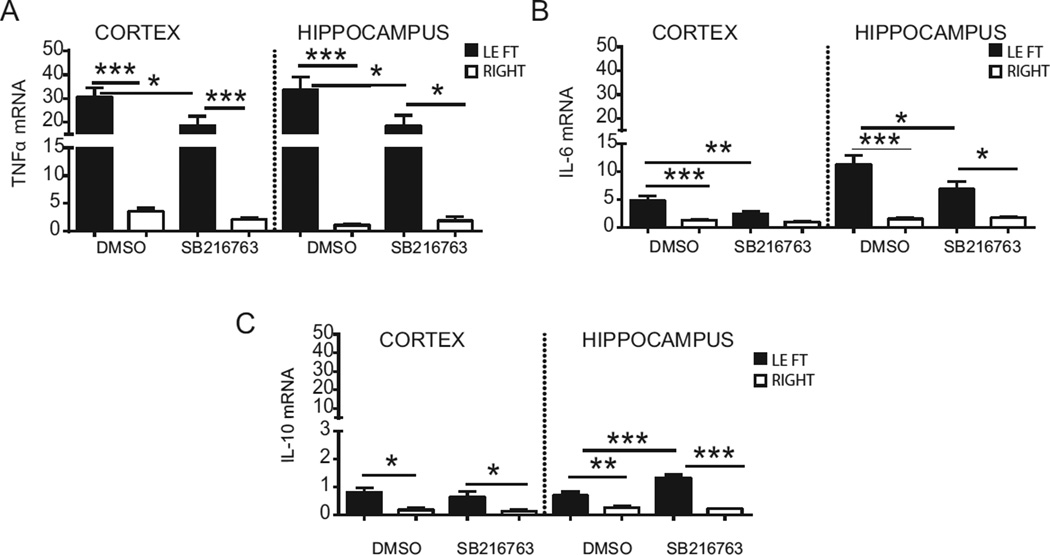
We next asked whether GSK3β might be involved in the inflammatory response after HI and analysed gene expression of cytokines tnfα, Il-6 and interleukin-10 (Il-10) by Q-PCR (Fig.8). In the DMSO-injected group, tnfα was significantly upregulated in the ipsilateral cortex (30.76 ± 3.84) compared to the contralateral cortex (18.64 ± 3.91, p < 0.0005, Fig. 8 A), as well as in the hippocampus (left: 33.58 ± 5.49 vs right: 1.09 ± 0.138; p < 0.0005). SB216763 treatment reduced tnfα expression in the ipsilateral cortex (18.64 ± 3.91; p < 0.05) and ipsilateral hippocampus (18.48 ± 4.47; p < 0.05) compared with the equivalent areas in the DMSO-injected group. Il-6 was upregulated in the cortex (left: 4.78 ± 0.78 vs right: 1.28 ± 0.19; p < 0.0005) and in the hippocampus (left: 11.28 ± 1.66 vs right: 1.5 ± 0.23; p < 0.0005, Fig. 8 B) in the DMSO group. SB216763 halved the Il-6 expression in the ipsilateral cortex (2.44 ± 0.45; p < 0.005) and hippocampus (6.88 ± 1.40; p < 0.05) compared to the DMSO group. Interestingly an increase was detected for Il-10 mRNA in the ipsilateral cortex (left: 0.81 ± 0.16 vs right: 0.17 ± 0.08, p < 0.005) and ipsilateral hippocampus (left: 0.69 ± 0.13 vs right: 0.26 ± 0.05, p < 0.005, Fig. 8 C) after HI in the DMSO group. SB216763 doubled Il-10 expression in the ipsilateral hippocampus in comparison to the ipsilateral hippocampus in the DMSO group (1.32 ± 0.11; p < 0.0005).
Fig. 8. Effect of SB216763 administration on mRNA expression of cytokines.
mRNA expression for tnfα (A), Il-6 (B) and Il-10 (C) were analyzed in ipsilateral (LEFT) and contralateral (RIGHT) cortex and hippocampus 6 h post-HI, following SB216763 or DMSO administration. The amplification transcripts were normalized against the reference gene Gusb. Data are expressed as mean ± SEM, n=8/group. Data were analyzed with one–way ANOVA followed by Holm-Sidak’s multiple comparison test: *p ≤ 0.05; **p ≤ 0.005; ***p ≤ 0.0005.
3.8. HI induces STAT3 activation in glial cells
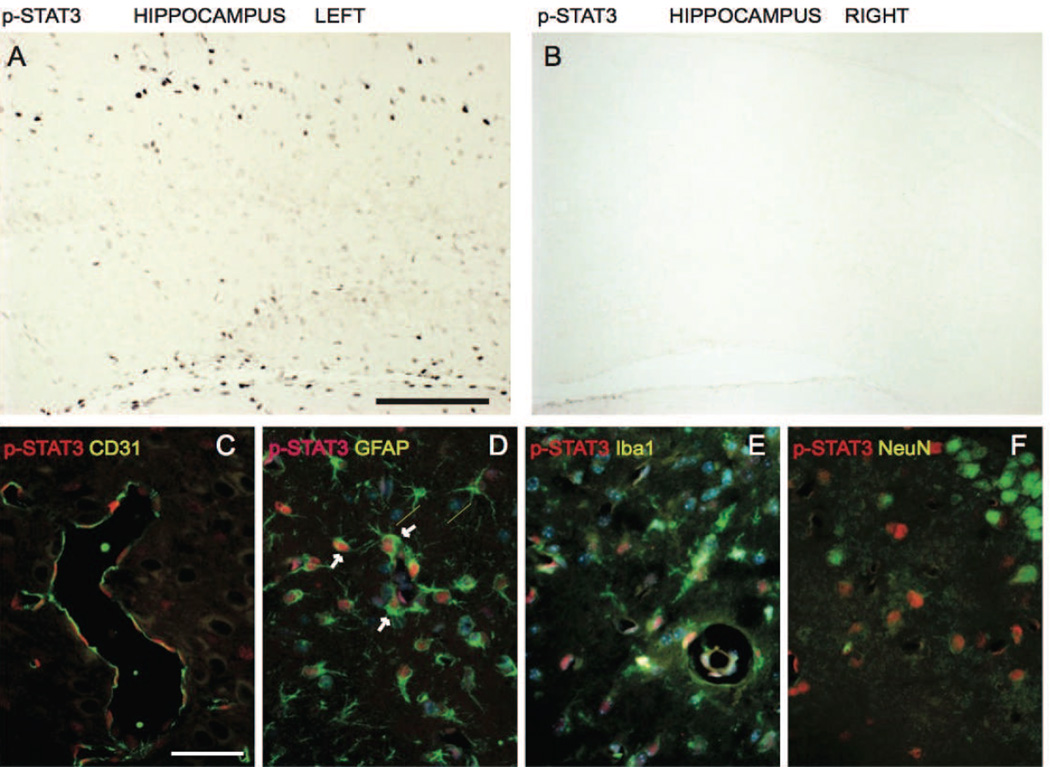
Cytokine release during inflammation is associated with STAT3 activation in inflammatory cells. Therefore we investigated STAT3 activation after HI (Fig. 9). We performed immunofluorescence staining of pSTAT3 (phosphorylated Tyr705 form) with markers selectively labelling neurons (NeuN), astroglia (GFAP), microglia (Iba1/AIF1), and endothelial cells (CD31) at 6 h after neonatal HI. Increase in pSTAT3 is indicative of STAT3 activation as the phosphorylation on the Tyr705 allows protein nuclear translocation and its transcriptional activity (Brierley and Fish, 2005). We found that pSTAT3 was expressed in the nuclear compartment of some cells in the ipsilateral hemisphere, while pSTAT3 immunostaining in the contralateral areas remained negative (Fig. 9 A and B). pSTAT3 labelling co-localized mainly with GFAP positive cells (Fig. 9 D) and to a lesser extent with Iba positive cells (Fig. 9 E) indicating STAT3 induction in glial cells. Co-localisation was also found with endothelial marker CD31 (Fig. 9 C), while pSTAT3 staining was always negative in cells positive for NeuN (Fig. 9 F).
Fig. 9. Immunolocalization of pSTAT3 following hypoxia-ischemia.
Localization of phosphorylated STAT3 (pSTAT3, activated form) by immunohistochemistry in (A) left injured ipsilateral hippocampus and (B) right non-injured hippocampus. Co-localization of pSTAT3 with blood vessel marker CD31 (C), astroglia marker GFAP (D), microglia marker Iba1/AIF1 (E) and neuronal marker NeuN (F). Scale bar is 300µm in A & B and 50µm in C-F.
3.9. SB216763 reduces activation of STAT3 following HI
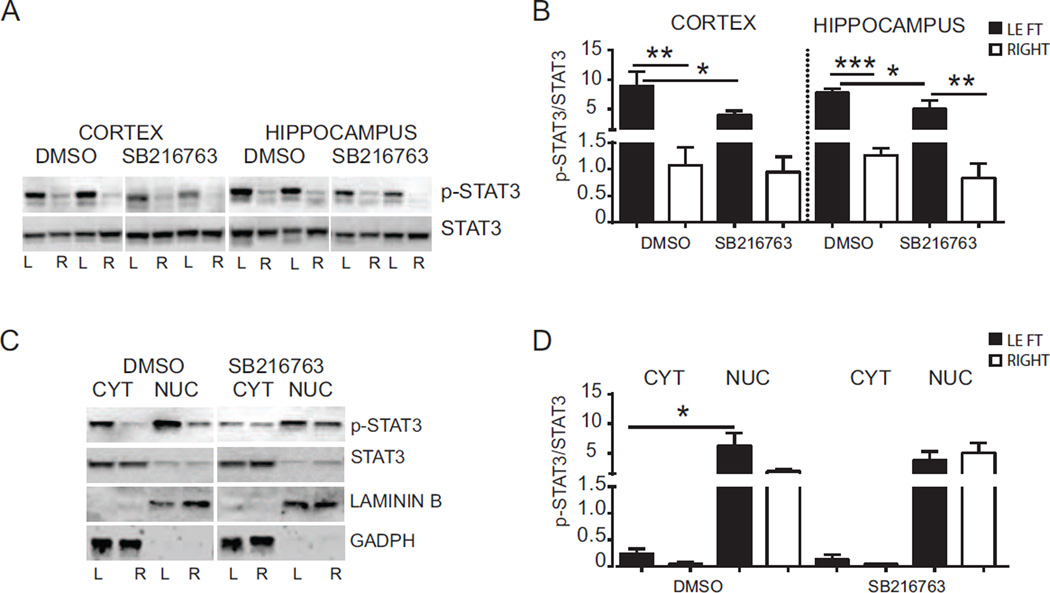
We next examined whether inhibition of GSK3β reduced STAT3 activation after HI. For this purpose we evaluated pSTAT3 and total STAT3 (phosphorylated and non-phosphorylated form) protein expression in cortex and hippocampus samples, both in cytoplasm and nuclear fractions by Western blot (Fig. 10). The changes in the phosphorylation status of STAT3 were examined by normalizing densitometry values obtained for pSTAT3 with those for total STAT3 (pSTAT3/STAT3). Analysis of the DMSO group revealed an increase of pSTAT3/STAT3 in the ipsilateral cortex (left 8.90 ± 2.47 vs right 1.08 ± 0.34; p < 0.005) and hippocampus (left 7.75 ± 0.64 vs right 1.26 ± 0.14; p < 0.0005) compared to the contralateral cortex and hippocampus after HI (Fig. 10 A and B). Treatment with SB216763 reduced the pSTAT3 expression both in the ipsilateral cortex (DMSO 8.90 ± 2.47 vs SB216763 3.92 ± 0.78; p < 0.05) and hippocampus (DMSO 7.75 ± 0.64 vs SB216763 4.99 ± 1.48; p < 0.05) (Fig. 10 A and B). Sub-cellular analysis of the ipsilateral hemisphere in DMSO treated animals revealed higher levels of pSTAT3/STAT3 in the nuclear fraction in comparison with the cytoplasmic portion (left cytoplasm: 0.24 ± 0.09 vs left nuclear: 6.22 ± 2.20; p < 0.005) (Fig. 10 C and D), indicating that HI promotes translocation of activated STAT3 from the cytoplasm to the nucleus. Treatment with SB216763 showed no significant difference for pSTAT3 between these fractions, although a similar trend was observed.
Fig. 10. Effect of SB216763 administration on STAT3 activation after hypoxia-ischemia.
(A) Western blots of pSTAT3 and STAT3 6 h after HI in the cortex and hippocampus from mice injected with SB216763 or vehicle (DMSO). Blots are shown for ipslateral (L) and contralateral (R) cortex and hippocampus. (B) Densitometric analysis of phosphorylation status of STAT3 protein in cortex and hippocampus from mice injected with SB216763 or vehicle (DMSO) at 6 h after HI. Graphs are presented as ratio between density value of pSTAT3 and STAT3 for each animal sample (pSTAT3/STAT3). Data are shown for ipsilateral (LEFT-black bars) and contralateral (RIGHT-white bars) cortex and hippocampus (n=8/group). (C) Western blots of pSTAT3 and STAT3 in cytoplasmic and nuclear fractions from mice injected with SB216763 or vehicle (DMSO) at 6 h after HI. Blots are shown for ipsilateral (L) and contralateral (R) hemispheres after HI. GADPH and LAMININ B blots represent loading controls showing the purity of cytoplasmic and nuclear fractions, respectively. (D) Densitometric analysis 6 h after HI of pSTAT3/STAT3 in cytoplasmic and nuclear fractions from mice injected with SB216763 or vehicle (DMSO). Data are shown in ipsilateral (LEFT-black bars) and contralateral (RIGHT-white bars) hemispheres (n=7/group). Data were analyzed with one–way ANOVA followed by Holm-Sidak’s multiple comparison test: **p ≤ 0.005; **p ≤0.005; ***p ≤0.0005.
4. Discussion
In this study, we show for the first time that selective inhibition of the GSK3β pathway is neuroprotective in the neonatal brain undergoing HI. Inhibition of GSK3β resulted in reduced caspase-3 activation, restoration of endogenous antioxidant systems and an ameliorated pro-inflammatory response following neonatal HI.
In our experimental setting activation of GSK3β was evident as early as 2 h after HI in the hippocampus, but not in the cortex. This result is interesting as it indicates a close relation between GSK3β activity and brain injury, which we have previously shown is evident in the hippocampal area already at 2 h after HI (Ek et al., 2015). Prior studies have indirectly indicated GSK3β involvement in neonatal brain injury. It was demonstrated that neuroprotective effects of insulin-like growth factor 1 and hexarelin in neonatal HI was associated with normalization of Ser9 phosphorylation of GSK3β (Brywe et al., 2005a; Brywe et al., 2005b). Recently, in a similar rat model of neonatal brain injury GSK3β was suggested to mediate axonal injury after HI (Xiong et al., 2012). Moreover, lithium has been reported to protect the neonatal rat brain after HI, via GSK3β inactivation (Li et al., 2010). In our studies where we used SB216763, a more specific GSKβ inhibitor than lithium (Coghlan et al., 2000) we can confirm Li’s results as we demonstrate that GSK3β inactivation mitigates caspase-3 activity and neuronal loss, further strengthening a role for GSK3β in neonatal brain injury.
The reduction in caspase-3 activity suggests that SB216763 reduced pro-apoptotic processes after HI. Consistent with these findings, we found that GSK3β inhibition induced accumulation of β-catenin in the hippocampus. β-catenin has been shown to promote expression of anti-apoptotic proteins like Bcl-2 and survivin (Beurel and Jope, 2006; Kaga et al., 2006) and loss of β-catenin is believed to increase neuronal vulnerability to apoptosis (Beurel and Jope, 2006; Zhang et al., 1998).
Previous studies have reported that GSK3 inactivation in the embryo promotes neural progenitor proliferation (Kim et al., 2009), while GSK3 activation has been implicated in neuronal differentiation (Hur and Zhou, 2010). However, we did not find that GSK3β inhibition altered neuronal cell proliferation or neuronal progenitor survival in the neonatal brain. The differences between the studies may be explained by the different developmental stages examined.
GSK3β has been shown to deregulate oxidative metabolism by inactivating pyruvate dehydrogenase (Hoshi et al., 1996), complex I activity and ATP production (King et al., 2008). On the other hand GSK3β inhibition activates the antioxidant response that reduces damage and promotes mitochondrial biogenesis during ischemic cerebral injury (Valerio et al., 2011). Consistent with these findings we found that SB216763 opposed HI effects on expression of pgc1α, a gene involved in mitochondrial biogenesis, indicating that activated GSK3β may negatively affect mitochondrial metabolism in the developing brain, which has been suggested to contribute to HI injury (Hagberg et al., 2014).
Earlier studies showed a correlation between GSK3β activity and dysfunctional Nrf2-mediated transcription leading to decreased protection against oxidative stress (Rada et al., 2012; Rojo et al., 2008a; Rojo et al., 2008b; Salazar et al., 2006). Here we confirm a negative role for active GSK3β on transcription of anti-oxidant genes such as sod2 and pgc1α. The transcription of these genes can be activated by several means, one of which is translocation of Nrf2 to the nucleus. Our data on subcellular fractionation of Nrf2 did not reveal any significant change in nuclear Nrf2 between DMSO-injected and SB216763 treated animals. However, a clear trend towards an increase in nuclear Nrf2 after SB216763 was demonstrated (Suppl. Fig. 2). It is important to note that the subcellular fractionation could only be performed with whole hemisphere extract, due to the minute tissue of hippocampus where the damage is more severe (Ek et al., 2015). As dephosphorylation of GSKβ was evident earlier in hippocampus than in cortex after HI (Fig. 2) one possible mechanism of SB216763-induced restoration of transcription of genes coding for the glutathione producing enzymes, sod2 and pgc1α in hippocampus is increased Nrf2-mediated transcription. However, there are other mechanisms that are equally plausible. Thus it has been shown that inhibition of GSK3β can upregulate glutathione and the cysteine/glutamate transporter Xc- in a non-Nrf2 way (Lewerenz et al., 2014). This GSK3-regulated mechanism involves phosphorylation of eukaryotic initiation factor 2a (eIF2a) by the eIF2a-kinase general control non-derepressible-2 (GCN-2) and activation of ATF4 (Lewerenz et al., 2014).
STAT3 and GSK3β have been correlated with neuroinflammation in the adult brain and a previous study reported presence of STAT3 positive cells after neonatal HI (Shrivastava et al., 2013). We found an increase in phosphorylated STAT3 (activated) in the nucleus of glial cells following HI, accompanied by induction of mRNA of cytokines like Il-6, tnfα and Il-10, which suggests participation of STAT3 in neonatal brain inflammation. In inflammatory cells, including astroglia and microglia, GSK3β has been associated with phosphorylation of STAT3 and transcription activation (Beurel and Jope, 2008). In support, we found that GSK3β inhibition reduced STAT3 phosphorylation and its nuclear translocation. This effect was also correlated with a reduction in Il-6 and tnfα expression after SB216763 administration, while there was an increase of Il-10, which has been shown to be neuroprotective (Mesples et al., 2003). The differential and neuroprotective effect of GSK3β inhibition on pro-inflammatory vs anti-inflammatory cytokines is intriguing. Mechanistically, the positive effect of GSK3β inhibition on IL-10 expression may be due to PKC-induced ERK1/2 activation as shown earlier in LPS-induced endotoxemia where a GSK3β inhibitor increased IL-10 expression, whereas IL-12 and TNFα expressions were down-regulated (Noh et al., 2012).
To conclude, inflammation, oxidative stress and cell apoptosis are all pathophysiological responses to HI, leading to injury in the developing brain. Our study is promising as it shows that pharmacological inhibition of GSK3β reduces apoptosis and inflammatory responses by down-regulating STAT3 activation and results in reduced brain injury after HI.
Supplementary Material
Cerebral hypoxia-ischemia (HI) induced activation of GSK3β in the neonatal brain.
Selective inhibition of GSK3β was neuroprotective in neonatal brain injury
HI induced activation and nuclear translocation of STAT3 in glial cells.
GSK3β inhibition reduced oxidative/inflammatory responses via STAT3 downregulation
Acknowledgements
We are grateful to Anna-Lena Leverin and Pernilla Svedin for expert advice on methods. We thank Carl Bergh for his technical help in the preparation of tissues for this study.
The study was supported by the Leducq Foundation (DSRR_P34404), the Swedish Medical Research Council (VR2012-3500), ALF-LUA (ALFGBG-432291), the European Union grant FP7 (Neurobid, HEALTHF2-2009-241778), National Institute of Health (GM-44842), the Swedish Brain Foundation (FO2013-095), the Byggmästare Olle Engkvist Foundation, The Åhlen Foundation, Magnus Bergwall Foundation, the Åke Wiberg Foundation, the Wilhelm & Martina Lundgren Foundation.
Abbreviations
- HI
hypoxia-ischemia
- GSK3β
glycogen synthase kinase 3β
- STAT3
signal transducer and activator of transcription
- PND
postnatal day
- glcl
γglutamyl cysteine ligase catalytic
- glcm
γglutamyl cysteine ligase modulatory
- pgc1α
peroxisome proliferator-activated receptor gamma
- sod2
superoxide dismutase 2
- tfma
mitochondrial transcription factor A
- tnfα
tumor necrosis factor alpha
- Il-6
interleukine-6
- Il-10
interleukine-10
- GFAP
glial fibrillary acidic protein
- NeuN
neuronal nuclear antigen
- Iba1
ionized calcium binding adaptor molecule 1
- DCX
doublecortin
- CD31
cluster of differentiation 31
- MAP2
microtubule-associated protein 2
- HEPES
4-(2-hydroxyethyl)-1-piperazineethanesulfonic acid
- EDTA
ethylenediaminetetraacetic acid
- EGTA
ethyleneglycol tetraacetate
- DTT
dithiothreitol
- DMSO
dimethyl sulfoxide
- eIF2a
eukaryotic initiation factor 2a
- GCN-2
general control non-derepressible-2
- ATF4
activating transcription factor 4
- NRF2
Nuclear factor (erythroid-derived 2) - like 2
- SGZ
subgranular zone
Footnotes
Publisher's Disclaimer: This is a PDF file of an unedited manuscript that has been accepted for publication. As a service to our customers we are providing this early version of the manuscript. The manuscript will undergo copyediting, typesetting, and review of the resulting proof before it is published in its final citable form. Please note that during the production process errors may be discovered which could affect the content, and all legal disclaimers that apply to the journal pertain.
References
- Beurel E, Jope RS. The paradoxical pro- and anti-apoptotic actions of GSK3 in the intrinsic and extrinsic apoptosis signaling pathways. Prog Neurobiol. 2006;79:173–189. doi: 10.1016/j.pneurobio.2006.07.006. [DOI] [PMC free article] [PubMed] [Google Scholar]
- Beurel E, Jope RS. Differential regulation of STAT family members by glycogen synthase kinase-3. J Biol Chem. 2008;283:21934–21944. doi: 10.1074/jbc.M802481200. [DOI] [PMC free article] [PubMed] [Google Scholar]
- Beurel E, Jope RS. Lipopolysaccharide-induced interleukin-6 production is controlled by glycogen synthase kinase-3 and STAT3 in the brain. J Neuroinflammation. 2009;6:9. doi: 10.1186/1742-2094-6-9. [DOI] [PMC free article] [PubMed] [Google Scholar]
- Blomgren K, Zhu C, Wang X, Karlsson JO, Leverin AL, Bahr BA, Mallard C, Hagberg H. Synergistic activation of caspase-3 by m-calpain after neonatal hypoxia-ischemia: a mechanism of "pathological apoptosis"? J Biol Chem. 2001;276:10191–10198. doi: 10.1074/jbc.M007807200. [DOI] [PubMed] [Google Scholar]
- Brierley MM, Fish EN. Stats: multifaceted regulators of transcription. J Interferon Cytokine Res. 2005;25:733–744. doi: 10.1089/jir.2005.25.733. [DOI] [PubMed] [Google Scholar]
- Brywe KG, Leverin AL, Gustavsson M, Mallard C, Granata R, Destefanis S, Volante M, Hagberg H, Ghigo E, Isgaard J. Growth hormone-releasing peptide hexarelin reduces neonatal brain injury and alters Akt/glycogen synthase kinase-3beta phosphorylation. Endocrinology. 2005a;146:4665–4672. doi: 10.1210/en.2005-0389. [DOI] [PubMed] [Google Scholar]
- Brywe KG, Mallard C, Gustavsson M, Hedtjarn M, Leverin AL, Wang X, Blomgren K, Isgaard J, Hagberg H. IGF-I neuroprotection in the immature brain after hypoxia-ischemia, involvement of Akt and GSK3beta? Eur J Neurosci. 2005b;21:1489–1502. doi: 10.1111/j.1460-9568.2005.03982.x. [DOI] [PubMed] [Google Scholar]
- Ciani L, Salinas PC. WNTs in the vertebrate nervous system: from patterning to neuronal connectivity. Nat Rev Neurosci. 2005;6:351–362. doi: 10.1038/nrn1665. [DOI] [PubMed] [Google Scholar]
- Coghlan MP, Culbert AA, Cross DA, Corcoran SL, Yates JW, Pearce NJ, Rausch OL, Murphy GJ, Carter PS, Roxbee Cox L, Mills D, Brown MJ, Haigh D, Ward RW, Smith DG, Murray KJ, Reith AD, Holder JC. Selective small molecule inhibitors of glycogen synthase kinase-3 modulate glycogen metabolism and gene transcription. Chem Biol. 2000;7:793–803. doi: 10.1016/s1074-5521(00)00025-9. [DOI] [PubMed] [Google Scholar]
- Correa F, Ljunggren E, Patil J, Wang X, Hagberg H, Mallard C, Sandberg M. Time-dependent effects of systemic lipopolysaccharide injection on regulators of antioxidant defence Nrf2 and PGC-1alpha in the neonatal rat brain. Neuroimmunomodulation. 2013;20:185–193. doi: 10.1159/000347161. [DOI] [PMC free article] [PubMed] [Google Scholar]
- del Ser T, Steinwachs KC, Gertz HJ, Andres MV, Gomez-Carrillo B, Medina M, Vericat JA, Redondo P, Fleet D, Leon T. Treatment of Alzheimer’s disease with the GSK-3 inhibitor tideglusib: a pilot study. J Alzheimers Dis. 2013;33:205–215. doi: 10.3233/JAD-2012-120805. [DOI] [PubMed] [Google Scholar]
- Ek CJ, D’Angelo B, Baburamani A, Lehner C, Leverin AL, Smith LP, Nilsson H, Svedin PHH, Mallard C. Brain barrier properties and cerebral blood flow in neonatal mice exposed to cerebral hypoxia-ischemia. Journal of Cerebral Blood Flow and Metabolism. 2015;35:818–827. doi: 10.1038/jcbfm.2014.255. [DOI] [PMC free article] [PubMed] [Google Scholar]
- Fukui M, Choi HJ, Zhu BT. Mechanism for the protective effect of resveratrol against oxidative stress-induced neuronal death. Free Radic Biol Med. 2010;49:800–813. doi: 10.1016/j.freeradbiomed.2010.06.002. [DOI] [PMC free article] [PubMed] [Google Scholar]
- Hagberg H, Mallard C. Antenatal brain injury: aetiology and possibilities of prevention. Semin Neonatol. 2000;5:41–51. doi: 10.1053/siny.1999.0114. [DOI] [PubMed] [Google Scholar]
- Hagberg H, Mallard C, Rousset CI, Thornton C. Mitochondria: hub of injury responses in the developing brain. Lancet Neurol. 2014;13:217–232. doi: 10.1016/S1474-4422(13)70261-8. [DOI] [PubMed] [Google Scholar]
- Hedtjarn M, Leverin AL, Eriksson K, Blomgren K, Mallard C, Hagberg H. Interleukin-18 involvement in hypoxic-ischemic brain injury. J Neurosci. 2002;22:5910–5919. doi: 10.1523/JNEUROSCI.22-14-05910.2002. [DOI] [PMC free article] [PubMed] [Google Scholar]
- Hoshi M, Takashima A, Noguchi K, Murayama M, Sato M, Kondo S, Saitoh Y, Ishiguro K, Hoshino T, Imahori K. Regulation of mitochondrial pyruvate dehydrogenase activity by tau protein kinase I/glycogen synthase kinase 3beta in brain. Proc Natl Acad Sci U S A. 1996;93:2719–2723. doi: 10.1073/pnas.93.7.2719. [DOI] [PMC free article] [PubMed] [Google Scholar]
- Justicia C, Gabriel C, Planas AM. Activation of the JAK/STAT pathway following transient focal cerebral ischemia: signaling through Jak1 and Stat3 in astrocytes. Glia. 2000;30:253–270. doi: 10.1002/(sici)1098-1136(200005)30:3<253::aid-glia5>3.0.co;2-o. [DOI] [PubMed] [Google Scholar]
- Kaga S, Zhan L, Altaf E, Maulik N. Glycogen synthase kinase-3beta/beta-catenin promotes angiogenic and anti-apoptotic signaling through the induction of VEGF, Bcl-2 and survivin expression in rat ischemic preconditioned myocardium. J Mol Cell Cardiol. 2006;40:138–147. doi: 10.1016/j.yjmcc.2005.09.009. [DOI] [PubMed] [Google Scholar]
- King TD, Clodfelder-Miller B, Barksdale KA, Bijur GN. Unregulated mitochondrial GSK3beta activity results in NADH: ubiquinone oxidoreductase deficiency. Neurotox Res. 2008;14:367–382. doi: 10.1007/BF03033861. [DOI] [PMC free article] [PubMed] [Google Scholar]
- Lewerenz J, Baxter P, Kassubek R, Albrecht P, Van Liefferinge J, Westhoff MA, Halatsch ME, Karpel-Massler G, Meakin PJ, Hayes JD, Aronica E, Smolders I, Ludolph AC, Methner A, Conrad M, Massie A, Hardingham GE, Maher P. Phosphoinositide 3-kinases upregulate system xc(-) via eukaryotic initiation factor 2alpha and activating transcription factor 4 - A pathway active in glioblastomas and epilepsy. Antioxid Redox Signal. 2014;20:2907–2922. doi: 10.1089/ars.2013.5455. [DOI] [PMC free article] [PubMed] [Google Scholar]
- Li Q, Li H, Roughton K, Wang X, Kroemer G, Blomgren K, Zhu C. Lithium reduces apoptosis and autophagy after neonatal hypoxia-ischemia. Cell Death Dis. 2010;1:e56. doi: 10.1038/cddis.2010.33. [DOI] [PMC free article] [PubMed] [Google Scholar]
- Linseman DA, Butts BD, Precht TA, Phelps RA, Le SS, Laessig TA, Bouchard RJ, Florez-McClure ML, Heidenreich KA. Glycogen synthase kinase-3beta phosphorylates Bax and promotes its mitochondrial localization during neuronal apoptosis. J Neurosci. 2004;24:9993–10002. doi: 10.1523/JNEUROSCI.2057-04.2004. [DOI] [PMC free article] [PubMed] [Google Scholar]
- Maixner DW, Weng HR. The Role of Glycogen Synthase Kinase 3 Beta in Neuroinflammation and Pain. J Pharm Pharmacol (Los Angel) 2013;1:001. doi: 10.13188/2327-204X.1000001. [DOI] [PMC free article] [PubMed] [Google Scholar]
- Martin M, Rehani K, Jope RS, Michalek SM. Toll-like receptor-mediated cytokine production is differentially regulated by glycogen synthase kinase 3. Nat Immunol. 2005;6:777–784. doi: 10.1038/ni1221. [DOI] [PMC free article] [PubMed] [Google Scholar]
- Mesples B, Plaisant F, Gressens P. Effects of interleukin-10 on neonatal excitotoxic brain lesions in mice. Brain Res Dev Brain Res. 2003;141:25–32. doi: 10.1016/s0165-3806(02)00636-3. [DOI] [PubMed] [Google Scholar]
- Nijboer CH, Groenendaal F, Kavelaars A, Hagberg HH, van Bel F, Heijnen CJ. Gender-specific neuroprotection by 2-iminobiotin after hypoxia-ischemia in the neonatal rat via a nitric oxide independent pathway. J Cereb Blood Flow Metab. 2007;27:282–292. doi: 10.1038/sj.jcbfm.9600342. [DOI] [PubMed] [Google Scholar]
- Noh KT, Son KH, Jung ID, Kang HK, Hwang SA, Lee WS, You JC, Park YM. Protein kinase C delta (PKCdelta)-extracellular signal-regulated kinase 1/2 (ERK1/2) signaling cascade regulates glycogen synthase kinase-3 (GSK-3) inhibition-mediated interleukin-10 (IL-10) expression in lipopolysaccharide (LPS)-induced endotoxemia. J Biol Chem. 2012;287:14226–14233. doi: 10.1074/jbc.M111.308841. [DOI] [PMC free article] [PubMed] [Google Scholar]
- Northington FJ, Chavez-Valdez R, Martin LJ. Neuronal cell death in neonatal hypoxia-ischemia. Ann Neurol. 2011;69:743–758. doi: 10.1002/ana.22419. [DOI] [PMC free article] [PubMed] [Google Scholar]
- Perez-Costas E, Gandy JC, Melendez-Ferro M, Roberts RC, Bijur GN. Light and electron microscopy study of glycogen synthase kinase-3beta in the mouse brain. PLoS One. 2010;5:e8911. doi: 10.1371/journal.pone.0008911. [DOI] [PMC free article] [PubMed] [Google Scholar]
- Rada P, Rojo AI, Evrard-Todeschi N, Innamorato NG, Cotte A, Jaworski T, Tobon-Velasco JC, Devijver H, Garcia-Mayoral MF, Van Leuven F, Hayes JD, Bertho G, Cuadrado A. Structural and functional characterization of Nrf2 degradation by the glycogen synthase kinase 3/beta-TrCP axis. Mol Cell Biol. 2012;32:3486–3499. doi: 10.1128/MCB.00180-12. [DOI] [PMC free article] [PubMed] [Google Scholar]
- Rojo AI, Rada P, Egea J, Rosa AO, Lopez MG, Cuadrado A. Functional interference between glycogen synthase kinase-3 beta and the transcription factor Nrf2 in protection against kainate-induced hippocampal cell death. Mol Cell Neurosci. 2008a;39:125–132. doi: 10.1016/j.mcn.2008.06.007. [DOI] [PubMed] [Google Scholar]
- Rojo AI, Sagarra MR, Cuadrado A. GSK-3beta down-regulates the transcription factor Nrf2 after oxidant damage: relevance to exposure of neuronal cells to oxidative stress. J Neurochem. 2008b;105:192–202. doi: 10.1111/j.1471-4159.2007.05124.x. [DOI] [PubMed] [Google Scholar]
- Salazar M, Rojo AI, Velasco D, de Sagarra RM, Cuadrado A. Glycogen synthase kinase-3beta inhibits the xenobiotic and antioxidant cell response by direct phosphorylation and nuclear exclusion of the transcription factor Nrf2. J Biol Chem. 2006;281:14841–14851. doi: 10.1074/jbc.M513737200. [DOI] [PubMed] [Google Scholar]
- Shrivastava K, Llovera G, Recasens M, Chertoff M, Gimenez-Llort L, Gonzalez B, Acarin L. Temporal expression of cytokines and signal transducer and activator of transcription factor 3 activation after neonatal hypoxia/ischemia in mice. Dev Neurosci. 2013;35:212–225. doi: 10.1159/000348432. [DOI] [PubMed] [Google Scholar]
- Sriram K, Benkovic SA, Hebert MA, Miller DB, O’Callaghan JP. Induction of gp130-related cytokines and activation of JAK2/STAT3 pathway in astrocytes precedes up-regulation of glial fibrillary acidic protein in the 1-methyl-4-phenyl-1,2,3,6-tetrahydropyridine model of neurodegeneration: key signaling pathway for astrogliosis in vivo? J Biol Chem. 2004;279:19936–19947. doi: 10.1074/jbc.M309304200. [DOI] [PubMed] [Google Scholar]
- Svedin P, Hagberg H, Savman K, Zhu C, Mallard C. Matrix metalloproteinase-9 gene knock-out protects the immature brain after cerebral hypoxia-ischemia. J Neurosci. 2007;27:1511–1518. doi: 10.1523/JNEUROSCI.4391-06.2007. [DOI] [PMC free article] [PubMed] [Google Scholar]
- Valerio A, Bertolotti P, Delbarba A, Perego C, Dossena M, Ragni M, Spano P, Carruba MO, De Simoni MG, Nisoli E. Glycogen synthase kinase-3 inhibition reduces ischemic cerebral damage, restores impaired mitochondrial biogenesis and prevents ROS production. J Neurochem. 2011;116:1148–1159. doi: 10.1111/j.1471-4159.2011.07171.x. [DOI] [PubMed] [Google Scholar]
- Wang MJ, Huang HY, Chen WF, Chang HF, Kuo JS. Glycogen synthase kinase-3beta inactivation inhibits tumor necrosis factor-alpha production in microglia by modulating nuclear factor kappaB and MLK3/JNK signaling cascades. J Neuroinflammation. 2010;7:99. doi: 10.1186/1742-2094-7-99. [DOI] [PMC free article] [PubMed] [Google Scholar]
- Watcharasit P, Bijur GN, Song L, Zhu J, Chen X, Jope RS. Glycogen synthase kinase-3beta (GSK3beta) binds to and promotes the actions of p53. J Biol Chem. 2003;278:48872–48879. doi: 10.1074/jbc.M305870200. [DOI] [PMC free article] [PubMed] [Google Scholar]
- Woodgett JR. Molecular cloning and expression of glycogen synthase kinase-3/factor A. EMBO J. 1990;9:2431–2438. doi: 10.1002/j.1460-2075.1990.tb07419.x. [DOI] [PMC free article] [PubMed] [Google Scholar]
- Xiong T, Tang J, Zhao J, Chen H, Zhao F, Li J, Qu Y, Ferriero D, Mu D. Involvement of the Akt/GSK-3beta/CRMP-2 pathway in axonal injury after hypoxic-ischemic brain damage in neonatal rat. Neuroscience. 2012;216:123–132. doi: 10.1016/j.neuroscience.2012.04.052. [DOI] [PubMed] [Google Scholar]
- Yuskaitis CJ, Jope RS. Glycogen synthase kinase-3 regulates microglial migration, inflammation, and inflammation-induced neurotoxicity. Cell Signal. 2009;21:264–273. doi: 10.1016/j.cellsig.2008.10.014. [DOI] [PMC free article] [PubMed] [Google Scholar]
- Zhang Z, Hartmann H, Do VM, Abramowski D, Sturchler-Pierrat C, Staufenbiel M, Sommer B, van de Wetering M, Clevers H, Saftig P, De Strooper B, He X, Yankner BA. Destabilization of beta-catenin by mutations in presenilin-1 potentiates neuronal apoptosis. Nature. 1998;395:698–702. doi: 10.1038/27208. [DOI] [PubMed] [Google Scholar]
Associated Data
This section collects any data citations, data availability statements, or supplementary materials included in this article.


