Abstract
Polymer solar cells have been spotlighted due to their potential for low-cost manufacturing but their efficiency is still less than required for commercial application as lightweight/flexible modules. Forming a dipole layer at the electron-collecting interface has been suggested as one of the more attractive approaches for efficiency enhancement. However, only a few dipole layer material types have been reported so far, including only one non-ionic (charge neutral) polymer. Here we show that a further neutral polymer, namely poly(2-ethyl-2-oxazoline) (PEOz) can be successfully used as a dipole layer. Inclusion of a PEOz layer, in particular with a nanodot morphology, increases the effective work function at the electron-collecting interface within inverted solar cells and thermal annealing of PEOz layer leads to a state-of-the-art 10.74% efficiency for single-stack bulk heterojunction blend structures comprising poly[4,8-bis(5-(2-ethylhexyl)thiophen-2-yl)benzo[1,2-b:4,5-b′]dithiophene-alt-3-fluorothieno[3,4-b]thiophene-2-carboxylate] as donor and [6,6]-phenyl-C71-butyric acid methyl ester as acceptor.
 Forming a dipole layer at the electron-collecting interface is a proposed method of efficiency enhancement in solar cells. Here, Nam et al. report the use of PEOz as a dipole layer, which increases the work function at the electron-collecting interface within the polymer solar cell leading to an efficiency of 10.7%.
Polymer solar cells have been extensively studied because of their potential to enable high-throughput, low-temperature roll-to-roll fabrication of flexible solar modules1,2,3,4,5,6,7. Since the landmark early works on the concept of polymer:fullerene bulk heterojunction (BHJ) solar cells8,9,10,11,12,13,14, the power conversion efficiency (PCE) has been remarkably improved up to ∼10% for polymer:fullerene solar cells by introducing new light-absorbing conjugated polymers and fullerene derivatives15,16,17,18,19,20,21,22,23,24,25,26. Most of the high-efficiency polymer:fullerene solar cells adopt an inverted-type device structure, because a stable charge-collecting buffer layer can be made using metal oxides such as zinc oxide (ZnO) and titanium oxide instead of poly(3,4-ethylenedioxythiophene):poly(styrenesulfonate) (PEDOT:PSS). PEDOT:PSS is strongly acidic, leading to deterioration of the active layers and/or bottom electrodes in the case of normal-type device structure27,28. Moves have also been made to replace PEDOT:PSS with alternative hole-collecting buffer layers, such as CuSCN29,30.
In the case of inverted polymer:fullerene solar cells, further efficiency enhancement can be achieved by applying an organic interfacial layer (interlayer) between the electron-collecting buffer layer (ECBL)—typically a metal oxide—and the BHJ photogeneration layer. The dipolar nature of the interlayer results in a larger built-in potential and enhanced electron transfer from the fullerene lowest unoccupied molecular orbital31,32. Another role that such interlayers can perform is to improve adhesion between the metal oxide and BHJ layers33,34. Polymer interlayers that lead to high efficiencies can be divided into two categories. First, charged polymers with counter-ions such as PFNBr, PFN-OH, WPF-oxy-F, PFNSO, PF6NO, P3ImHT, PTMAHT and so on35,36,37,38,39,40,41,42,43. Concerns exist, however, over cost, tendency to aggregate and the exciton-quenching and/or charge-carrier trapping effects of the ionic species. Second, neutral polymers, for which the key example reported to date is poly(ethylene imine) (PEI) (also known as poly(ethylene imine)-ethoxylated)44,45,46,47. PEI is expected to be relatively free from exciton-quenching and/or charge-trapping effects. Interestingly, PEI is typically synthesized from poly(2-ethyl-2-oxazoline) (PEOz, Fig. 1a) by hydrolysis and/or other reactions48,49,50, offering the intriguing prospect of using PEOz in its place. Considering the presence of nitrogen atoms in the well-defined backbone of PEOz, it is expected that PEOz chains can act as an electron donor in a similar manner to PEI when they contact the surface of electron-accepting materials. However, PEOz has never been tried for solar cell applications, even though it has been used for biomedical applications such as drug delivery and biosensors because of its excellent biocompatibility and stealth behaviour51,52,53,54,55.
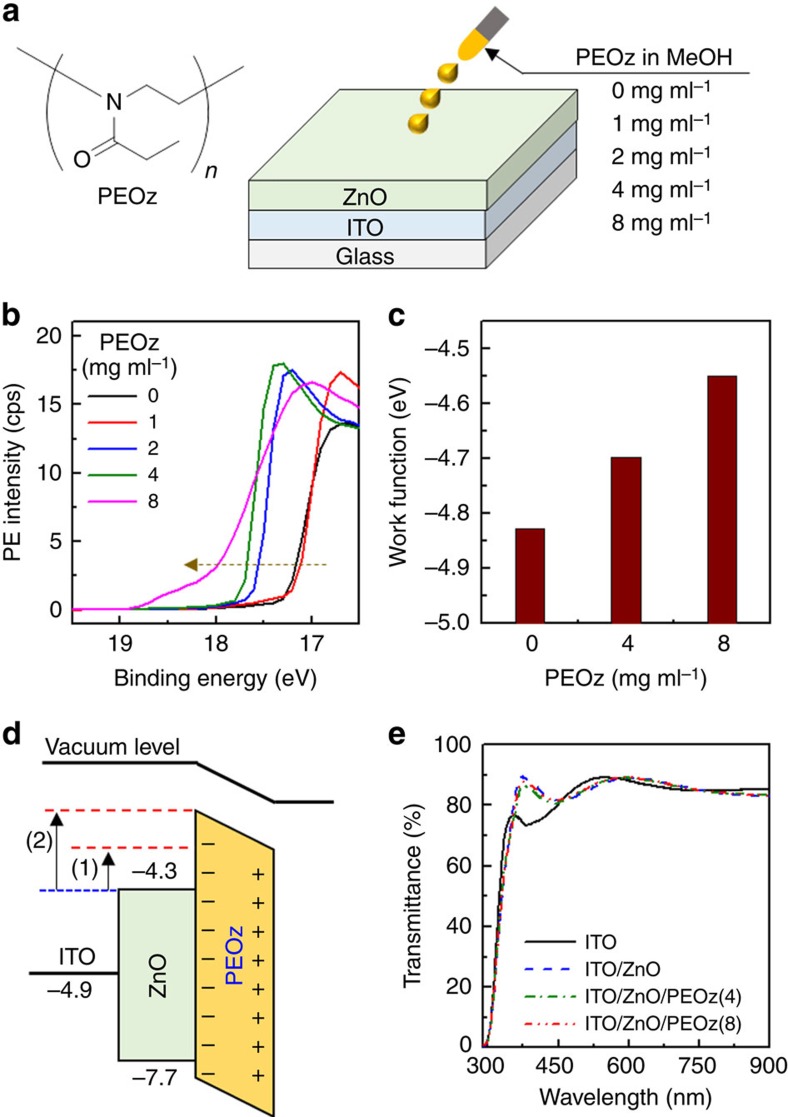
Figure 1. PEOz-modified ZnO layer.
(a) Chemical structure of PEOz and schematic of PEOz coating on the ZnO ECBL. (b) Energy cutoff region UPS spectra as a function of PEOz concentration. (c) Work function energies for PEOz-coated ZnO, measured using the EFM system. (d) Simplified energy band diagram for the work function shift in the ZnO layer resulting from PEOz addition: (1) 0.15 eV for 4 mg ml−1 and (2) 0.28 eV for 8 mg ml−1 PEOz methanol solutions. (e) Optical transmittance spectra for ITO, ITO/ZnO and ITO/ZnO/PEOz, where PEOz(4) and PEOz(8) denote films deposited from 4 and 8 mg ml−1 solutions.
In this study, we report the use of PEOz as a cathode interlayer in inverted BHJ solar cells with ZnO as ECBL. The polymer:fullerene BHJ layer that we used comprises poly[4,8-bis(5-(2-ethylhexyl)thiophen-2-yl)benzo[1,2-b:4,5-b′]dithiophene-alt-3-fluorothieno[3,4-b]thiophene-2-carboxylate] (PTB7-Th) and [6,6]-phenyl-C71-butyric acid methyl ester (PC71BM). PEOz layers were spin coated from methanol and the influence of solution concentration (thickness) on film morphology and work function was investigated by atomic force microscopy (AFM), Auger electron microscopy (AEM), scanning electron microscopy (SEM), ultraviolet photoelectron spectroscopy (UPS) and electric force microscopy (EFM). A distinctive nanodot (ND) morphology was obtained for ∼4 mg ml−1 PEOz solution concentrations, resulting in maximum PCE=10.74%. Korea Institute of Energy Research-certified performance data for a slightly less optimized (PCE=9.6%) PEOz interlayer solar cell are presented.
Results and Discussion
PEOz-induced changes in ZnO work function
As a first step, we examined the effect of PEOz interlayers on the ECBL work function. PEOz films were spin coated (1,500 r.p.m.) from different methanol solution concentrations (Fig. 1a) and after drying the PEOz-coated ZnO samples were subjected to UPS and EFM measurements (c.f. details in Methods section). As observed in Fig. 1b, the cutoff part of the UPS spectrum shifted towards higher binding energy as the PEOz solution concentration increased, indicating a reduction in the magnitude of the ZnO work function with increasing coverage (film thickness)31,56,57. This trend was also confirmed by the EFM measurements (see Fig. 1c), which are performed in an inert (nitrogen) environment at atmospheric pressure so that actual work function change can be measured under similar conditions to those appertaining following coating of the active layer. The EFM data reveal that the ECBL work function shifts by∼0.15 eV (from −4.83 to −4.68 eV) and 0.28 eV (from −4.83 to −4.55 eV), respectively, following the spin coating of 4 and 8 mg ml−1 PEOz solutions. The reduction in work function associated with the PEOz dipole layer is illustrated in the simplified energy band diagram of Fig. 1d, in which the valence band (7.7 eV) and conduction band (4.3 eV) energy of the ZnO layer was obtained from the UPS spectrum in Fig. 1b and its optical band gap (see Methods section)56,57,58,59. We note that the discrepancy in work function between the UPS and EFM data can be attributed primarily to the different measurement environments (in vacuo for the UPS measurement and in ambient for the EFM measurement) as previously well documented58,59,60. Figure 1e shows 300–900 nm optical transmittance spectra for ITO, ITO/ZnO and ITO/ZnO/PEOz samples, where 4 and 8 mg ml−1 PEOz data are labelled PEOz(4) and PEOz(8), respectively. The average transmittance between 400 and 900 nm exceeds 80% for all samples, with the optical quality evident from the Fabry–Perot interference fringes. This result confirms that the addition of a PEOz interlayer on top of the ZnO ECBL does not harm its optical transmittance, ensuring that there should be a negligible effect on the light intensity reaching the PTB7-Th:PC71BM BHJ layer.
PEOz-induced changes in solar cell performance
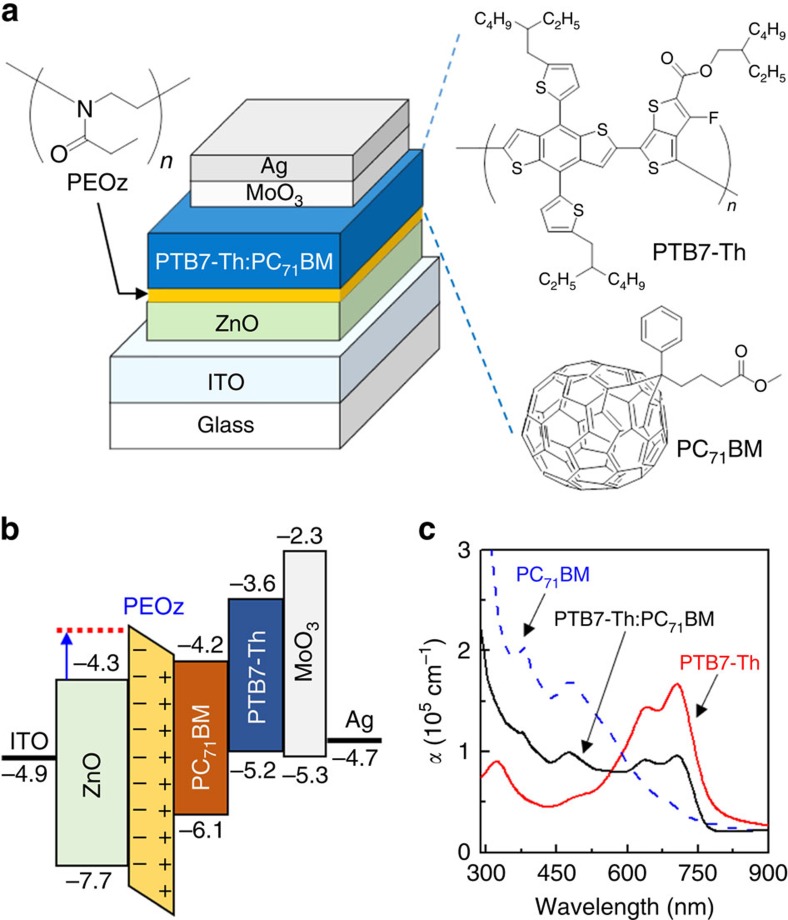
Based on the observed changes in ZnO work function (Fig. 1), inverted PTB7-Th:PC71BM BHJ solar cells were fabricated as shown in Fig. 2a. The PEOz solution concentration was again varied from 0 to 8 mg ml−1, to investigate the interlayer coverage (thickness) effect on solar cell performance. Taking into account the work function shift presented in Fig. 1d, the overall flat energy band diagram for our PTB7-Th:PC71BM solar cells can be represented as per Fig. 2b. It is useful to note that relatively small changes in the conduction band energy level (work function) of the n-type ZnO layer will significantly affect the device built-in potential (electric field). A close look at the optical absorption spectra in Fig. 2c shows that the PTB7-Th component has a vibronically structured absorption band spanning the range from ∼550 to 800 nm, coincident with the high transmittance range of the ITO/ZnO/PEOz stack.
Figure 2. Device/energy band structure and absorption coefficient data.
(a) Solar cell device stack and chemical structures for PTB7-Th, PC71BM and PEOz. (b) Flat energy band diagram for the PTB7-Th:PC71BM BHJ solar cells with ZnO/PEOz ECBL/interlayer. The conduction band and valence band energy values of the ZnO layer were measured in this work (see the Methods section). The blue arrow denotes the shift in ZnO work function caused by the PEOz. (c) Absorption coefficient (α) spectra for pristine films of PTB7-Th and PC71BM, and for a BHJ PTB7-Th:PC71BM blend film.
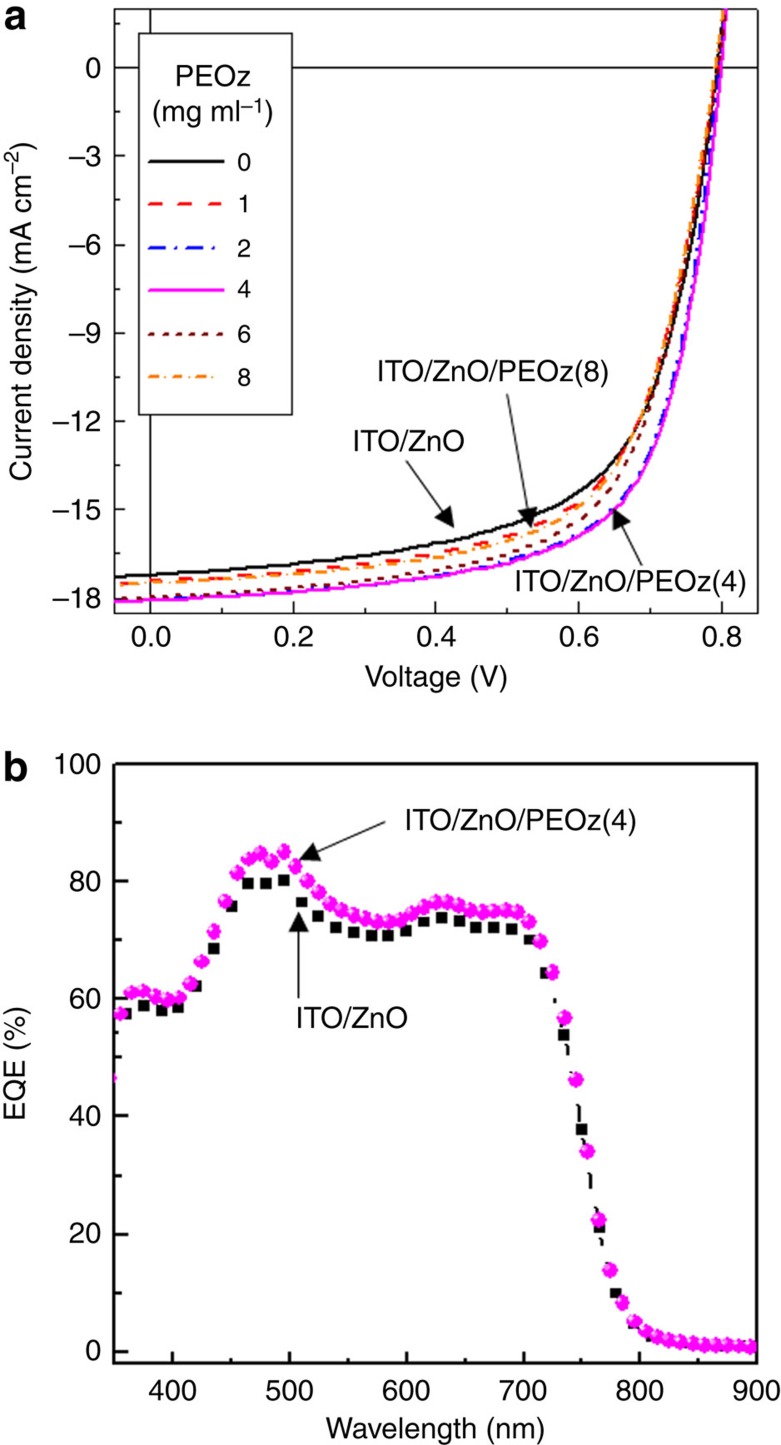
As shown in Fig. 3a, the current density–voltage (J–V) curves under simulated solar light (air mass 1.5 G, 100 mW cm−2) illumination noticeably improved on addition of a PEOz layer on top of the ZnO ECBL. However, the improvement was not monotonic in PEOz concentration: the best performance was measured for the PEOz(4) device (ITO/ZnO/PEOz(4)/PTB7-Th:PC71BM/MoO3/Ag) and higher concentrations gave worse performance. Considering the work function changes for the ZnO layer in the presence of PEOz (see Fig. 1), PEOz(8) devices might have been expected to perform better than PEOz(4) devices. This result may reflect that the thicker PEOz layer could relatively restrict electron transport to the ZnO ECBL from the PTB7-Th:PC71BM BHJ layer, owing to a slightly higher electrical resistance. This would be consistent with the observation that the change in short circuit current density (JSC) was more pronounced than that for open circuit voltage (VOC). An enhanced JSC for the PEOz(4) device was also confirmed by external quantum efficiency (EQE) spectra measurements (see Fig. 3b). The EQE value is higher for the PEOz(4) device than the control device (ITO/ZnO/PTB7-Th:PC71BM/MoO3/Ag) across the entire wavelength range, suggesting that the effect is not predominantly interference related. This result supports a conclusion that the improved solar cell performance is mainly attributed to enhanced charge (electron) collection in the presence of a PEOz interlayer due to the increased built-in potential represented in Fig. 1.
Figure 3. Solar cell performances.
(a) Light (air mass 1.5G, 100 mW cm−2) J–V curves for PTB7-Th:PC71BM solar cells fabricated using PEOz solution concentrations in the range 1–8 mg ml−1. Data are also shown for a control device with no PEOz interlayer. (b) EQE spectra for PTB7-Th:PC71BM solar cells with a bare ZnO ECBL and with a PEOz(4)-coated ZnO ECBL.
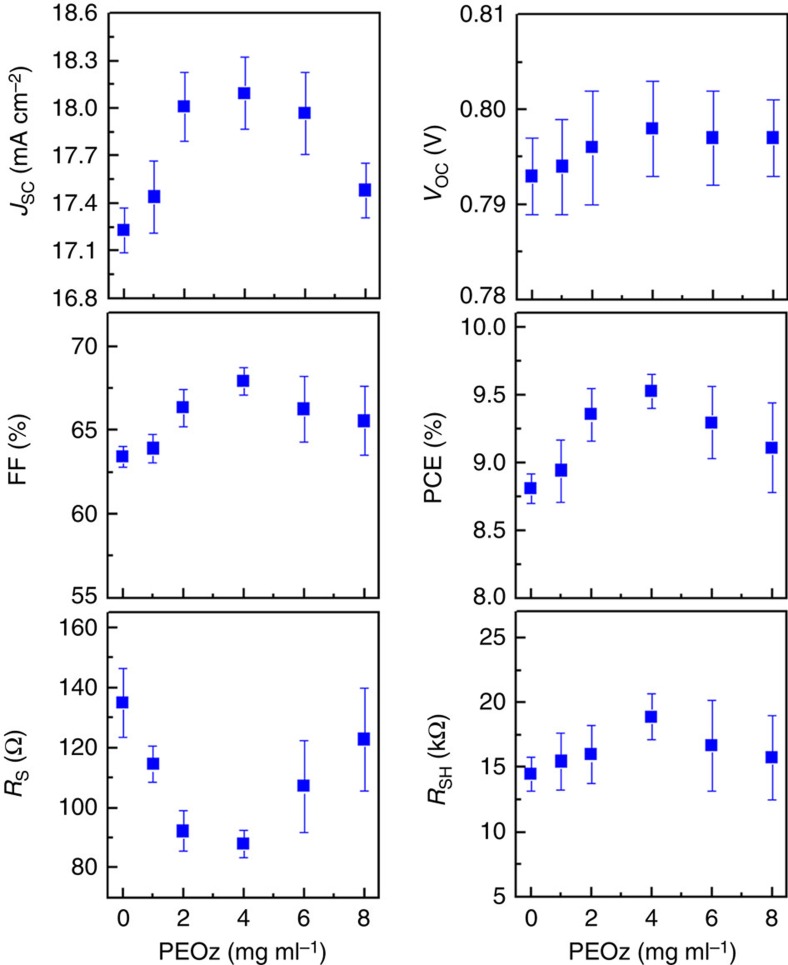
The detailed variation in solar cell parameter values as a function of PEOz concentration (extracted from the data shown in Fig. 3a) is shown in Fig. 4. In all cases, there is a non-monotonic variation, with 4 mg ml−1 providing the extreme value for each parameter. The short circuit current (Jsc) peak is mirrored by a fill factor (FF) maximum and a series resistance (RS) minimum that are consistent with otherwise electron transport-limited behaviour. The solar cell shunt resistance (RSH) peak at 4 mg ml−1 PEOz concentration also signals an advantageous reduction in leakage current for this device structure.
Figure 4. PEOz coating dependence of solar cell parameters.
JSC, VOC, FF, PCE, RS and RSH for the PTB7-Th:PC71BM solar cells as a function of the PEOz concentration (N.B. these data were taken from the light J–V curves in Fig. 3 with error bars for more than 15 devices).
In contrast, the VOC value only very slightly increases up to 4 mg ml−1 and is then almost constant for higher concentrations; the maximum is only marginally optimal in that regard. The rising VOC value is consistent with the work-function shifts seen in UPS measurements but the magnitude of the effect is not. VOC increases at best by 0.005 eV compared with a work-function shift of 0.15 eV for PEOz(4) relative to PEOz(0) devices (see Fig. 1). In addition, the work-function shift continues, reaching 0.28 eV for PEOz(8), whereas VOC is saturated beyond PEOz(4). This strongly suggests that other energy levels limit the open circuit voltage, because the offset energy between the PTB7-Th highest occupied molecular orbital and PC71BM lowest unoccupied molecular orbital is∼1 eV61,62, and the thicker PEOz(8) layer inevitably has a relatively higher electrical resistance.
Finally, the solar cell PCE significantly improved from 8.81 to 9.53% by depositing a PEOz(4) film (see Table 1). This 9.53% PEOz(4) device was subsequently tested and certified at 9.57% by the National Solar Cell Accreditation Center of the Korea Institute for Energy Research (see Supplementary Fig. 1). Additional experiments were undertaken to assess the ubiquity of PEOz and specifically the optimal 4 mg ml−1 concentration. In particular, poly[[4,8-bis[(2-ethylhexyl)oxy]benzo[1,2-b:4,5-b′]dithiophene-2,6-diyl][3-fluoro-2-[(2-ethylhexyl) carbonyl]thieno[3,4-b]thiophenediyl]] (PTB7) was substituted for the PTB7-Th donor used here and BHJ blend solar cells were fabricated, again with PC71BM as the acceptor. As shown in Supplementary Fig. 2, the best performance for the PTB7:PC71BM blend was also obtained for PEOz(4) solar cells.
Table 1. Solar cell performances as a function of PEOz concentration in methanol.
| PEOz (mg ml−1) | VOC (V) | JSC (mA cm−2) | FF (%) | PCE (%) | RS (Ω) | RSH (kΩ) |
|---|---|---|---|---|---|---|
| 0 | 0.793 (0.004) | 17.23 (0.14) | 63.42 (0.64) | 8.81 (0.11) | 135.0 (11.5) | 14.47 (1.29) |
| 1 | 0.794 (0.005) | 17.44 (0.23) | 63.92 (0.83) | 8.94 (0.23) | 114.5 (6.1) | 15.43 (2.20) |
| 2 | 0.796 (0.006) | 18.01 (0.22) | 66.36 (1.11) | 9.35 (0.20) | 92.3 (6.8) | 15.98 (2.25) |
| 4 | 0.798 (0.005) | 18.10 (0.23) | 67.95 (0.82) | 9.53 (0.12) | 88.0 (4.5) | 18.89 (1.78) |
| 4* | 0.806 | 17.21 | 68.97 | 9.57 | 85.3 | 19.2 |
| 6 | 0.797 (0.005) | 17.97 (0.26) | 66.27 (1.97) | 9.29 (0.26) | 107.2 (15.3) | 16.68 (3.53) |
| 8 | 0.797 (0.004) | 17.48 (0.17) | 65.56 (2.05) | 9.11 (0.33) | 122.8 (17.2) | 15.74 (3.25) |
FF, fill factor; JSC, short circuit current density; PCE, power conversion efficiency; PC71BM, [6,6]-phenyl-C71-butyric acid methyl ester; PEOz, poly(2-ethyl-2-oxazoline); PTB7-Th, poly[4,8-bis(5-(2-ethylhexyl)thiophen-2-yl)benzo[1,2-b:4,5-b′]dithiophene-alt-3-fluorothieno[3,4-b]thiophene-2-carboxylate] (PTB7-Th); RS, series resistance; RSH, cell shunt resistance; VOC, open circuit voltage; ZnO, zinc oxide.
‘4*' denotes the certified results for the inverted PTB7-Th:PC71BM solar cells with the ZnO/PEOz(4) layer, which were measured in the National Solar Cell Accreditation Center of Korea Institute of Energy Research.
Surface morphology of the PEOz-modified ZnO ECBL
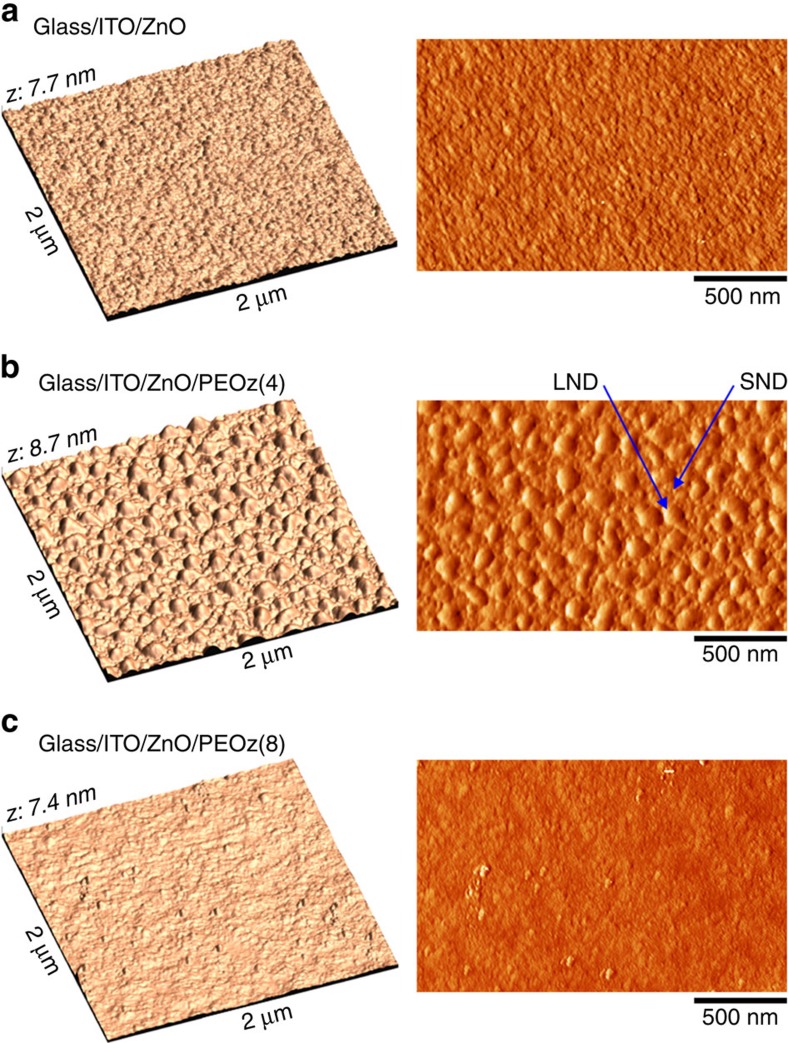
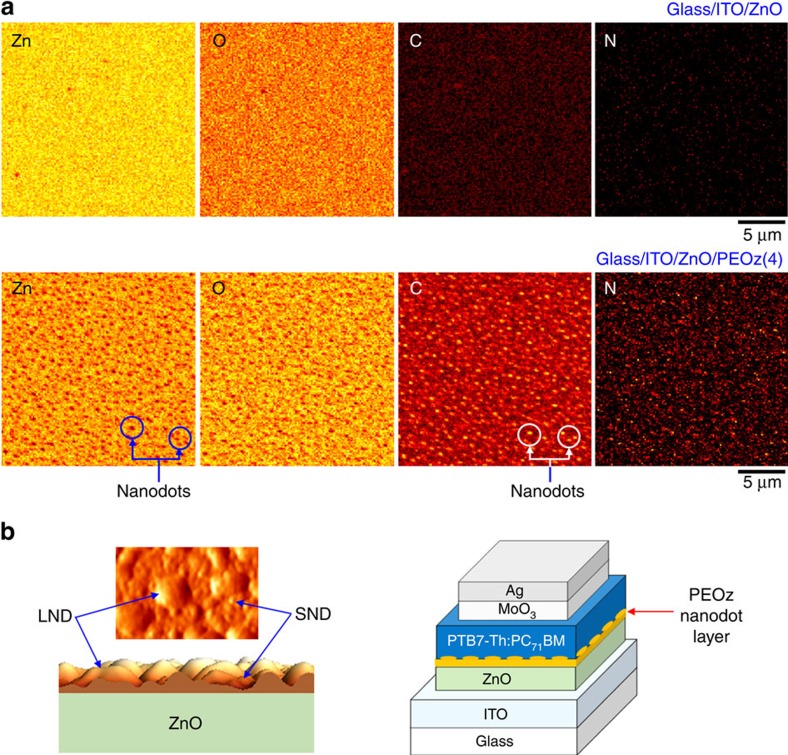
The non-monotonic dependence of solar cell performance parameters on PEOz solution concentration suggests that more needs to be known about the microstructure and morphology of the films deposited. To investigate how such additional factors may contribute to the improved device performance, alongside a lower ZnO ECBL work function, the surface morphology of PEOz-coated ZnO was examined using AFM measurements. As shown in Fig. 5a, a fine-grain morphology was measured for bare ZnO (without the PEOz layer), with a root-mean-square roughness of 0.88 nm. A striking morphology change was found for the ZnO/PEOz(4) samples, as shown in Fig. 5b, where randomly distributed NDs cover the whole surface (see also the SEM images in Supplementary Fig. 3). In closeup, the AFM (Supplementary Fig. 4) and SEM images (Supplementary Fig. 3 right) reveal the coexistence of both small NDs (SNDs) and large NDs (LNDs) (the diameter of LNDs and SNDs is 80∼120 and 10∼20 nm, respectively). As shown in Fig. 6a, the AEM measurements confirmed the co-existence of SNDs and LNDs on the ZnO/PEOz(4) sample surface (note that ‘N' and ‘C' atoms are present only in the PEOz polymer). In addition, the AEM images suggest that the spaces between NDs may also be covered by a thin PEOz(4) nanolayer as indicated by the (colour) difference between the bare ZnO and PEOz(4)-coated ZnO surfaces. In contrast, the ZnO/PEOz(8) samples show a more uniform surface morphology that is less rough than the ZnO layer and pronouncedly different from the ZnO/PEOz(4) case. However, the presence of a pit-like defect on the PEOz(8) surface might be responsible for the relatively lower shunt resistance of devices (see Fig. 4).
Figure 5. AFM measurements of the surface morphology.
Three-dimensional height-mode (left) and two-dimensional phase-mode (right) AFM images. (a) Glass/ITO/ZnO, (b) glass/ITO/ZnO/PEOz(4) and (c) glass/ITO/ZnO/PEOz(8). ‘SND' and ‘LND' in b represent ‘small NDs' and ‘large NDs', respectively.
Figure 6. AEM measurements of the surface atom distribution and formation of NDs.
(a) AEM images for individual atoms (zinc (Zn), oxygen (O), carbon (C) and nitrogen (N)). (b) Illustration for the proposed formation of the PEOz(4) nanolayer comprising SNDs and LNDs, and a contiguous coating between them.
The reported AFM and AEM measurements raise two questions: whether and how the ND morphology might contribute to the enhanced performance of PEOz(4) PTB7-Th:PC71BM solar cells. At the present time we are not able to directly answer these questions but we note that charge (electron) transport from the BHJ layer to the ZnO ECBL might, for instance, be affected by the influence of the ND structure on local electric fields. In addition (or alternatively), the physical contact (adhesion) to the BHJ blend and/or its effective active area might be enhanced by an increase in PEOz surface area. This is schematically illustrated in Fig. 6b but we note that it is difficult to probe such a situation using standard measurements. As shown in Supplementary Fig. 5 the surface nanomorphology of PTB7-Th:PC71BM BHJ films is little altered (other than in terms of its surface roughness) by being deposited on top of a bare ZnO ECBL or one coated with a PEOz(4) or PEOz(8) film. In addition, high-resolution transmission electron microscope images of focused ion beam prepared PEOz(4) device cross-sections only vaguely reveal the presence of the PEOz film (see Supplementary Fig. 6). Further detailed studies will be required to gain a clearer insight but our initial considerations suggest that the role of PEOz ND structures may be different from the conventional island-interface effect bestowed by metal (Ag) clusters, conical island titanium oxide (TiO2), and silicon (Si) nanodots, in which surface plasmon and effects have been proposed to play a significant role63,64,65.
Further device optimization and stability (lifetime) studies
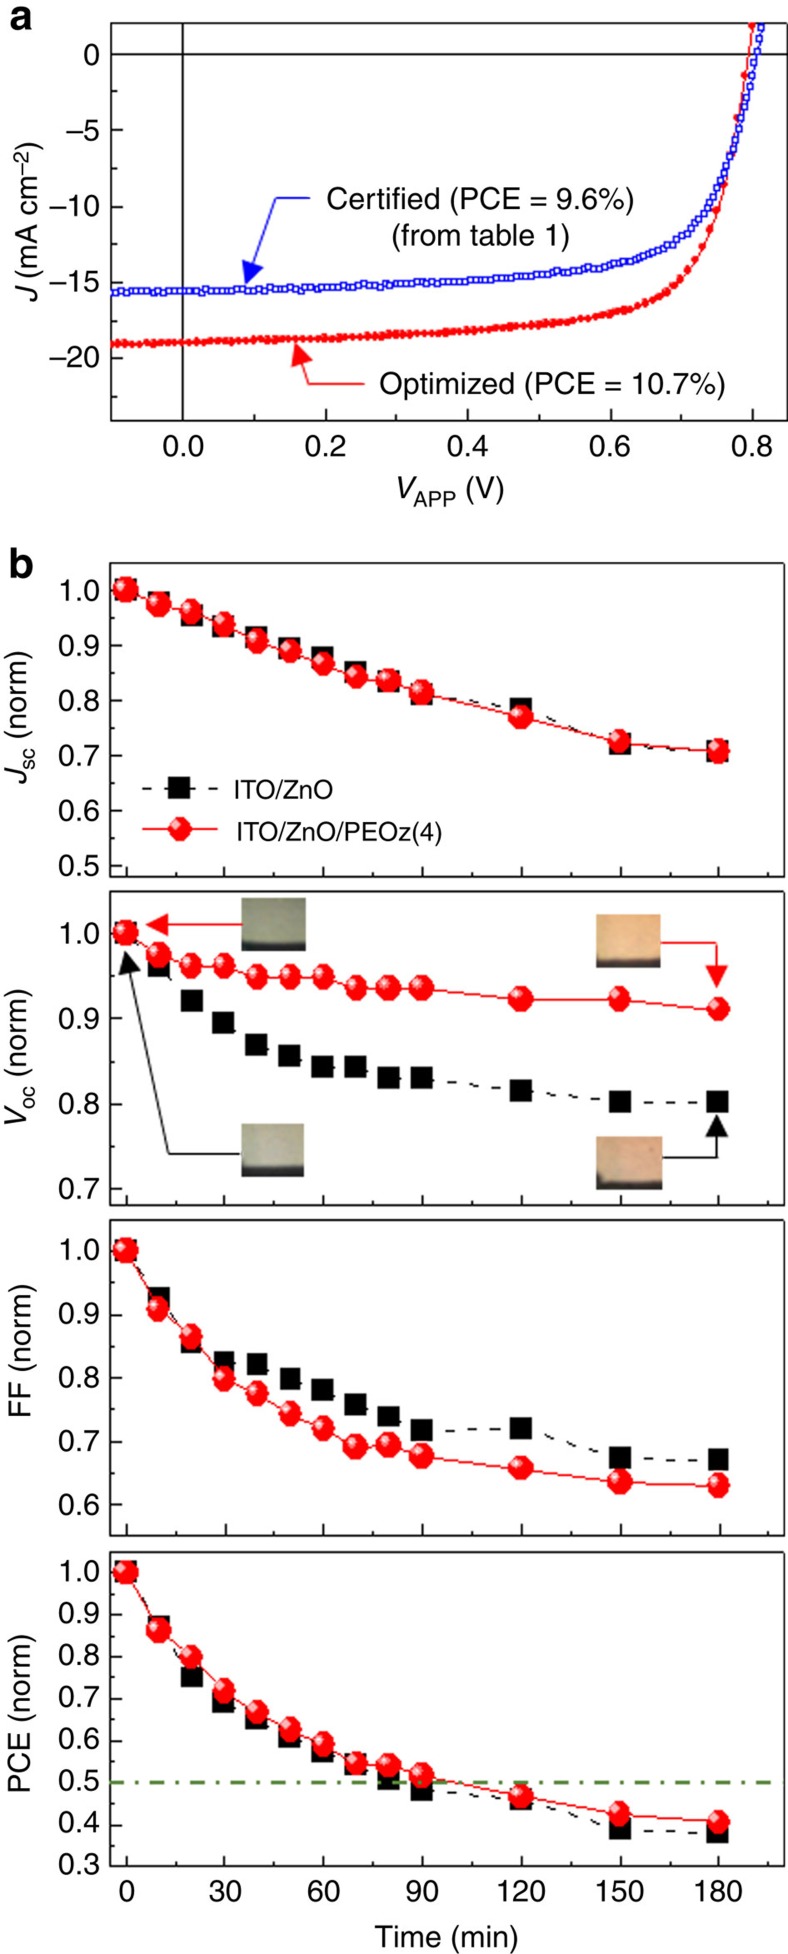
To increase solar cell performance even more, the ZnO/PEOz(4) layer was thermally annealed before deposition of the BHJ blend film; this can lead to better adhesion between the ZnO ECBL and the PEOz interlayer. As shown in Supplementary Fig. 7, 120 °C was found to be the optimal annealing temperature and fabrication of a set of devices using this protocol yielded ∼10.7% PCE (see Fig. 7a, where VOC=0.794 V, JSC=19.0 mA cm−2 and FF=71.2%, and hence PCE=10.74%). PCE=10.74% represents state-of-the-art performance for a single-stack polymer:fullerene solar cell, as summarized in Supplementary Table 1. Our 10.74% solar cells were next subjected to a brief stability test under continuous illumination with simulated solar light (air mass 1.5 G, 100 mW cm−2). As shown in Fig. 7b, both the optimized PEOz(4) device and the control device (bare ZnO ECBL) exhibited a rapid decrease in JSC with illumination time, whereas FF was marginally more stable for the optimized device. The VOC trend was different in that the optimized PEOz(4) device showed a significantly slower reduction, probably reflecting the PEOz ND layer's role in retarding interfacial degradation. As a result, the overall PCE stability of the optimized PEOz(4) device (τ1/2∼98 min) was marginally better than for the control device (τ1/2∼81 min). Nevertheless, in reality both devices exhibited poor stability; this can be ascribed directly to device degradation, as it was evident that continuous illumination drastically alters the BHJ film colour (see inset photographs in Fig. 7b). In this regard, the poor stability is likely to be associated with PTB7-Th, mirroring the known instability of the closely related PTB7 polymer66,67,68.
Figure 7. Fully optimized device performance and stability data.
(a) Light J–V characteristics of a fully optimized PTB7-Th:PC71BM solar cell (JSC=19.0 mA cm−2, VOC=0.794 V, FF=71.2%, PCE=10.74%) together with certified data for a 9.6% PCE cell fabricated with a simple soft-baking step (without the optimized PEOz annealing step). (b) Change of normalized solar cell parameters for PEOz(4) and PEOz-free solar cells as a function of exposure time under continuous AM1.5G, 100 mW cm−2 illumination. The inset photographs in the VOC graph show the striking colour change of the PTB7-Th:PC71BM BHJ that accompanies the decrease in performance.
Conclusion
In summary, coating a ZnO ECBL with PEOz leads to formation of an interfacial dipole layer that induces a significant change in work function; reductions of 0.15 and 0.28 eV are achieved for PEOz(4) and (8) films, respectively. The corresponding performance of inverted ZnO-ECBL-containing PTB7-Th:PC71BM BHJ solar cells is noticeably improved (certified PCE ∼9.57%) by insertion of the PEOz interlayer but the improvement peaks for films prepared from 4 mg ml−1 solutions. Beyond this concentration there is a decline or (for Voc) saturation in cell parameters, flagging the importance of factors other than the change in work function. In addition, even for PEOz(4) films, the observed increase in VOC is rather smaller than would have been expected from the work function shift, probably owing to the practical difference between film surface (no influence of electron transport and contact resistance) and bulk device property (strong influence of electron transport and contact resistance). The morphology/microstructure of the deposited PEOz films was, in particular, found to have a key influence on device function. A characteristic ND-like surface morphology was observed for the PEOz(4)-coated ZnO ECBL, leading to an increased contact surface area with, and an enhanced electron collection from, the BHJ blend. This ND morphology is absent for PEOz(8)-coated ZnO ECBL samples, with the corresponding absence of any increase in VOC and JSC then attributable to relatively higher electrical resistance. Our results have clearly demonstrated the correlation between solar cell performance and the morphology change, which can be controlled by varying the concentration of the PEOz solution. Additional optimization by thermal annealing of the PEOz(4)-coated ZnO ECBL at 120 °C resulted in PCE=10.74%, one of the best efficiencies reported for a single-stack polymer:fullerene solar cell. Annealing at higher temperatures still (150 °C, data not shown) was, however, then detrimental to device performance, resulting in a loss of the desirable ND microstructure. These results demonstrate a clear correction between our solar cell performance and the PEOz film morphology, controlled both by varying the PEOz solution concentration and by annealing. Future work will need to focus on enhancing device stability but this may require replacement of the PTB7-Th donor polymer in the BHJ blend, which, similar to the closely related PTB7 donor polymer, appears to be highly susceptible to photo-oxidation. The use of PEOz with other active solar cell materials will be the subject of ongoing studies.
Methods
Materials and solutions
PTB7-Th (weight-average molecular weight=126 kDa, polydispersity index=2.5) and PC71BM (purity>99%) were purchased from 1-Material (Canada) and Nano-C (USA), respectively. PEOz (weight-average molecular weight=50 kDa, polydispersity index=3–4) was supplied by Sigma-Aldrich (USA) and used without further purification. The PEOz solutions were prepared by varying the concentration up to 8 mg ml−1 in methanol. Binary polymer:fullerene solutions were prepared using chlorobenzene as a solvent in the presence of 1,8-diiodooctane (chlorobenzene:1,8-diiodooctane =97:3 by volume) at a solid concentration of 20 mg ml−1 (PTB7-Th:PC71BM=1:1.5 by weight) and were vigorously stirred at room temperature for 12 h before spin coating. The ZnO precursor solutions were prepared by dissolving zinc acetate dihydrate (Sigma-Aldrich, 1 g) and ethanolamine (Sigma-Aldrich, 0.28 g) in 2-methoxyethanol (Sigma-Aldrich, 10 ml) and stirred at 60 °C for 3 h and then at room temperature for 12 h before spin coating.
Thin film and device fabrication
ITO-coated glass substrates (sheet resistance=10 Ω cm−2) were patterned by photolithography/etching processes. The pre-patterned ITO-glass substrates were cleaned using acetone and isopropyl alcohol in an ultrasonic cleaner, followed by drying under flowing nitrogen. The dried ITO-glass substrates were treated inside an ultraviolet–ozone chamber for 20 min, to remove any remnant organic residues on the surface of the substrates and to make the ITO surface hydrophilic. ZnO precursor solutions were spin coated onto the cleaned ITO-glass substrates and the resulting ITO/ZnO samples were annealed at 200 °C for 1 h in air. After cooling down to room temperature, the PEOz solutions were spin coated onto the surface of the ZnO layer, followed by soft-baking for 15 min at 60 °C (in the case of unoptimized structures) or annealing for 15 min at 120 °C (in the case of fully optimized structures) or (detrimentally) at 150 °C. The PEOz-coated samples were transferred to a nitrogen-filled glove box for the active layer coating. The PTB7-Th:PC71BM BHJ layers were spin-coated on top of the PEOz-coated ZnO layers and dried for 20 min inside the glove box. Next, these samples were transferred to a vacuum chamber in the argon-filled glove box, where MoO3 (10 nm) and Ag (80 nm) were sequentially deposited on top of the BHJ layers through a shadow mask in a vacuum of 2 × 10⁻⁶ Torr. The active area of devices was 0.05 or 0.09 cm2. For the measurement of surface morphology and nanostructure, all samples were prepared using the ITO-glass substrates in the same way as for the device fabrication, whereas the samples were prepared by spin coating on quartz substrates for optical measurements. Attempts to measure the exact thickness of the PEOz layers gave unreliable results, because the PEOz layers were too thin.
Measurements
The thickness of films was measured using a surface profiler (Alpha Step 200, Tencor Instruments), whereas the optical absorption and transmittance of film samples were measured using an ultraviolet-visible spectrometer (Optizen 2120, MECASYS). The UPS spectra were measured using an ultra-high vacuum UPS system (ESCALAB 250Xi, Thermo Scientific) at ∼1 × 10⁻⁹ mbar with a He I (21.2 eV) ultraviolet source: all samples were biased at −5 V, whereas the energy scale of the UPS spectra was calibrated to the Fermi level of a thermally evaporated, cleaned Ag substrate. The valence band energy of the ZnO layer was obtained as 7.7 eV from the low binding energy part of corresponding UPS spectrum after calibration with the clean Ag reference, whereas the conduction band energy of the ZnO layer was calculated by subtracting its optical band gap (3.4 eV) (refer to Fig. 1e) from the valence band energy. The valence band maximum of the PEOz-coated ZnO layers was calculated using the equation, EVBM=PIN−(ECF−EON), where EVBM, PIN, ECF and EON are the valence band maximum, the incident photon energy (21.2 eV), the binding energy at cutoff region and the onset binding energy, respectively69. The work functions of the ZnO and ZnO/PEOz nanolayers were also measured using an EFM (XE-150, Park Systems) and calibrated against highly ordered pyrolytic graphite. The surface morphology was measured using an AEM (scanning Auger nanoprobe, PHI700, Physical Electronics), AFM (Nanoscope IIIa, Digital Instruments) and SEM (S-4800, Hitachi). Device cross-sections were measured using a high-resolution transmission electron microscope (Titan G2 ChemiSTEM Cs Probe, FEI Company) equipped with a focused ion beam system (Versa3D LoVac, FEI Company). The J–V curves of devices were measured using a solar cell measurement system equipped with a solar simulator (92250A-1000, Newport-Oriel) and an electrometer (Model 2400, Keithley). The EQE measurements were carried out using a specialized EQE measurement system equipped with a light source (Tungsten-Halogen lamp, 150W, ASBN-W, Spectral Products) and a monochromator (CM110, Spectral Products).
Additional information
How to cite this article: Nam, S. et al. Inverted polymer fullerene solar cells exceeding 10% efficiency with poly(2-ethyl-2-oxazoline) nanodots on electron-collecting buffer layers. Nat. Commun. 6:8929 doi: 10.1038/ncomms9929 (2015).
Supplementary Material
Supplementary Figures 1-7, Supplementary Table 1 and Supplementary References.
Acknowledgments
This work was financially supported by grants from the Korean Government (NRF_2015R1A2A2A01003743, NRF_2014R1A1A3051165, NRF-2014R1A6A3A03055861, Basic Science Research Program_2009-0093819, Human Resource Training Project for Regional Innovation_MOE/NRF_2014H1C1A1066748 and Basic Research Laboratory Program_2011-0020264) and partly by the DGIST R&D Program of the Ministry of Science, ICT and Future Planning of Korea (15-EN-03).
Footnotes
Author contributions S.N. fabricated devices, measured devices and carried out SEM and TEM measurements. W.H.K. performed sample preparation for UPS and EFM measurements. S.W. contributed to various experimental systems and protocols. H.K carried out AES and AFM measurements and analysis. Y.K designed and directed the research and experiments. D.D.C.B contributed valuable advice on interpreting the results. S.N., D.D.C.B. and Y.K. wrote the manuscript.
References
- Van Franeker J. J., Turbiez M., Li W., Wienk M. M. & Janssen R. A. J. A real-time study of the benefits of co-solvents in polymer solar cell processing. Nat. Commun. 6, 6229 (2015). [DOI] [PubMed] [Google Scholar]
- Wu J.-S., Cheng S.-W., Cheng Y.-J. & Hsu C.-S. Donor-acceptor conjugated polymers based on multifused ladder type arenes for organic solar cells. Chem. Soc. Rev. 44, 1113–1152 (2015). [DOI] [PubMed] [Google Scholar]
- Kim H. et al. Organic solar cells based on conjugated polymers: history and recent advances. Korean J. Chem. Eng. 31, 1095–1104 (2014). [Google Scholar]
- Dang M. T., Hirsch L., Wantz G. & Wuest J. D. Controlling the morphology and performance of bulk heterojunctions in solar cells. Lessons learned from the benchmark poly(3-hexylthiophene):[6,6]-phenyl-C61-butyric acid methyl ester system. Chem. Rev. 113, 3734–3765 (2013). [DOI] [PubMed] [Google Scholar]
- Krebs F. C. All solution roll-to-roll processed polymer solar cells free from indium-tin-oxide and vacuum coating steps. Org. Electron. 10, 761–768 (2009). [Google Scholar]
- Krebs F. C. Roll-to-roll fabrication of monolithic large-area polymer solar cells free from indium-tin-oxide. Sol. Energy Mater. Sol. Cells 93, 1636–1641 (2009). [Google Scholar]
- Voigt M. M. et al. Gravure printing for three subsequent solar cell layers of inverted structures on flexible substrates. Sol. Energy Mater. Sol. Cells 95, 731–734 (2011). [Google Scholar]
- Yu G., Gao J., Hummelen J. C., Wudl F. & Heeger A. J. Polymer photovoltaic cells-enhanced efficiencies via a network of internal donor-acceptor heterojunctions. Science 270, 1789–1791 (1995). [Google Scholar]
- Shaheen S. E. et al. 2.5% efficient organic plastic solar cells. Appl. Phys. Lett. 78, 841–843 (2001). [Google Scholar]
- Padinger F., Rittberger R. S. & Sariciftci N. S. Effects of postproduction treatment on plastic solar cells. Adv. Funct. Mater. 13, 85–88 (2003). [Google Scholar]
- Kim Y. et al. Device annealing effect in organic solar cells with blends of regioregular poly(3-hexylthiophene) and soluble fullerene. Appl. Phys. Lett. 86, 063502 (2005). [Google Scholar]
- Reyes-Reyes M., Kim K. & Carroll D. L. High-efficiency photovoltaic devices based on annealed poly(3-hexylthiophene) and 1-(3-methoxycarbonyl)-propyl-1-phenyl-(6,6)C61 blends. Appl. Phys. Lett. 87, 083506 (2005). [Google Scholar]
- Li G. et al. High-efficiency solution processable polymer photovoltaic cells by self-organization of polymer blends. Nat. Mater. 4, 864–868 (2005). [Google Scholar]
- Kim Y. et al. A strong regioregularity effect in self-organizing conjugated polymer films and high-efficiency polythiophene:fullerene solar cells. Nat. Mater. 5, 197–203 (2006). [Google Scholar]
- Chen H. Y. et al. Polymer solar cells with enhanced open-circuit voltage and efficiency. Nat. Photon. 3, 649–653 (2009). [Google Scholar]
- Deng Y. et al. Dithienocarbazole and isoindigo based amorphous low bandgap conjugated polymers for efficient polymer solar cells. Adv. Mater. 26, 471–476 (2014). [DOI] [PubMed] [Google Scholar]
- Ho C.-C., Chen C.-A., Chang C.-Y., Darling S. B. & Su W.-F. Isoindigo-based copolymers for polymer solar cells with efficiency over 7%. J. Mater. Chem. A 2, 8026–8032 (2014). [Google Scholar]
- Guo X. et al. Polymer solar cells with enhanced fill factors. Nat. Photon. 7, 825–833 (2013). [Google Scholar]
- He Z. et al. Single-junction polymer solar cells with high efficiency and photovoltage. Nat. Photon. 9, 174–179 (2015). [Google Scholar]
- Tao Q. et al. D-A1-D-A2 copolymers with extended donor segments for efficient polymer solar cells. Macromolecules 48, 1009–1016 (2015). [Google Scholar]
- Zhang S. et al. Side chain selection for designing highly efficient photovoltaic polymers with 2D-conjugated structure. Macromolecules 47, 4653–4659 (2014). [Google Scholar]
- Nguyen T. L. et al. Semi-crystalline photovoltaic polymers with efficiency exceeding 9% in a ∼300 nm thick conventional single-cell device. Energy Environ. Sci. 7, 3040–3051 (2014). [Google Scholar]
- Liu Y. et al. Aggregation and morphology control enables multiple cases of high-efficiency polymer solar cells. Nat. Commun. 5, 5293 (2014). [DOI] [PMC free article] [PubMed] [Google Scholar]
- Ballantyne A. M. et al. Studies of highly regioregular poly(3-hexylselenophene) for photovoltaic applications. Adv. Mater. 19, 4544–4547 (2007). [Google Scholar]
- Faist M. A. et al. Competition between the charge transfer state and the singlet states of donor or acceptor limiting the efficiency in polymer:fullerene solar cells. J. Am. Chem. Soc. 134, 685–692 (2012). [DOI] [PubMed] [Google Scholar]
- Faist M. A. et al. Understanding the reduced efficiencies of organic solar cells employing fullerene multiadducts as acceptors. Adv. Energy Mater. 3, 744–752 (2013). [Google Scholar]
- Waldauf C. et al. Highly efficient inverted organic photovoltaics using solution based titanium oxide as electron selective contact. Appl. Phys. Lett. 89, 233517 (2006). [Google Scholar]
- Hau S. K., Yip H.-L. & Jen A. K.-Y. A review on the development of the inverted polymer solar cell architecture. Polym. Rev. 50, 474–510 (2010). [Google Scholar]
- Yaacobi-Gross N. et al. High efficiency organic photovoltaic cells based on the solution-processable hole transporting interlayer copper thiocyanate (CuSCN) as a replacement for PEDOT:PSS. Adv. Energy Mater. 5, 1401529 (2015). [Google Scholar]
- Treat N. D. et al. Copper thiocynate (CuSCN): An attractive hole transport/extraction layer for use in organic photovoltaic cells. Appl. Phys. Lett. 107, 013301 (2015). [Google Scholar]
- Lee B. R. et al. Amine-based polar solvent treatment for highly efficient inverted polymer solar cells. Adv. Mater. 26, 494–500 (2014). [DOI] [PubMed] [Google Scholar]
- Wang G. et al. Interface modification of ZnO-based inverted PTB7:PC71BM organic solar cells by cesium stearate and simultaneous enhancement of device parameters. ACS Sustain. Chem. Eng. 2, 1331–1337 (2014). [Google Scholar]
- Cheng Y.-J., Hsieh C.-H., He Y., Hsu C.-S. & Li Y. Combination of indene-C60 bis-adduct and cross-linked fullerene interlayer leading to highly efficient inverted polymer solar cells. J. Am. Chem. Soc. 132, 17381–17383 (2010). [DOI] [PubMed] [Google Scholar]
- Hau S. K. et al. Interfacial modification to improve inverted polymer solar cells. J. Mater. Chem. 18, 5113–5119 (2008). [Google Scholar]
- Duan C., Zhang K., Zhong C., Huang F. & Cao Y. Recent advances in water/alcohol-soluble π-conjugated materials: new materials and growing applications in solar cells. Chem. Soc. Rev. 42, 9071–9104 (2013). [DOI] [PubMed] [Google Scholar]
- Yang T. et al. Inverted polymer solar cells with 8.4% efficiency by conjugated polyeletrolyte. Energy Environ. Sci. 5, 8208–8214 (2012). [Google Scholar]
- Na S.-I., Oh S.-H., Kim S.-S. & Kim D.-Y. Efficient organic solar cells with polyfluorene derivatives as a cathode interfacial layer. Org. Electron. 10, 496–500 (2009). [Google Scholar]
- Duan C. et al. Conjugated zwitterionic polyelectrolyte-based interface modification materials for high performance polymer optoelectronic devices. Chem. Sci. 4, 1298–1307 (2013). [Google Scholar]
- Guan X., Zhang K., Huang F., Bazan G. C. & Cao Y. Amino N-oxide functionalized conjugated polymers and their amino-functionalized precursors: new cathode interlayers for high-performance optoelectronic devices. Adv. Funct. Mater. 22, 2846–2854 (2012). [Google Scholar]
- Kesters J. et al. Imidazolium-substituted polythiophenes as efficient electron transport materials improving photovoltaic performance. Adv. Energy Mater. 3, 1180–1185 (2013). [Google Scholar]
- Chang Y.-M. & Leu C.-Y. Conjugated polyelectrolyte and zinc oxide stacked structure as an interlayer in highly efficient and stable organic photovoltaic cells. J. Mater. Chem. A 1, 6446–6451 (2013). [Google Scholar]
- Xia R. et al. Investigation of a conjugated polyelectrolyte interlayer for high performance inverted polymer solar cells. Adv. Energy Mater. 3, 718–723 (2013). [Google Scholar]
- Xu W. et al. Fluorene-based cathode interlayer polymers for high performance solution processed organic optoelectronic devices. Org. Electron. 15, 1244–1253 (2014). [Google Scholar]
- Zhou Y. et al. A universal method to produce low-work function electrodes for organic electronics. Science 336, 327–332 (2012). [DOI] [PubMed] [Google Scholar]
- Kang H., Hong S., Lee J. & Lee K. Electrostatically self-assembled nonconjugated polyelectrolytes as an ideal interfacial layer for inverted polymer solar cells. Adv. Mater. 24, 3005–3009 (2012). [DOI] [PubMed] [Google Scholar]
- Woo S. et al. 8.9% single-stack inverted polymer solar cells with electron-rich polymer nanolayer-modified inorganic electron-collecting buffer layers. Adv. Energy Mater. 4, 1301692 (2014). [Google Scholar]
- Zhou Y., Fuentes-Hernandez C., Shim J. W., Khan T. M. & Kippelen B. High performance polymeric charge recombination layer for organic tandem solar cells. Energy Environ. Sci. 5, 9827–9832 (2012). [Google Scholar]
- Jeong J. H., Song S. H., Lim D. W., Lee H. & Park T. G. DNA transfection using linear poly(ethylenimine) prepared by controlled acid hydrolysis of poly(2-ethyl-2-oxazoline). J. Controlled Release 73, 391–399 (2001). [DOI] [PubMed] [Google Scholar]
- Brissault B. et al. Synthesis of linear polyethylenimine derivatives for DNA transfection. Bioconjugate Chem. 14, 581–587 (2003). [DOI] [PubMed] [Google Scholar]
- De la Rosa V. R., Bauwens E., Monnery B. D., De Geest B. R. & Hoogenbom R. Fast and accurate partial hydrolysis of poly(2-ethyl-2-oxazoline) into tailored linear polyethylenimine copolymers. Polym. Chem. 5, 4957–4964 (2014). [Google Scholar]
- Hoogenboom R. Poly(2-oxazoline)s: a polymer class with numerous potential applications. Angew. Chem. Int. Ed. 48, 7978–7994 (2009). [DOI] [PubMed] [Google Scholar]
- Viegas T. X. et al. Polyoxazoline: chemistry, properties, and applications in drug delivery. Bioconjugate Chem. 22, 976–986 (2011). [DOI] [PubMed] [Google Scholar]
- Konradi R., Acikgoz C. & Textor M. Polyoxazolines for nonfouling surface coatings—A direct comparison to the gold standard PEG. Macromol. Rapid Commun. 33, 1663–1676 (2012). [DOI] [PubMed] [Google Scholar]
- Bogomolova A. et al. Study of complex thermosensitive amphiphilic polyoxazolines and their interaction with ionic surfactants. Are hydrophobic, thermosensitive, and hydrophilic moieties equally important? J. Phys. Chem. B 118, 4940–4950 (2014). [DOI] [PubMed] [Google Scholar]
- Ramiasa M. N. et al. Plasma polymerized polyoxazoline thin films for biomedical applications. Chem. Commun. 51, 4279–4282 (2015). [DOI] [PubMed] [Google Scholar]
- Ishii H., Sugiyama K., Ito E. & Seki K. Energy level alignment and interfacial electronic structures at organic/metal and organic/organic interfaces. Adv. Mater. 11, 605–625 (1999). [Google Scholar]
- Sun Y., Seo J. H., Takacs C. J., Seifter J. & Heeger A. J. Inverted polymer solar cells integrated with a low-temperature-annealed sol-gel-derived ZnO film as an electron transport layer. Adv. Mater. 23, 1679–1683 (2011). [DOI] [PubMed] [Google Scholar]
- Hwang J., Wang A. & Kahn A. Energetics of metal-organic interfaces: new experiments and assessment of the field. Mater. Sci. Eng. Rep. 64, 1–31 (2009). [Google Scholar]
- Kim J. S. et al. Kelvin probe and ultraviolet photoemission measurements of indium tin oxide work function: a comparison. Syn. Metal 111, 311–314 (2000). [Google Scholar]
- Schlaf R., Murata H. & Kafafi Z. H. Work functioni measurements on indium tin oxide films. J. Electron Spectrosc. Relat. Phenom. 120, 149–154 (2001). [Google Scholar]
- Boudreault P.-L. T., Najari A. & Leclerc M. Processable low-bandgap polymers for photovoltaic applications. Chem. Mater. 23, 456–469 (2011). [Google Scholar]
- Zhou H., Yang L. & You W. Rational design of high performance conjugated polymers for organic solar cells. Macromolecules 45, 607–632 (2012). [Google Scholar]
- Westphalen M., Kreibig U., Rostalski J., Lüth H. & Meissner D. Metal cluster enhanced organic solar cells. Sol. Energy Mater. Sol. Cells 61, 97–105 (2000). [Google Scholar]
- Kim W.-R., Park H. & Choi W.-Y. Conical islands of TiO2 nanotube arrays in the photoelectrode of dye-sensitized solar cells. Nanoscale Res. Lett. 10, 63 (2015). [DOI] [PMC free article] [PubMed] [Google Scholar]
- Roczen M. et al. Structural investigations of silicon nanostructures grown by self-organized island formation for photovoltaic applications. Appl. Phys. A 108, 719–726 (2012). [Google Scholar]
- Alem S. et al. Degradation mechanism of benzodithiophene-based conjugated polymers when exposed to light in air. ACS Appl. Mater. Interfaces 4, 2993–2998 (2012). [DOI] [PubMed] [Google Scholar]
- Soon Y. W. et al. Correlating triplet yield, singlet oxygen generation and photochemical stability in polymer/fullerene blend films. Chem. Commun. 49, 1291–1293 (2013). [DOI] [PubMed] [Google Scholar]
- Razzell-Hollis J. et al. Photochemical stability of high efficiency PTB7:PC70BM solar cell blends. J. Mater. Chem. A 2, 20189–20195 (2014). [Google Scholar]
- Liao S.-H. et al. Single junction inverted polymer solar cell reaching power conversion efficiency 10.31% by employing dual-doped zinc oxide nano-film as cathode interlayer. Sci. Rep. 4, 6813 (2014). [DOI] [PMC free article] [PubMed] [Google Scholar]
Associated Data
This section collects any data citations, data availability statements, or supplementary materials included in this article.
Supplementary Materials
Supplementary Figures 1-7, Supplementary Table 1 and Supplementary References.


