

Abstract
Phenotypic flexibility in physiological, morphological and behavioural traits can allow organisms to cope with environmental challenges. Given recent climate change and the degree of habitat modification currently experienced by many organisms, it is therefore critical to quantify the degree of phenotypic variation present within populations, individual capacities to change and what their consequences are for fitness.
Flexibility in standard metabolic rate (SMR) may be particularly important since SMR reflects the minimal energetic cost of living and is one of the primary traits underlying organismal performance. SMR can increase or decrease in response to food availability, but the consequences of these changes for growth rates and other fitness components are not well known.
We examined individual variation in metabolic flexibility in response to changing food levels and its consequences for somatic growth in juvenile brown trout (Salmo trutta).
SMR increased when individuals were switched to a high food ration and decreased when they were switched to a low food regime. These shifts in SMR, in turn, were linked with individual differences in somatic growth; those individuals that increased their SMR more in response to elevated food levels grew fastest, while growth at the low food level was fastest in those individuals that depressed their SMR most.
Flexibility in energy metabolism is therefore a key mechanism to maximize growth rates under the challenges imposed by variability in food availability and is likely to be an important determinant of species’ resilience in the face of global change.
Keywords: energy metabolism, fitness, intraspecific variation, phenotypic flexibility, somatic growth, standard metabolic rate
Introduction
Organisms often live in variable environments where conditions such as food availability or temperature can change considerably over their lifetime. The ability of individuals to alter their physiological, morphological and behavioural traits, that is their phenotypic flexibility, can have important consequences for their own fitness as well as the extent to which whole populations can adapt to or cope with new and changing environments (Nussey, Wilson & Brommer 2007; Bolnick et al. 2011). Given recent climate change and the degree of habitat modification currently experienced by many organisms, it is therefore critical to quantify the degree of phenotypic variation present within populations, individual capacities to change and what their consequences are for fitness (Hofmann & Todgham 2010; Tuomainen & Candolin 2011).
Flexibility in metabolic rate may be particularly important since metabolism reflects the energetic cost of living and is one of the primary traits underlying organismal performance. Standard metabolic rate in ectotherms (SMR; equivalent to basal metabolic rate – BMR – in endotherms) represents the baseline energetic expense of maintaining the systems and processes critical to sustain life (Fry 1971). SMR and BMR (referred to as SMR hereafter) are known to vary extensively among individuals within a population, even after controlling for differences in mass, age and sex (Kvist & Lindström 2001; Labocha et al. 2004; Steyermark et al. 2005). This intraspecific variation in SMR, in turn, has been linked to individual differences in fitness through its association with various behavioural and life-history traits (reviewed in Careau et al. 2008; Biro & Stamps 2010; Burton et al. 2011; Mathot & Dingemanse 2015) and, as such, is considered a key physiological trait.
Standard metabolic rate is generally repeatable over time when measured under constant conditions (Nespolo & Franco 2007). However, there is also increasing evidence that it is flexible and can change in response to food availability in as little as a few days to weeks (Guppy & Withers 1999; McKechnie 2008; McCue 2010); studies now show that SMR increases when food availability is raised and decreases when food levels decline in many different taxa, including insects (Roark & Bjorndal 2009), fishes (Van Leeuwen, Rosenfeld & Richards 2012), amphibians (Hervant, Mathieu & Durand 2001), reptiles (McCue 2007), birds (Wiersma, Salomons & Verhulst 2005) and mammals (Ostrowski, Mésochina & Williams 2006). However, individuals can differ in the degree to which their SMR changes as a function of food level (O’Connor, Taylor & Metcalfe 2000; Fu, Xie & Cao 2005). An individual’s metabolic flexibility and therefore its capacity to respond to changing food availability may have important consequences for fitness, but to our knowledge, the impacts of such flexibility have not been quantified.
Metabolic flexibility may be especially critical for somatic growth during the juvenile stage, a key determinant of fitness in many animals because of its effects on body size (Sogard 1997; Gebhardt-Henrich & Richner 1998; Blanckenhorn 2005). There is some evidence suggesting that individuals with a higher SMR grow faster under high food levels, while a lower SMR is associated with faster growth at low food levels (Derting 1989; Killen, Marras & McKenzie 2011; Reid, Armstrong & Metcalfe 2011). A higher SMR may therefore be beneficial at high food levels but can consume a disproportionate amount of an individual’s daily energy budget when food becomes scarce (Burton et al. 2011). If these are causal relationships between SMR and growth, there could be significant growth advantages for those individuals that show the biggest upregulation of SMR when food becomes abundant and the greatest decrease in SMR when food becomes scarce.
We examined individual variation in metabolic flexibility in response to changing food levels and its consequences for somatic growth. We chose juvenile brown trout (Salmo trutta) as our model species because larger body size often confers an advantage in their competitive interactions (Johnsson, Nöbbelin & Bohlin 1999) and survival (Einum & Fleming 1999; Carlson, Olsen & Vøllestad 2008), so early growth rates can have important consequences for fitness. However, food availability can exhibit marked spatial and temporal variation in the freshwater streams they inhabit (Elliott 1970; Lagarrigue et al. 2002; Martin-Smith & Armstrong 2002), so flexibility in their metabolic rates may be critical to growth.
Materials and methods
Feeding regime and growth measurements
Young-of-the-year brown trout (n = 120) were collected from a small tributary to the River Endrick, Scotland, and brought to the University of Glasgow where they were measured for body mass and fork length and then housed in individual compartments in two separate stream tank systems in a temperature-controlled room (11·5 ± 0·5°C) with a 12L:12D cycle. Fish were fed an intermediate ration of Inicio Plus trout pellets (BioMar Ltd, Grangemouth, UK) twice daily based on their body size (Appendix S1a). Fish mass and length were measured after 2 weeks to adjust feeding rations to changes in their body size.
Standard metabolic rates were first measured in each fish after they had been on the intermediate ration for 28 days (see respirometry section below). Equal numbers of fish were then switched to one of three rations (low food, ad libitum and the same intermediate ration as before) until their metabolic rates were measured again 28 days later. The three ration levels were determined using equations from Elliott (1976) that describe the growth of brown trout as a function of caloric intake, temperature and initial body size (Appendix S1a). Fish were then fed twice daily, once in the early morning and once in the late afternoon, and allowed 1 h to consume each meal before leftover food and faecal matter were siphoned from their tanks. The fork length and body mass of each fish were remeasured each week, and rations were adjusted to account for increases in body size. Daily growth (in mm) for each fish over the 28-day period was calculated as (lengthday28 – lengthday0)/28 days.
Respirometry
Standard metabolic rate was measured as the rate of oxygen consumption using continuous flow-through respirometry. The experimental set-up consisted of 16 respirometry chambers (volume 400 mL) arranged in parallel and submerged in a water bath. A peristaltic pump (Cole Parmer, London, UK) pumped water from an upper aerated bin, through the chambers, passed an oxygen sensor, and into a lower bin before it was recirculated back to the upper bin. A UV sterilizer (v2 Vecton 600, Tropical Marine Centre, Bristol, UK) helped to minimize background respiration rates. A chiller (Teco Tr5, Ravenna, Italy) maintained the water bath at 11·5 ± 0·5°C. Sheets of insulation were wrapped around the bin containing the respirometry chambers to prevent light penetration and thereby reduce fish activity. Multichannel oxygen meters (FireStingO2, PyroScience, Aachen, Germany) and attached sensors recorded oxygen levels in the chambers every 2 seconds using FireSting software version 3.0 (PyroScience). Flow rate of water through the chambers was set at 1·47 L h−1 for the first metabolic measurements and then increased to 1·68 L h−1 for the second measurement 28 days later (since the fish had grown) to ensure that oxygen consumption rates were detectable but oxygen levels remained above 80% saturation.
Fish were not fed for 48 h prior to measurements. This is an appropriate time interval to allow gut evacuation at the test temperature and thereby prevent the energetic costs of digestion, tissue synthesis and deposition from influencing measurements of standard metabolic rate (Higgins & Talbot 1985; Secor 2009; Rosenfeld et al. 2014). Fish were then placed in individual respirometry chambers, and their oxygen consumption was measured continuously over a 20-h period (from roughly 1400 to 1000 the next day). The system permitted the simultaneous continuous measurement of oxygen consumption rates of 15 fish each day (a total of 8 batches over 9 days), with a fish-free chamber serving as a control measure of background respiration. Standard metabolic rate (mg O2 h−1) was measured as follows:
where Vw is the flow rate of water through the respirometry chamber (L h−1), and  control and
  fish are the concentrations of oxygen (mg L−1) in the outflow of the chambers lacking and containing fish, respectively (Clark, Sandblom & Jutfelt 2013). SMR for each fish was calculated by taking the mean of the lowest 10th percentile of oxygen consumption measurements over the 20-h measurement period and then excluding outliers, that is those measurements below 2 standard deviations from this mean (Clark, Sandblom & Jutfelt 2013).
Statistical analyses
We first examined the relationship between double log-transformed SMR and body mass. Since body mass can influence both metabolic and growth rates, mass-independent estimates of individual SMR (rSMR), that is residuals from the regression, were used in subsequent analyses (Appendix S1b). We then tested whether rSMR changed as a function of food regime over the 28-day period. Food regime, measurement time (i.e. initial and final measurement of rSMR) and their interaction were included as categorical effects. The interaction between food regime and measurement time was statistically significant, so changes in rSMR were further evaluated by testing whether the final metabolic measurement was significantly different from the initial measurement for each food regime. We then used this same approach to test whether initial rSMR was a good predictor of the change in rSMR (ΔrSMR: final rSMR – initial rSMR), after correcting for regression to the mean (Kelly & Price 2005).
Finally, we tested whether ΔrSMR over the 28-day food treatment period had consequences for growth and whether those consequences depended on food regime. The model included food regime as a categorical effect, initial length as a continuous predictor since growth is often a function of body size, ΔrSMR as a continuous predictor and initial rSMR as a continuous predictor since this could also influence growth rates. Interactions among initial rSMR and ΔrSMR with food regime were also included. Error variances of growth (χ2 = 37·5, d.f. = 3, P < 0·001) differed among food treatments, so their error variances were modelled separately. The interaction between ΔrSMR and food regime was statistically significant, so the effects of ΔrSMR on growth were further evaluated for each food regime.
Growth rates at each food level may be a function of the final rSMR rather than ΔrSMR. However, final rSMR and ΔrSMR were highly positively correlated (Pearson’s r = 0·76, P < 0·001), so the effects of final rSMR and ΔrSMR were evaluated in separate models to avoid problems associated with their multicollinearity. Their Akaike information criteria (AIC) values were used to compare the models. The structure of the model including final rSMR was the same as described above for ΔrSMR.
In all analyses, batch number (15 fish per group) was included as a random effect to account for the order in which fish entered the experiment. Fish identity was also included as a random effect when repeated measures of an individual’s SMR were included in the same analysis. Analyses were conducted using the proc MIXED procedure in SAS version 9.3 (SAS Institute, Cary, NC, USA). Growth rate, final rSMR and ΔrSMR were modelled as continuous traits, but we refer to their extremes in the results and discussion section as a means of comparing individuals with contrasting responses. Effects were considered significant when P < 0·05. All means given are ± 1 SE. Of the 120 fish, only 116 were included in analyses because 2 fish regularly consumed less than half their daily rations, and the final standard metabolic rate measurements of 2 fish were compromised by faulty tubing.
Results
Log-transformed SMR (intercept: −1·05 ± 0·04, β: 1·08 ± 0·04, P < 0·001, R2 = 0·74; batch: Wald Z = 1·50, P = 0·07) increased with log-transformed body mass as expected (Fig.1). However, rSMR (i.e. after correcting for body mass) changed after individuals were switched to one of the three food regimes, and the direction of change over the 4-week period differed between food regimes (Table1; Fig.2; food: F2,113 = 3·71, P = 0·03; measurement time: F1,113 = 0·82, P = 0·37; food × measurement time: F2,113 = 6·25, P < 0·01). Individuals varied considerably in their response to a change in food level, but the overall result was that fish on average decreased their rSMR when switched to the low food level (t113 = −2·20, P = 0·03), did not change their rSMR when kept on the intermediate ration (t113 = 1·01, P = 0·31), and increased their rSMR when switched to ad libitum rations (t113 = 2·71, P < 0·01). However, ΔrSMR was not correlated with initial rSMR (food: F2, 110 = 7·67, P < 0·001; initial rSMR: F1, 110 = 1·68, P = 0·11; initial rSMR × food: F2, 110 = 1·74, P = 0·19; batch: Wald Z = 0·89, P = 0·19).
Figure 1.
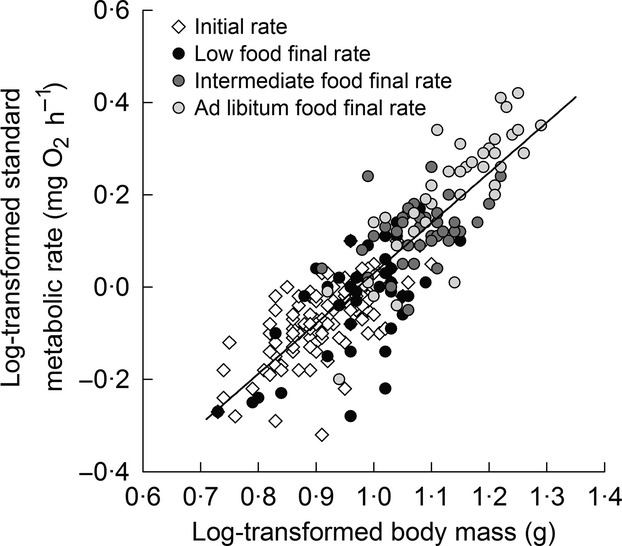
Relationship between standard metabolic rate (SMR; mg O2 h−1) and body mass (mg) of juvenile brown trout. SMR was measured after fish had been on an intermediate ration for 28 days (initial rate) and then measured again (final rate) after they were switched to a low, intermediate or ad libitum ration for an additional 28 days.
Table 1.
Mean ± 1 SE initial and final body mass (g) and standard metabolic rate (mg O2 h−1) of brown trout switched from intermediate to low, intermediate or ad libitum food levels
| Food regime | Body mass (g) | Standard metabolic rate (mg O2 h−1) | ||
|---|---|---|---|---|
| Initial | Final | Initial | Final | |
| Low | 8·42 ± 0·26 | 9·58 ± 0·29 | 0·89 ± 0·03 | 0·96 ± 0·04 |
| Intermediate | 8·44 ± 0·23 | 12·18 ± 0·29 | 0·87 ± 0·02 | 1·33 ± 0·03 |
| Ad libitum | 8·42 ± 0·20 | 14·11 ± 0·46 | 0·87 ± 0·02 | 1·71 ± 0·07 |
Figure 2.
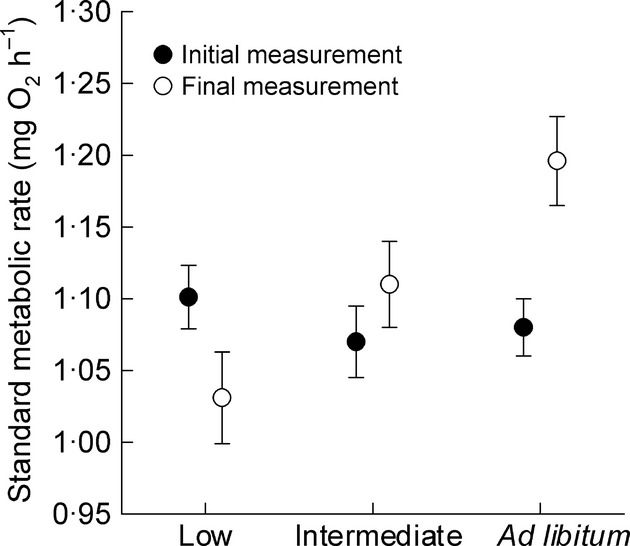
Change in standard metabolic rate (SMR) of juvenile brown trout as a function of food availability. SMR was measured after fish had been on an intermediate ration for 28 days (initial rate) and then measured again (final rate) after they were switched to a low, intermediate or ad libitum ration for an additional 28 days. Plotted are back-transformed SMR values standardized for the mean body mass of 10·2 g.
ΔrSMR but not initial rSMR predicted growth during the 4-week interval following their switch to one of the three food regimes, but effects depended on food regime (Fig.3; food: F2, 106 = 280·79, P < 0·001; initial rSMR: F1, 106 = 1·10, P = 0·30; ΔrSMR: F1, 106 = 3·29, P = 0·07; initial rSMR × food: F2, 106 = 0·51, P = 0·60; ΔrSMR × food: F2, 106 = 6·32, P < 0·01; initial fork length: F1,106 = 10·78, P < 0·01; batch: Wald Z = 0·47, P = 0·32). Among individuals switched to the low food ration, growth rates ranged from 0·04 to 0·33 mm per day (mean: 0·19 ± 0·01), and individuals that decreased their rSMR grew at a faster rate than individuals that increased or did not change their rSMR (Fig.3; t106 = −2·49, P = 0·01). In contrast, growth rates among individuals switched to ad libitum rations ranged from 0·23 to 0·71 mm per day (mean: 0·54 ± 0·02), and individuals that increased their rSMR grew at a faster rate than individuals that decreased or did not change their rSMR (Fig.3; t106 = 2·75, P = 0·01). At the intermediate food level, growth rates ranged from 0·25 to 0·50 mm day−1 (mean: 0·40 ± 0·01), but there was no relationship between growth and flexibility in rSMR (t106 = 0·48, P = 0·63). Models including ΔrSMR versus final rSMR as predictors produced similar results and identical AIC values of −242·4 (Appendix S1c).
Figure 3.
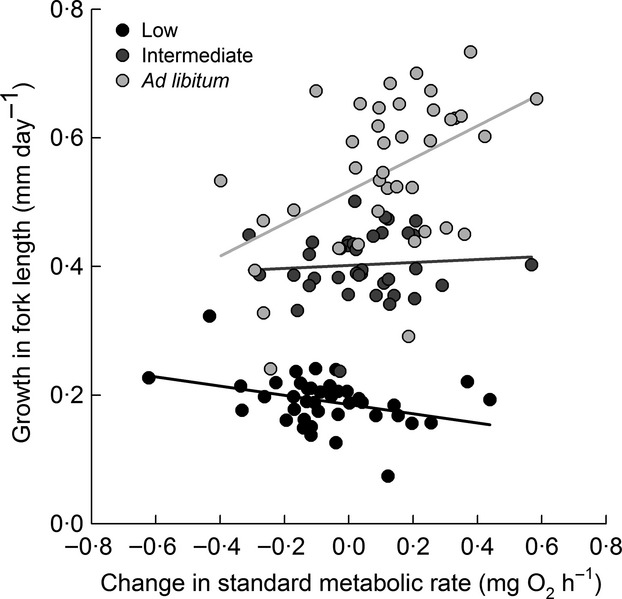
Growth in fork length as a function of change in standard metabolic rate in juvenile brown trout. SMR was measured after fish had been on an intermediate ration for 28 days and then measured again after they were switched to a low, intermediate or ad libitum ration for an additional 28 days. Plotted are partial residuals of growth rate evaluated at mean fork length = 91 mm and mean initial rSMR = 0 as a function of back-transformed values for the change in SMR standardized for the mean body mass of 10·2 g.
Discussion
Standard metabolic rate changed a considerable degree in response to food availability. While the general trend was for SMR to increase when food levels were raised and decrease when food levels declined, individuals exhibited markedly different responses to the same change in food availability. The result was that those individuals who increased their SMR more had a higher final SMR than those whose metabolic rates were inflexible or decreased. These differences in flexibility and their subsequent effects on final SMR, in turn, had consequences for their growth rates. Individuals that increased their SMR more in response to elevated food levels grew fastest, while growth under low food levels was faster in individuals that depressed their SMR most. These differences in metabolic flexibility were associated with over 3-fold differences in growth among some individuals even when accounting for food level.
Both final SMR and growth were higher at higher food levels, but links between SMR and growth were not always positive and changed as a function of food level. Together, these results suggest that the relationship between SMR and growth may be causal and not just an artefact of their mutual dependence on food availability (Van Leeuwen, Rosenfeld & Richards 2012; Rosenfeld et al. 2014). Furthermore, they point to the processes underlying SMR as being the cause and not the effect of individual variation in growth. If the latter were true, then we would expect a positive relationship between SMR and growth regardless of food level rather than the negative one we observed at low food levels. Indeed, shifts in SMR are thought to reflect underlying changes in digestive and assimilative processes (Armstrong & Bond 2013), mitochondrial efficiency (Monternier et al. 2014) and/or respiratory substrate use (McCue 2010) that may be critical for growth and explain observed relationships between metabolic rates and growth across the spectrum of food availability.
The changes in SMR we observed also highlight the need to control for variation in food intake among individuals in studies aimed at quantifying individual variation in metabolic rates and their links to other traits and ultimately fitness under common conditions. Studies across a wide range of taxa have often used animals that are reared in communal tanks or cages (e.g. McCarthy 2000; Terblanche, Klok & Chown 2004; Steyermark et al. 2005) where the establishment of dominance hierarchies can lead to asymmetries in food intake (Sloman & Armstrong 2002; Herberholz, McCurdy & Edwards 2007) that may affect subsequent measurements of standard metabolic rate. Isolating individuals and feeding each a standardized ration, as we have done here, should help to alleviate these confounding effects of food intake.
An individual’s initial SMR had no effect on the degree to which its SMR changed nor its subsequent rates of growth once food levels changed. This suggests that knowledge of an individual’s SMR can allow us to predict its performance under the current conditions, but not necessarily if those conditions change. Furthermore, it argues that patterns of food availability, that is constant versus variable, and the time an organism has spent under those conditions need to be taken into account since relationships between metabolic rates and performance, much like when evaluated at different temperatures (Gräns et al. 2014), may depend on whether an organism is acutely exposed or acclimated to current food conditions.
The link between the change in SMR, but not an individual’s initial SMR, and growth under changing food levels also points to an organism’s flexibility in metabolic rate (and thereby its capacity to respond to changing food availability) as a potentially more important target of selection than its metabolic rate at only one point in time. Individuals with a higher degree of metabolic flexibility may have a selective advantage in variable environments. However, it was not just the degree of flexibility per se but also the direction of change and the subsequent final SMR that were important for growth. Although the majority of individuals in our study shifted their SMR in the direction that promoted higher growth, some increased and decreased their SMR at low and high food levels, respectively, even at expense to their growth. These latter responses may be maladaptive or represent alternative strategies to maximize other aspects of fitness. For example, increasing SMR may serve to preserve somatic maintenance and repair when food becomes scarce, while decreasing SMR in response to high food levels may help to maximize metabolic scope (aerobic capacity above that of SMR) for other functions such as digestion and activity that SMR might otherwise impinge on. However, further study is needed. Additionally, it is unclear whether some individuals are more flexible in general or only within a limited range of food availability.
Flexibility in SMR can allow individuals to maximize their growth under the constraints imposed by variability in food availability, as we show here. Given that SMR is a fundamental trait underlying many aspects of organismal performance, it likely plays an equally important role in allowing organisms to cope with changes in many environmental factors in addition to food availability. Indeed, there is increasing evidence that SMR can change in response to factors such as diet quality (Naya, Lardies & Bozinovic 2007), temperature (McKechnie, Chetty & Lovegrove 2007), hypoxia (Hochachka et al. 1996) and salinity (Allan, Froneman & Hodgson 2006). In addition to its effects on growth, this flexibility may also be a key determinant of how other components of fitness such as reproduction and survival are affected by environmental change. However, the costs, benefits and ultimate fitness consequences of these shifts in metabolism are rarely quantified explicitly. Given the pressing need to gauge the capacity of species and populations to cope with current rapid environmental change, we therefore need more studies that evaluate not just how metabolic rates change in response to different environmental factors, but also what their consequences are for individual fitness and subsequent population vital rates and dynamics.
Acknowledgments
We are indebted to T. van Leeuwen and N. Sinclair for collecting the fish, J. Orledge for organizing equipment, G. Law, A. Kirk and R. Phillips for maintaining the aquarium and fish stocks prior to the experiment, and three anonymous reviewers and an associate editor whose comments improved the manuscript. All procedures were carried out under the jurisdiction of the UK Home Office project license (PPL 60/4292) governed by the UK Animals Scientific Procedures Act 1986. This research was supported by an ERC Advanced Grant (number 322784) to NBM.
Data accessibility
Data have been archived in Appendix S1d of the online Supporting Information.
Supporting Information
Appendix S1. a) Food treatment assignment and calculation of rations; b) Derivation of mass-independent estimates of standard metabolic rate; c) Results from model using final rSMR as a predictor of growth; and d) Data used in analyses of growth and metabolism.
References
- Allan EL, Froneman PW. Hodgson AN. Effects of temperature and salinity on the standard metabolic rate (SMR) of the caridean shrimp Palaemon peringueyi. Journal of Experimental Marine Biology and Ecology. 2006;337:103–108. [Google Scholar]
- Armstrong JB. Bond MH. Phenotype flexibility in wild fish: Dolly Varden regulate assimilative capacity to capitalize on annual pulsed subsidies. Journal of Animal Ecology. 2013;82:966–975. doi: 10.1111/1365-2656.12066. [DOI] [PubMed] [Google Scholar]
- Biro PA. Stamps JA. Do consistent individual differences in metabolic rate promote consistent individual differences in behavior? Trends in Ecology & Evolution. 2010;25:653–659. doi: 10.1016/j.tree.2010.08.003. [DOI] [PubMed] [Google Scholar]
- Blanckenhorn WU. Behavioral causes and consequences of sexual size dimorphism. Ethology. 2005;111:977–1016. [Google Scholar]
- Bolnick DI, Amarasekare P, Araújo MS, Bürger R, Levine JM, Novak M, et al. Why intraspecific trait variation matters in community ecology. Trends in Ecology & Evolution. 2011;26:183–192. doi: 10.1016/j.tree.2011.01.009. [DOI] [PMC free article] [PubMed] [Google Scholar]
- Burton T, Killen S, Armstrong J. Metcalfe N. What causes intraspecific variation in resting metabolic rate and what are its ecological consequences? Proceedings of the Royal Society B: Biological Sciences. 2011;278:3465–3473. doi: 10.1098/rspb.2011.1778. [DOI] [PMC free article] [PubMed] [Google Scholar]
- Careau V, Thomas D, Humphries MM. Réale D. Energy metabolism and animal personality. Oikos. 2008;117:641–653. [Google Scholar]
- Carlson SM, Olsen EM. Vøllestad LA. Seasonal mortality and the effect of body size: a review and an empirical test using individual data on brown trout. Functional Ecology. 2008;22:663–673. [Google Scholar]
- Clark TD, Sandblom E. Jutfelt F. Aerobic scope measurements of fishes in an era of climate change: respirometry, relevance and recommendations. Journal of Experimental Biology. 2013;216:2771–2782. doi: 10.1242/jeb.084251. [DOI] [PubMed] [Google Scholar]
- Derting TL. Metabolism and food availability as regulators of production in juvenile cotton rats. Ecology. 1989;70:587–595. [Google Scholar]
- Einum S. Fleming IA. Maternal effects of egg size in brown trout (Salmo trutta): norms of reaction to environmental quality. Proceedings of the Royal Society of London Series. B: Biological Sciences. 1999;266:2095–2100. [Google Scholar]
- Elliott J. The energetics of feeding, metabolism and growth of brown trout (Salmo trutta L.) in relation to body weight, water temperature and ration size. Journal of Animal Ecology. 1976;45:923–948. [Google Scholar]
- Elliott JM. Diel changes in invertebrate drift and food of trout Salmo trutta L. Journal of Fish Biology. 1970;2:161–165. [Google Scholar]
- Fry FE. The effect of environmental factors on the physiology of fish. In: Randall DJ, editor; Hoar WS, editor. Fish Physiology. New York, NY: Academic Press; 1971. pp. 1–98. [Google Scholar]
- Fu S-J, Xie X-J. Cao Z-D. Effect of fasting and repeat feeding on metabolic rate in southern catfish, Silurus meridionalis Chen. Marine and Freshwater Behaviour and Physiology. 2005;38:191–198. [Google Scholar]
- Gebhardt-Henrich S. Richner H. Causes of growth variation and its consequences for fitness. Oxford Ornithology Series. 1998;8:324–339. [Google Scholar]
- Gräns A, Jutfelt F, Sandblom E, Jönsson E, Wiklander K, Seth H, et al. Aerobic scope fails to explain the detrimental effects on growth resulting from warming and elevated CO2 in Atlantic halibut. Journal of Experimental Biology. 2014;217:711–717. doi: 10.1242/jeb.096743. [DOI] [PubMed] [Google Scholar]
- Guppy M. Withers P. Metabolic depression in animals: physiological perspectives and biochemical generalizations. Biological Reviews of the Cambridge Philosophical Society. 1999;74:1–40. doi: 10.1017/s0006323198005258. [DOI] [PubMed] [Google Scholar]
- Herberholz J, McCurdy C. Edwards DH. Direct benefits of social dominance in juvenile crayfish. Biological Bulletin. 2007;213:21–27. doi: 10.2307/25066615. [DOI] [PubMed] [Google Scholar]
- Hervant F, Mathieu J. Durand J. Behavioural, physiological and metabolic responses to long-term starvation and refeeding in a blind cave-dwelling (Proteus anguinus) and a surface-dwelling (Euproctus asper) salamander. Journal of Experimental Biology. 2001;204:269–281. doi: 10.1242/jeb.204.2.269. [DOI] [PubMed] [Google Scholar]
- Higgins P. Talbot C. Growth and feeding in juvenile Atlantic salmon (Salmo salar L.) In: Bell JG, editor; Cowey CB, Mackie AM, editors. Nutrition and feeding in fish. London: Academic Press; 1985. pp. 243–263. [Google Scholar]
- Hochachka P, Buck L, Doll C. Land S. Unifying theory of hypoxia tolerance: molecular/metabolic defense and rescue mechanisms for surviving oxygen lack. Proceedings of the National Academy of Sciences USA. 1996;93:9493–9498. doi: 10.1073/pnas.93.18.9493. [DOI] [PMC free article] [PubMed] [Google Scholar]
- Hofmann GE. Todgham AE. Living in the now: physiological mechanisms to tolerate a rapidly changing environment. Annual Review of Physiology. 2010;72:127–145. doi: 10.1146/annurev-physiol-021909-135900. [DOI] [PubMed] [Google Scholar]
- Johnsson J, Nöbbelin F. Bohlin T. Territorial competition among wild brown trout fry: effects of ownership and body size. Journal of Fish Biology. 1999;54:469–472. [Google Scholar]
- Kelly C. Price TD. Correcting for regression to the mean in behavior and ecology. American Naturalist. 2005;166:700–707. doi: 10.1086/497402. [DOI] [PubMed] [Google Scholar]
- Killen SS, Marras S. McKenzie DJ. Fuel, fasting, fear: routine metabolic rate and food deprivation exert synergistic effects on risk-taking in individual juvenile European sea bass. Journal of Animal Ecology. 2011;80:1024–1033. doi: 10.1111/j.1365-2656.2011.01844.x. [DOI] [PubMed] [Google Scholar]
- Kvist A. Lindström Å. Basal metabolic rate in migratory waders: intra-individual, intraspecific, interspecific and seasonal variation. Functional Ecology. 2001;15:465–473. [Google Scholar]
- Labocha MK, Sadowska ET, Baliga K, Semer AK. Koteja P. Individual variation and repeatability of basal metabolism in the bank vole, Clethrionomys glareolus. Proceedings of the Royal Society of London B: Biological Sciences. 2004;271:367–372. doi: 10.1098/rspb.2003.2612. [DOI] [PMC free article] [PubMed] [Google Scholar]
- Lagarrigue T, Céréghino R, Lim P, Reyes-Marchant P, Chappaz R, Lavandier P, et al. Diel and seasonal variations in brown trout (Salmo trutta) feeding patterns and relationship with invertebrate drift under natural and hydropeaking conditions in a mountain stream. Aquatic Living Resources. 2002;15:129–137. [Google Scholar]
- Martin-Smith KM. Armstrong JD. Growth rates of wild stream-dwelling Atlantic salmon correlate with activity and sex but not dominance. Journal of Animal Ecology. 2002;71:413–423. [Google Scholar]
- Mathot KJ. Dingemanse NJ. Energetics and behavior: unrequited needs and new directions. Trends in Ecology & Evolution. 2015;30:199–206. doi: 10.1016/j.tree.2015.01.010. [DOI] [PubMed] [Google Scholar]
- McCarthy I. Temporal repeatability of relative standard metabolic rate in juvenile Atlantic salmon and its relation to life history variation. Journal of Fish Biology. 2000;57:224–238. [Google Scholar]
- McCue MD. Snakes survive starvation by employing supply-and demand-side economic strategies. Zoology. 2007;110:318–327. doi: 10.1016/j.zool.2007.02.004. [DOI] [PubMed] [Google Scholar]
- McCue MD. Starvation physiology: reviewing the different strategies animals use to survive a common challenge. Comparative Biochemistry and Physiology Part A: Molecular & Integrative Physiology. 2010;156:1–18. doi: 10.1016/j.cbpa.2010.01.002. [DOI] [PubMed] [Google Scholar]
- McKechnie AE. Phenotypic flexibility in basal metabolic rate and the changing view of avian physiological diversity: a review. Journal of Comparative Physiology B. 2008;178:235–247. doi: 10.1007/s00360-007-0218-8. [DOI] [PubMed] [Google Scholar]
- McKechnie AE, Chetty K. Lovegrove BG. Phenotypic flexibility in the basal metabolic rate of laughing doves: responses to short-term thermal acclimation. Journal of Experimental Biology. 2007;210:97–106. doi: 10.1242/jeb.02615. [DOI] [PubMed] [Google Scholar]
- Monternier P-A, Marmillot V, Rouanet J-L. Roussel D. Mitochondrial phenotypic flexibility enhances energy savings during winter fast in king penguin chicks. Journal of Experimental Biology. 2014;217:2691–2697. doi: 10.1242/jeb.104505. [DOI] [PubMed] [Google Scholar]
- Naya DE, Lardies MA. Bozinovic F. The effect of diet quality on physiological and life-history traits in the harvestman Pachylus paessleri. Journal of Insect Physiology. 2007;53:132–138. doi: 10.1016/j.jinsphys.2006.11.004. [DOI] [PubMed] [Google Scholar]
- Nespolo RF. Franco M. Whole-animal metabolic rate is a repeatable trait: a meta-analysis. Journal of Experimental Biology. 2007;210:2000–2005. doi: 10.1242/jeb.02780. [DOI] [PubMed] [Google Scholar]
- Nussey DH, Wilson AJ. Brommer JE. The evolutionary ecology of individual phenotypic plasticity in wild populations. Journal of Evolutionary Biology. 2007;20:831–844. doi: 10.1111/j.1420-9101.2007.01300.x. [DOI] [PubMed] [Google Scholar]
- O’Connor K, Taylor A. Metcalfe N. The stability of standard metabolic rate during a period of food deprivation in juvenile Atlantic salmon. Journal of Fish Biology. 2000;57:41–51. [Google Scholar]
- Ostrowski S, Mésochina P. Williams JB. Physiological adjustments of sand gazelles (Gazella subgutturosa) to a boom-or-bust economy: standard fasting metabolic rate, total evaporative water loss, and changes in the sizes of organs during food and water restriction. Physiological and Biochemical Zoology. 2006;79:810–819. doi: 10.1086/504614. [DOI] [PubMed] [Google Scholar]
- Reid D, Armstrong JD. Metcalfe NB. Estimated standard metabolic rate interacts with territory quality and density to determine the growth rates of juvenile Atlantic salmon. Functional Ecology. 2011;25:1360–1367. [Google Scholar]
- Roark AM. Bjorndal KA. Metabolic rate depression is induced by caloric restriction and correlates with rate of development and lifespan in a parthenogenetic insect. Experimental Gerontology. 2009;44:413–419. doi: 10.1016/j.exger.2009.03.004. [DOI] [PubMed] [Google Scholar]
- Rosenfeld J, Van Leeuwen T, Richards J. Allen D. Relationship between growth and standard metabolic rate: measurement artefacts and implications for habitat use and life-history adaptation in salmonids. Journal of Animal Ecology. 2014;84:791–799. doi: 10.1111/1365-2656.12260. [DOI] [PubMed] [Google Scholar]
- Secor SM. Specific dynamic action: a review of the postprandial metabolic response. Journal of Comparative Physiology B. 2009;179:1–56. doi: 10.1007/s00360-008-0283-7. [DOI] [PubMed] [Google Scholar]
- Sloman K. Armstrong J. Physiological effects of dominance hierarchies: laboratory artefacts or natural phenomena? Journal of Fish Biology. 2002;61:1–23. [Google Scholar]
- Sogard SM. Size-selective mortality in the juvenile stage of teleost fishes: a review. Bulletin of Marine Science. 1997;60:1129–1157. [Google Scholar]
- Steyermark AC, Miamen AG, Feghahati HS. Lewno AW. Physiological and morphological correlates of among-individual variation in standard metabolic rate in the leopard frog Rana pipiens. Journal of Experimental Biology. 2005;208:1201–1208. doi: 10.1242/jeb.01492. [DOI] [PubMed] [Google Scholar]
- Terblanche JS, Klok CJ. Chown S. Metabolic rate variation in Glossina pallidipes (Diptera: Glossinidae): gender, ageing and repeatability. Journal of Insect Physiology. 2004;50:419–428. doi: 10.1016/j.jinsphys.2004.02.009. [DOI] [PubMed] [Google Scholar]
- Tuomainen U. Candolin U. Behavioural responses to human-induced environmental change. Biological Reviews. 2011;86:640–657. doi: 10.1111/j.1469-185X.2010.00164.x. [DOI] [PubMed] [Google Scholar]
- Van Leeuwen TE, Rosenfeld JS. Richards JG. Effects of food ration on SMR: influence of food consumption on individual variation in metabolic rate in juvenile coho salmon (Onchorhynchus kisutch. Journal of Animal Ecology. 2012;81:395–402. doi: 10.1111/j.1365-2656.2011.01924.x. [DOI] [PubMed] [Google Scholar]
- Wiersma P, Salomons HM. Verhulst S. Metabolic adjustments to increasing foraging costs of starlings in a closed economy. Journal of Experimental Biology. 2005;208:4099–4108. doi: 10.1242/jeb.01855. [DOI] [PubMed] [Google Scholar]
Associated Data
This section collects any data citations, data availability statements, or supplementary materials included in this article.
Supplementary Materials
Appendix S1. a) Food treatment assignment and calculation of rations; b) Derivation of mass-independent estimates of standard metabolic rate; c) Results from model using final rSMR as a predictor of growth; and d) Data used in analyses of growth and metabolism.
Data Availability Statement
Data have been archived in Appendix S1d of the online Supporting Information.