Abstract:
Continuous monitoring and control of arterial carbon dioxide tension (PaCO2) during cardiopulmonary bypass (CPB) is essential. A reliable, accurate, and inexpensive system is not currently available. This study was undertaken to assess whether the continuous monitoring of oxygenator exhaust carbon dioxide tension (PexCO2) can be used to reflect PaCO2 during CPB. A total of 33 patients undergoing CPB for cardiac surgery were included in the study. During normothermia (37°C) and stable hypothermia (31°C), the values of PexCO2 from the oxygenator exhaust outlet were monitored and compared simultaneously with the PaCO2 values. Regression and agreement analysis were performed between PexCO2 and temperature corrected-PaCO2 and temperature uncorrected-PaCO2. At normothermia, a significant correlation was obtained between PexCO2 and PaCO2 (r = 0.79; p < 0.05); there was also a strong agreement between PexCO2 and PaCO2 with a gradient of 3.4 ± 1.9 mmHg. During stable hypothermia, a significant correlation was obtained between PexCO2 and the temperature corrected-PaCO2 (r = 0.78; p < 0.05); also, there was a strong agreement between PexCO2 and temperature corrected-PaCO2 with a gradient of 2.8 ± 2.0 mmHg. During stable hypothermia, a significant correlation was obtained between PexCO2 and the temperature uncorrected-PaCO2 (r = 0.61; p < 0.05); however, there was a poor agreement between PexCO2 and the temperature uncorrected-PaCO2 with a gradient of 13.2 ± 3.8 mmHg. Oxygenator exhaust capnography could be used as a mean for continuously monitoring PaCO2 during normothermic phase of cardiopulmonary bypass as well as the temperature-corrected PaCO2 during the stable hypothermic phase of CPB.
Keywords: exhaust capnography, hypothermia, cardiopulmonary bypass
The continuous monitoring of the membrane oxygenator exhaust CO2 (PexCO2) has been suggested as a substitute for continuous monitoring of PaCO2. However, conflicting results have been reported (1,2). These conflicting results could be attributed to the induction of hypothermia and the rewarming phase of cardiopulmonary bypass (CPB) (3,4), the type of oxygenator (2), the technique and site for CO2 monitoring (5,6), or the site of temperature monitoring (2). This study was undertaken to determine the validity of exhaust CO2 for the continuous prediction of temperature-corrected versus uncorrected PaCO2 during CPB using a membrane oxygenator.
MATERIALS AND METHODS
The study was approved by the Institutional Review Board at the American University of Beirut. Because the study involved no alterations in routine patient management, the Board waived the need for a prior informed consent.
Patients of both genders (18 men/15 women, mean age: 64.2 ± 7.1 years, length of CPB: 50 ± 5 min) and who were undergoing elective cardiac surgery for coronary artery bypass grafting with hemodilution hypothermic CPB using the alpha-stat strategy for carbon dioxide homeostasis and using a membrane oxygenator were included in the study. Anesthesia was induced with midazolam (2 mg), thiopentone (3 mg/kg), xylocaine (2 mg/kg), sufentanyl (25 μg), and rocuronium (0.6 mg/kg), to be followed by tracheal intubation and positive pressure ventilation. Anesthesia was maintained with isoflurane 1–2% in oxygen supplemented with cisatracurium (0.15 mg/kg/h), sufentanyl (1 μg/kg/h), and midazolam (0.1 μg/kg/min). After heparinization (heparin of 4 mg/kg to achieve an ACT > 450 s), CPB was started using a roller pump (Sarns 8000, 3M Health Group, Ann Arbor, MI) and a Trillium membrane oxygenator (Medtronic, Minneapolis, MN).
Nonpulsatile pump flow at 2.4 L/m2/min and a similar oxygen flow were maintained throughout bypass. On bypass, hypothermia was induced by actively cooling patients down to 31°C and cold crystalloid cardioplegia was used for myocardial protection. The blood temperature was continuously monitored with an in-line temperature probe in the CPB circuit. Hypothermia or normothermia was defined as stable after 5–15 min of cooling or rewarming with no more than ±1°C fluctuation in temperature. The oxygenator exhaust outlet of the CPB circuit was connected to a capnograph sensor (Novametrix, Willinford, CT) for continuous monitoring of exhaust CO2 (PexCO2). A 100-cm length of anesthetic tubing was attached behind the capnograph adaptor to act as a reservoir for the exhaust gases and thus prevent entrainment of room air. The same capnograph was used on all patients throughout the whole study. Before each use, it was calibrated and checked using a gas containing a known concentration of carbon dioxide (5% balanced with nitrogen) according to the manufacturer’s instructions and was allowed to warm up for at least 1–2 h before use. All measurements were made during full flow bypass without ejecting heart and mechanical ventilation (i.e., during aortic cross clamp time) and no measurements were made during the cooling and rewarming phases of the CPB. The readings of the capnograph (PexCO2) were noted simultaneously with sampling of the arterial blood samples and monitoring of the blood temperature. Arterial blood gas samples collected from the oxygenator outlet and obtained on all patients at temperatures of 31°C and 37°C were immediately subjected to duplicate measurement by a bench blood gas analyzer (ABL700, Radiometer, Copenhagen, Denmark) and both temperature-corrected PaCO2 and temperatureuncorrected PaCO2 values were determined. The blood gas analyzer was calibrated to two-point calibration immediately before starting CPB and to one-point calibration every 30 min during CPB.
Statistical Analysis
The means and standard deviations of exhaust PCO2 (PexCO2), temperature-corrected PaCO2, and temperature-uncorrected PaCO2 were obtained at 31°C and 37°C. Also, the means and standard deviations of the gradients between PexCO2 and PaCO2 at 37°C and between PexCO2 and temperature-corrected and temperatureuncorrected PaCO2 at 31°C were obtained. These mean values were compared with the Student’s t test and the analysis of variance. The degrees of correlation between PexCO2 and the temperature-corrected PaCO2 and temperature-uncorrected PaCO2 were determined by regression analysis. Also, the degree of agreement between PexCO2 and the temperature-corrected PaCO2 and temperature-uncorrected-PaCO2 were determined with the Bland-Altman analysis (7). Statistical significance was considered at p < 0.05.
A power analysis using a Type I error of 5% and Type II error of 80% indicated that for a non-significant bias between PaCO2 and PexCO2 a sample size of at least 30 patients to be included in the study.
RESULTS
The mean ± standard deviation of PexCO2 and PaCO2 during normothermia (37°C) as well as the temperaturecorrected and temperature-uncorrected PaCO2 during stable hypothermia (31°C) are presented in Table 1.
Table 1.
Mean ± SD (mmHg) of PexCO2, PaCO2, temperaturecorrected PaCO2, and temperature-uncorrected PaCO2 at normothermia (37°C) and during stable hypothermia (31°C).
| n | PexCO2 | PaCO2 | Temperature-Corrected PaCO2 | Temperature-Uncorrected PaCO2 | |
|---|---|---|---|---|---|
| 37°C | 30 | 33.9 ± 3.1 | 37.1 ± 2.9* | N/A | N/A |
| 31°C | 33 | 26.3 ± 2.9 | N/A | 29.0 ± 3.0* | 39.4 ± 4.8* |
p < 0.05 vs. PexCO2.
N/A, not applicable.
During normothermia (37°C), there was a significant positive correlation (r = 0.79, p < 0.05) between PexCO2 and PaCO2 (Figure 1). Also, the Bland-Altman analysis revealed a strong agreement between PexCO2 and PaCO2 (Figure 2) with a gradient of 3.4 ± 1.9 mmHg (Table 2).
Figure 1.
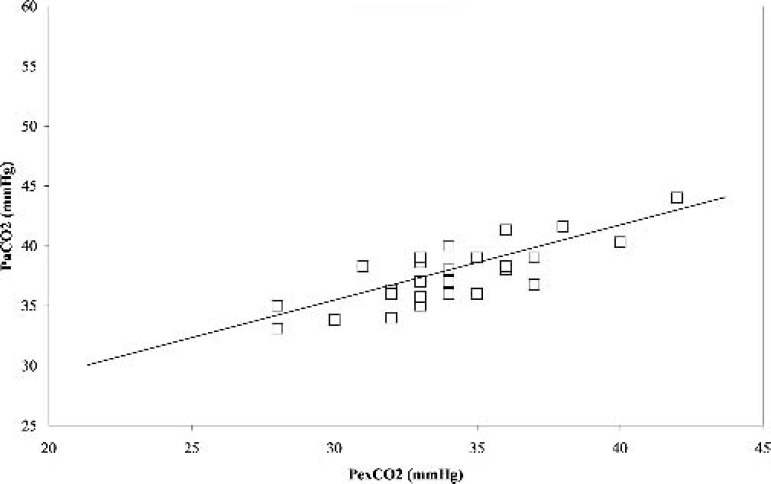
Correlation between the partial pressure of arterial carbon dioxide (PaCO2) and partial pressure of exhaust carbon dioxide (PexCO2) at normothermia. r = 0.79, p < 0.05.
Figure 2.
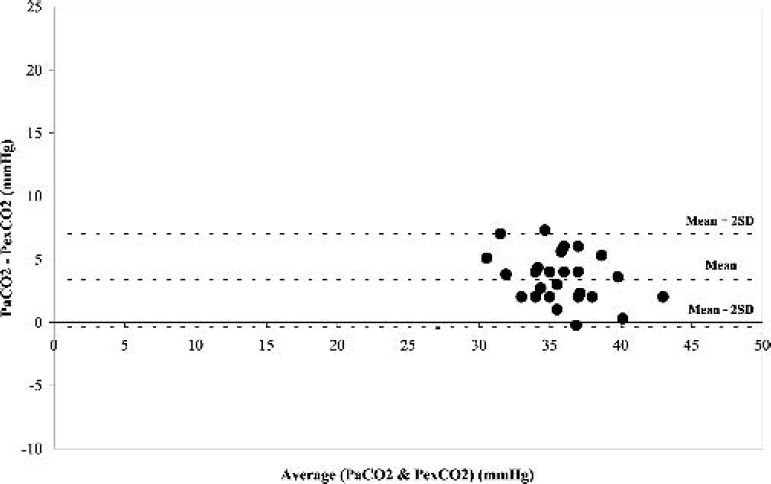
Difference in the partial pressure of arterial carbon dioxide (PaCO2) and partial pressure of exhaust carbon dioxide (PexCO2) against the mean of the two measurements at normothermia.
Table 2.
Mean and SD of the difference (mmHg) between PexCO2 and PaCO2 at normothermia and during hypothermia when corrected and not corrected to blood temperature.
| n | Mean | SD | |
|---|---|---|---|
| Normothermia (37°C) | 30 | 3.8 | 3.7 |
| Stable hypothermia (31°C) | |||
| Temperature-corrected | 33 | 2.3 | 2.6 |
| Temperature-uncorrected | 33 | 13.2* | 3.8 |
p < 0.05 vs. Normothermia.
During hypothermia (31°C), a similar significant positive correlation (r = 0.78, p < 0.05) was obtained between PexCO2 and the temperature-corrected PaCO2 (Figure 3). The Bland-Altman analysis also revealed a strong agreement between PexCO2 and the temperature-corrected PaCO2 (Figure 4) with a gradient of 2.8 ± 2.0 mmHg (Table 2). However, when the comparison was made between PexCO2 and the temperature-uncorrected PaCO2, there was a decrease in the strength of correlation (r = 0.61, p < 0.05; Figure 5) and a poor agreement as revealed by the Bland-Altman analysis (Figure 6) with a gradient of 13.2 ± 3.8 mmHg (Table 2).
Figure 3.
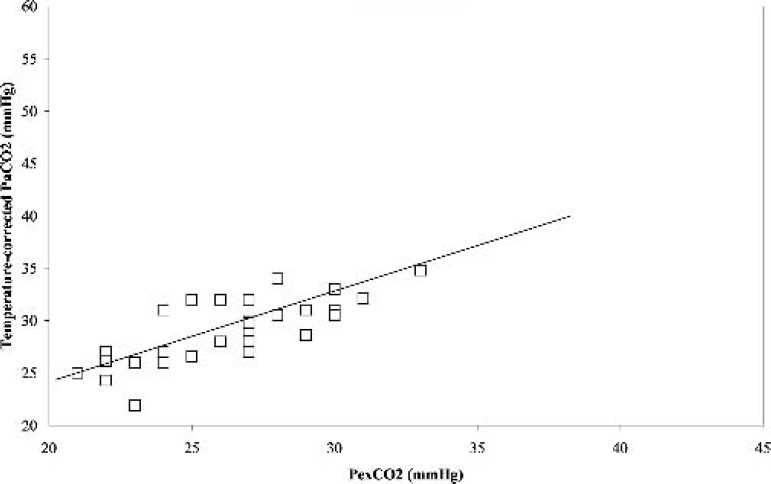
Correlation between the partial pressure of temperature corrected arterial carbon dioxide (Temperature corrected-PaCO2) and partial pressure of exhaust carbon dioxide (PexCO2) during stable hypothermia. r = 0.78, p < 0.05.
Figure 4.
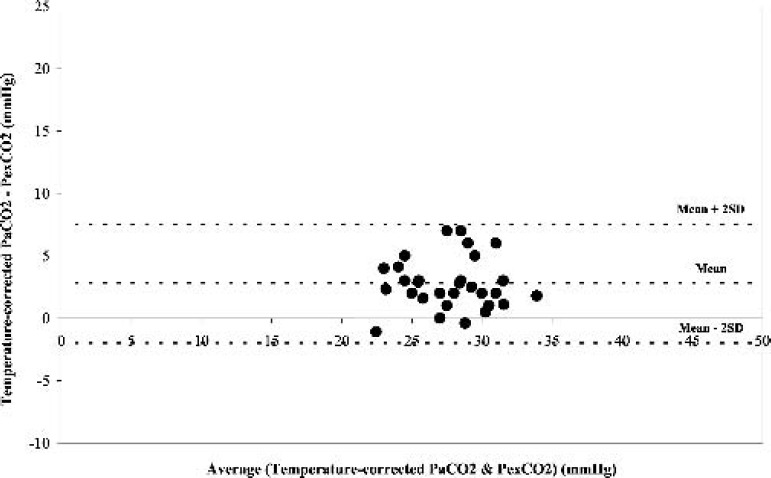
Difference in the partial pressure of temperature-corrected arterial carbon dioxide (Temperature corrected-PaCO2) and partial pressure of exhaust carbon dioxide (PexCO2) against the mean of the two measurements during stable hypothermia.
Figure 5.
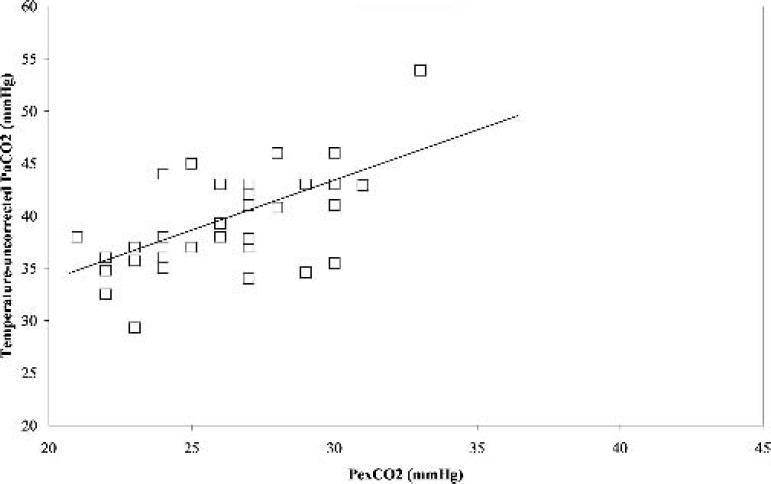
Correlation between the partial pressure of temperatureuncorrected arterial carbon dioxide (Temperature uncorrected-PaCO2) and partial pressure of exhaust carbon dioxide (PexCO2) during stable hypothermia. r = 0.61, p < 0.05.
Figure 6.
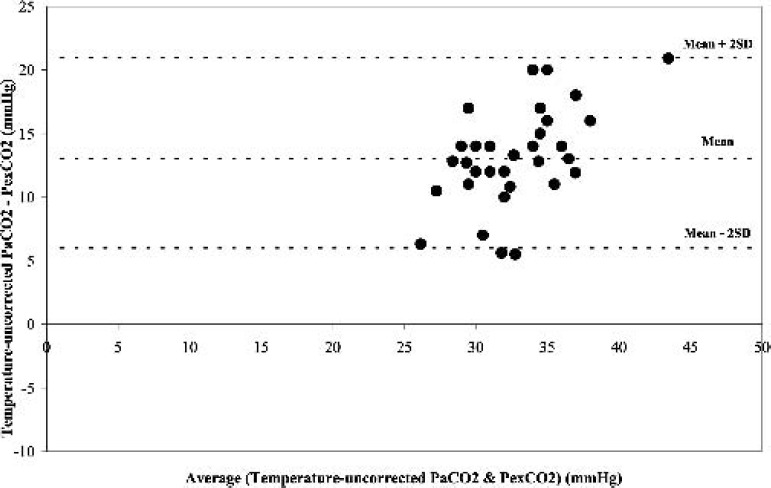
Difference in the partial pressure of temperature-uncorrected arterial carbon dioxide (Temperature uncorrected-PaCO2) and partial pressure of exhaust carbon dioxide (PexCO2) against the mean of the two measurements at normothermia.
DISCUSSION
Close monitoring and control of PaCO2 are important during all phases of CPB as carbon dioxide is the main determinant of acid-base balance and the cerebral blood flow (3,8). This supports the use of continuous monitoring of arterial PaCO2during normothermic and hypothermic CPB. However, in-line continuous monitoring of PaCO2 is expensive and prone to errors particularly when used for long duration (5,6).
Our results showed that during CPB using a membrane oxygenator, there is a strong agreement between arterial and exhaust carbon dioxide tensions at normothermia. During hypothermia a similar strong agreement was observed between temperature-corrected arterial carbon dioxide and exhaust carbon dioxide tensions; however, a poor agreement was observed between temperatureuncorrected arterial carbon dioxide and exhaust carbon dioxide tensions. Our results are in agreement with those reported by Potger et al. (9), which suggested that oxygenator exhaust capnography might be a simple and inexpensive adjunct to the bench blood gas analyzer in continuously estimating PaCO2 of a clinically useful degree of accuracy during CPB. The current findings together with the independent correlation by Potger et al. (9) suggest that continuous monitoring of PexCO2 can be used as a surrogate marker of the temperature-corrected PaCO2 during CPB in addition to the intermittent correlative blood gas analysis.
Our data showed that exhaust capnography can parallel closely the PaCO2 during normothermia and the temperature-corrected PaCO2 during stable hypothermia. During normothermia, the average gradients between exhaust carbon dioxide tension and the arterial carbon dioxide tension were 3.4 ± 1.9 mmHg. During stable hypothermia, a similar gradient of 2.8 ± 2.0 mmHg was observed between the exhaust carbon dioxide tension and the temperature-corrected PaCO2. These gradients are significantly smaller than the high gradient of 13.2 ± 3.8 mmHg obtained between exhaust carbon dioxide tension and temperature-uncorrected arterial carbon dioxide tension during stable hypothermia.
Zia et al. (1) reported that the oxygenator exhaust capnography could be used as an inexpensive means of continuously monitoring PaCO2 during cooling and stable hypothermic phases of CPB; however, they reported a gradient of 11.8 ± 2.7 mmHg between the exhaust CO2 tension and the temperature-corrected PaCO2 during stable hypothermia. Their results are different from our current study, which showed a smaller gradient of 2.8 ± 2.0 mmHg during stable hypothermia. This could be attributed to the fact that Zia et al. (1) used a bubble oxygenator while in the current study a membrane oxygenator was used. There are important differences between bubble and membrane oxygenators with respect to transfer of carbon dioxide (10,11). It has been previously reported that bubble oxygenators are relatively inefficient at removing carbon dioxide (10).
O’Leary et al. (2) reported that measurement of carbon dioxide partial pressure in exhaust gases from a membrane oxygenator during CPB was not a useful method for estimating PaCO2. In their study, O’Leary et al. used the nasopharyngeal temperature during hypothermia to correct the PaCO2 values; this may not be the most appropriate site for correcting the PaCO2. Using the temperature of the blood at the point that carbon dioxide is sampled rather than the nasopharyngeal temperature represents a more logical option for temperature correction of PaCO2. In the current study the blood temperature was used to obtain the temperature-corrected PaCO2 during hypothermia.
Our findings suggest that during CPB using the membrane oxygenator, exhaust capnography may reflect continuously the PaCO2 during normothermia, as well as the temperature-corrected PaCO2 during stable hypothermia. However, most centers nowadays are using during hypothermic CPB the alpha-stat and not the pH-stat strategy for acid-base management, and hence depend on the temperature-uncorrected rather than the temperaturecorrected PaCO2 values (12–14).
REFERENCES
- 1.Zia M, Davies FW, Alston RP.. Oxygenator exhaust capnography: a method of estimating arterial carbon dioxide tension during cardiopulmonary bypass. J Cardiothoracic Vasc Anesthesia. 1992;6:42–5. [DOI] [PubMed] [Google Scholar]
- 2.O’Leary MJ, MacDonnell, Ferguson CN.. Oxygenator exhaust capnography as an index of arterial carbon dioxide tension during cardiopulmonary bypass using a membrane oxygenator. Br J Anaesth. 1999;82:843–6. [DOI] [PubMed] [Google Scholar]
- 3.Camerlengo LJ, Dearing JP.. Precise control of PCO2 during cardiopulmonary bypass. 1980. J Extra-Corpor Technol. 2004;36:280–3. [PubMed] [Google Scholar]
- 4.Riley JB.. Prediction of arterial blood PCO2 by measuring the ventilating gas exhaust PCO2 from a bubble oxygenator. J Extra Corpor Technol. 1982;14:312–5. [Google Scholar]
- 5.Alston RP, Trew A.. An in vitro assessment of a monitor for in-line measurement of PO2, PCO2, and pH during cardiopulmonary bypass. Perfusion. 1987;2:139–47. [Google Scholar]
- 6.Alston RP.. A clinical evaluation of a monitor for in-line measurement of PO2, PCO2, and pH during cardiopulmonary bypass. Perfusion. 1988;3:225–31. [Google Scholar]
- 7.Bland JM, Altman DG.. Statistical methods for assessing agreement between two methods of clinical measurement. Lancet. 1986;i:307– 10. [PubMed] [Google Scholar]
- 8.Nevin M, Colchester AC, Adams S, Pepper JR. Evidence for involvement of hypocapnia and hypoperfusion in aetiology of neurological deficit after cardiopulmonary bypass. Lancet. 1987;ii:1493–7. [DOI] [PubMed] [Google Scholar]
- 9.Potger K, McMillan D, Southwell J, Dando H, O’shaughnessy K.. Membrane oxygenator exhaust capnography for continuously estimating arterial carbon dioxide tension during cardiopulmonary bypass. J Extra Corpor Technol. 2003;35:218–23. [PubMed] [Google Scholar]
- 10.Pearson DT, Holden MP, Poslad SJ, et al. A clinical evaluation of the gas transfer characteristics and gaseous microemboli production of two bubble oxygenators. Life Support Syst. 1984;2:252–66. [PubMed] [Google Scholar]
- 11.Voorhees ME, Elgas R.. Membrane and bubble oxygenators. In: Kay P. ed. Techniques in Extracorporeal Circulation, 3rd ed. Oxford: Butterworth-Heinemann; 1992;44–55. [Google Scholar]
- 12.Murkin JM.. The role of CPB management in neurobehavioral outcomes after cardiac surgery. Ann Thorac Surg. 1995;59:1308–11. [DOI] [PubMed] [Google Scholar]
- 13.Baraka A, Haroun S, Baroody M, et al. Effect of hypothermia on arterial versus venous blood gases during cardiopulmonary bypass in man. J Extra Corpor Technol. 1991;23:9–13. [Google Scholar]
- 14.Baraka A, Baroody M, Haroun S, et al. Effect of –Stat versus pH-Stat strategy on oxyhemoglobin dissociation and whole-body oxygen consumption during hypothermic cardiopulmonary bypass. Anesth Analg. 1992;74:32–7. [DOI] [PubMed] [Google Scholar]


