Abstract
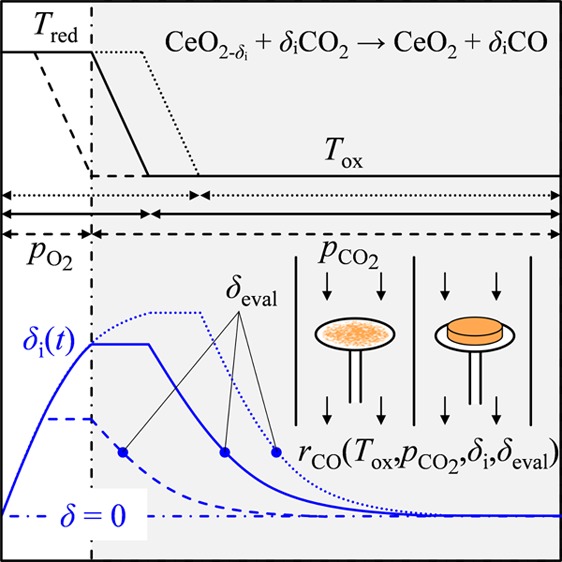
The kinetics of CO2 reduction over nonstoichimetric ceria, CeO2−δ, a material of high potential for thermochemical conversion of sunlight to fuel, has been investigated for a wide range of nonstoichiometries (0.02 ≤ δ ≤ 0.25), temperatures (693 ≤ T ≤ 1273 K), and CO2 concentrations (0.005 ≤ pCO2 ≤ 0.4 atm). Samples were reduced thermally at 1773 K to probe low nonstoichiometries (δ < 0.05) and chemically at lower temperatures in a H2 atmosphere to prevent particle sintering and probe the effect of higher nonstoichiometries (δ < 0.25). For extents greater than δ = 0.2, oxidation rates at a given nonstoichiometry are hindered for the duration of the reaction, presumably because of near-order changes, such as lattice compression, as confirmed via Raman Spectroscopy. Importantly, this behavior is reversible and oxidation rates are not affected at lower δ. Following thermal reduction at very low δ, however, oxidation rates are an order of magnitude slower than those of chemically reduced samples, and rates monotonically increase with the initial nonstoichiometry (up to δ = 0.05). This dependence may be attributed to the formation of stable defect complexes formed between oxygen vacancies and polarons. When the same experiments are performed with 10 mol % Gd3+ doped ceria, in which defect complexes are less prevalent than in pure ceria, this dependence is not observed.
1. Introduction
Conversion and storage of sunlight into renewable fuels using ceria-based solar thermochemical redox cycles has gained considerable interest in recent years.1−8 Ceria and its solid solutions are promising redox materials because of their ability to show high oxygen storage and release capacities,9−11 fast redox kinetics,12−14 single-phase stability at elevated temperatures, and high nonstoichiometries15,16 and abundant existence in Earth’s ore deposits.17 Two-step thermochemical redox cycling comprises (1) an endothermic reduction of ceria driven by concentrated solar energy at elevated temperatures (Tred > 1673 K) and low oxygen partial pressures and (2) an exothermic oxidation of reduced ceria by splitting H2O and CO2 into H2 and CO (syngas) at lower temperatures (T < Tred).14,18−20 If desired, syngas can further be processed to liquid fuels with well-developed catalytic conversion procedures, viz. by Fischer–Tropsch process.21
In general, solar-to-fuel energy conversion efficiency relies on the oxygen storage and release capacity, the radiative heat absorptivity, and kinetics of ceria toward CO2. Various studies have investigated reduction and oxidation kinetics of pure and doped ceria solid solutions.5,13,14,22−25 Using the weight relaxation methodology, Ackermann et al.23 determined ambipolar diffusion coefficients of pure ceria pellets at high temperatures (T < 1773 K). Based on the results, reduction reaction times less than 10 s are estimated for bulk diffusion length scales of 0.4 mm and less. Because of such rapid reaction rates and relatively small characteristic diffusion lengths, reduction within solar reactors is most likely limited by the heating rate rather than chemical kinetics. Such behavior has also been observed experimentally.3,4 Oxidation rates, in contrast, are shown to be primarily dictated by the chemical kinetics of splitting CO2 and H2O. For example, Gopal and Haile13 used an electrical conductivity relaxation technique for determination of bulk oxygen diffusivity within Sm-doped ceria and reported 40 times larger surface reaction rate constants for splitting CO2 compared to H2O. Chueh et al.14 examined activation energies and determined the average fuel production rates (H2O/CO2 = 2:1) by measuring temporal downstream gas concentrations for nonstoichiometric porous Sm-doped ceria placed in a packed bed reactor. In contrast to Gopal and Haile,13 H2 production rates were generally higher compared to CO production rates, and a lower activation energy for dissociation of H2O was observed compared to CO2. Furler et al.5 reported an increase in CO2 splitting rates when surface area is increased by using structures containing micrometer-sized interconnected pores. Similar observations were confirmed by Venstrom et al.25 and Petkovich et al.24 with structures consisting of three-dimensionally ordered and interconnected submicrometer-sized pores. Additionally, Furler et al.5 showed decreasing rates with increasing temperature beyond 1000 K because of a strong influence of the backward reaction with product gas CO. Sørensen26,27 reported changes in oxidation rates and characteristic activation energies with CO2 for different subphases formed at high reduction extents by using quasi-isothermal thermogravimetry at very low oxygen partial pressures (pO2 < 10–10 atm). To date, such phase changes have not been considered for thermochemical fuel conversion applications.
In summary, there is a general consensus that oxidation rates are limited by the specific surface area, whereas reduction rates are typically limited by the rate of heat transfer because of rapid ambipolar diffusion at such elevated temperatures. Despite the promising proof-of-principles in applying the material in a reactor and initial kinetics studies, investigation of the splitting kinetics and associated near-order atomistic changes for the oxide require further attention. Other than the work by Sørensen,26,27 there is little work that has investigated the effect of nonstoichiometry on oxidation rates, yet this data is critical for the design of solar reactors. Therefore, within the framework of this investigation, we elucidate CO2 reduction rates over nonstoichiometric ceria for fine powder and sintered pellets, a very broad range of temperatures and CO2 concentrations, and a large variation of nonstoichiometries. To gain insight into morphology, structure, and chemistry with respect to nonstoichiometry and CO2 reactivity, scanning electron microscopy (SEM), Raman spectroscopy, and thermogravimetry are utilized.
2. Experimental Section
2.1. Sample Fabrication
Ceria samples with different length scales were used, namely, fine powder (Sigma-Aldrich, <5 μm, 99.9% trace metals basis) and sintered pellets made from the same powder or 10 mol % Gd doped ceria (Sigma-Aldrich, 5–10 nm, Ce0.9Gd0.1O1.95). The pellets have a diameter and thickness of 8.8 mm and 1.5 mm, respectively, and were uniaxially cold pressed at 8 tons. The pellets were sintered for 5 h at 1873 K under atmospheric conditions resulting in a porosity <0.05. The grain size was 20–50 μm and 3–10 μm for the undoped and Gd-doped ceria pellets, respectively. The mass of the ceria pellets and powder samples were ∼600 mg and 25–100 mg, respectively.
2.2. Thermogravimetric Analysis
Isothermal oxidation experiments were conducted using a thermogravimetric analysis instrument (TGA, NETZSCH STA 409 CD). The ceria sample was reduced at elevated temperatures and then cooled at a rate of −20 K/min to the desired oxidation temperature followed by isothermal oxidation with CO2. Two different methods were applied to reduce ceria: (1) thermal reduction at 1773 K at low oxygen partial pressure ∼10–4 atm (pellets) and (2) chemical reduction at 1373 K enhanced with pH2 = 0.02 atm (powder and pellets) to prevent sintering. From the absolute sample mass, ms, and temporal weight loss, Δm(t), nonstoichiometry, δ(t), was calculated as shown in eq 1.
| 1 |
where MCeO2 and MO are the molar mass of ceria and oxygen, respectively. The nonstoichiometry right before starting oxidation with CO2 is denoted as the initial nonstoichiometry, δi, as schematically shown in Figure 1. It is changed by varying reduction temperature, reduction duration, and gas flow composition (low pO2 or pH2 = 0.02 atm). Rate of CO production was evaluated at constant nonstoichiometry, denoted as δeval, which represents an averaged value for the sample according to eq 1, and is necessarily smaller than δi (see Figure 1). Buoyancy effects were corrected with blank experiments using equivalent masses of inert zirconium(IV) oxide powder (Sigma-Aldrich, 5 μm, 99% trace metals basis). Additionally, ceria powder oxidation rates were corrected for rate contributions from small oxygen levels present in the system.
Figure 1.
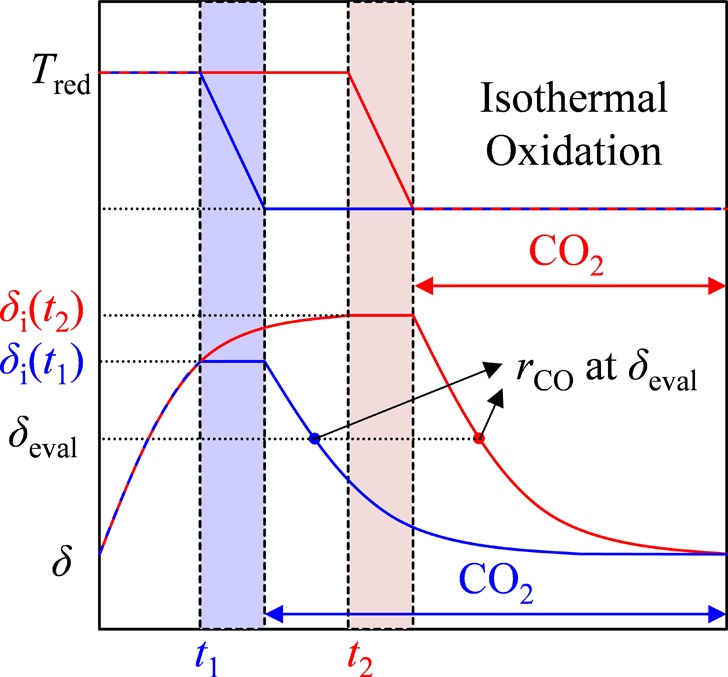
Rate of CO production was evaluated at constant nonstoichiometries, δeval, for oxidations that start from different initial nonstoichiometries, δi, where δi = f(Tred, t, pO2, pH2).
2.3. Analytical Analysis
A Hitachi TM-1000 and Zeiss Supra VP55 SEM instrument were used to optically characterize the samples. Raman spectroscopy was performed using a WITec CRM200 confocal Raman microscope. The spectra were generated with an excitation wavelength of 532 nm by taking the average of three repetitions with an integration time of 20 s.
3. Results and Discussion
3.1. TGA: Ceria Powder
Initial oxidation experiments were performed to examine external mass-transfer limitations. All samples described in this section were reduced for 30 min at 1373 K with pH2 = 0.02 atm in argon at a total volumetric flow rate of 320 mL min–1, leading to an average δi of 0.1. Figure 2 shows δ versus time during oxidation for two different powder masses, 26.8 mg (white triangles) and 54.6 mg (black circles) for different temperatures and CO2 concentrations. From the visual similarity of the weight relaxation curves, external mass-transfer limitations are excluded at these operation conditions.
Figure 2.
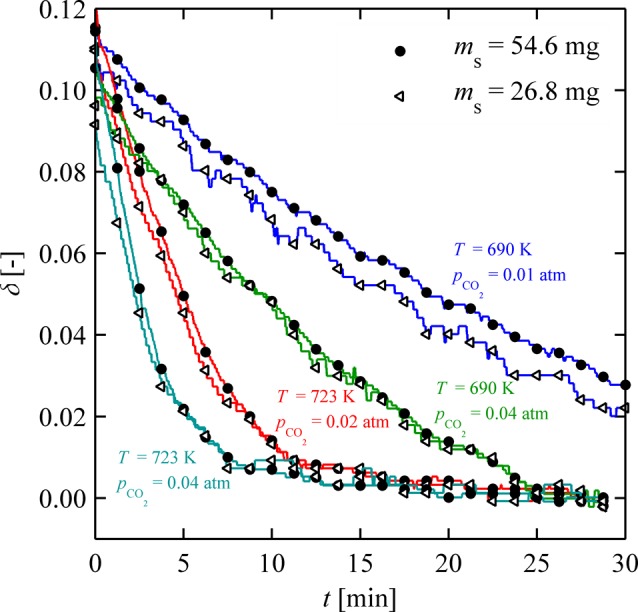
Isothermal weight relaxation curves of ceria oxidation for two different sample masses of 26.8 mg (white triangles) and 54.6 mg (black circles) at different temperatures and CO2 concentrations.
Figure 3a shows relative mass changes as a function of time during oxidation for various temperatures ranging from 693 to 773 K and a constant pCO2 (0.02 atm). In general, oxidation rates increase with increasing temperature, and the oxidation time decreases from 25 to 3 min. At higher temperatures where the reaction is more rapid, however, external mass-transfer limitations and/or the onset of the reverse reaction is eventually observed. As seen in Figure 3b for T > 783 K, rates are less dependent on temperature and eventually decrease with increasing temperature. For example, oxidation rates between 793 and 853 K are nearly identical with an oxidation time of ∼2 min. Further kinetic analysis of the powder samples is limited to temperatures below 773 K where these limitations are not observed.
Figure 3.
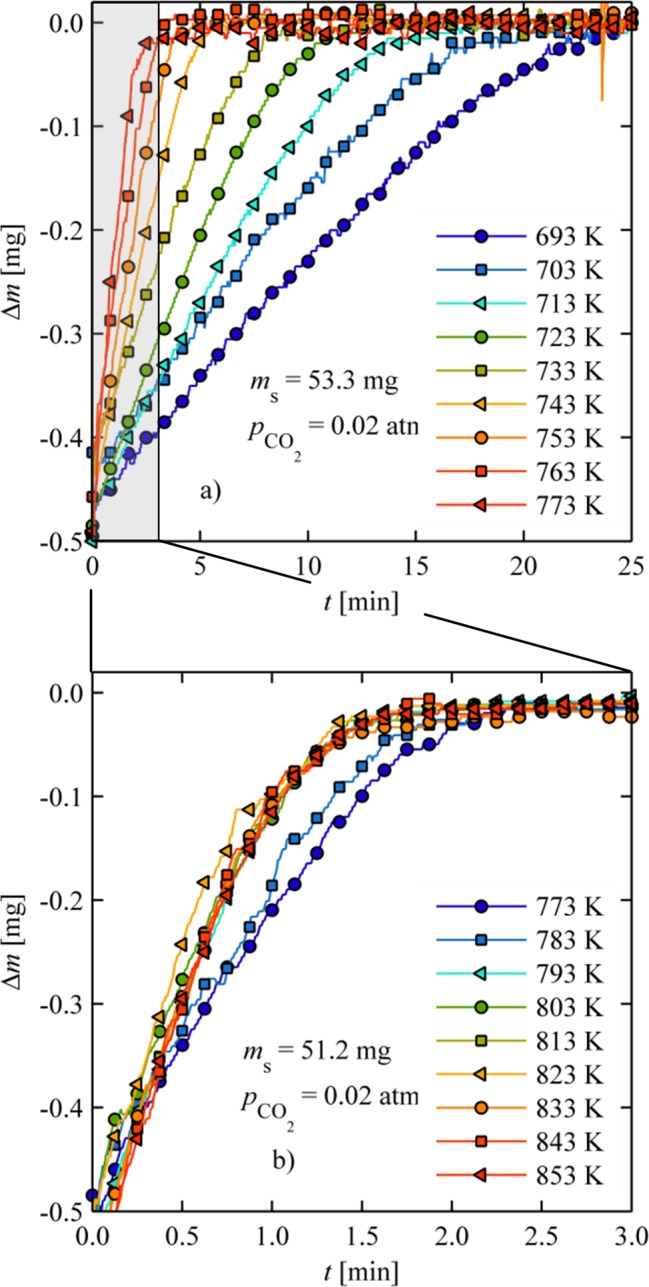
Isothermal oxidation of ceria powder between (a) 693 and 773 K with pCO2 = 0.02 atm and (b) 793 and 853 K with pCO2 = 0.02 atm.
Additional experiments were conducted for pCO2 = 0.005, 0.01, and 0.04 atm, as well as for mixtures of ceria powder and inert zirconia powder with mass loadings (mCeO2/ms) of 50%, 75%, or 100% for pCO2 = 0.02 atm. In Figure 4, the natural logarithm of CO production rates (rCO) evaluated at δeval = 0.04 is shown versus inverse temperature. rCO increases with increasing temperature and CO2 concentration as expected (see least-squares fitted trend lines). There is little dependence on the inert particle mass, giving us further confidence that data are not limited by external mass transfer.
Figure 4.
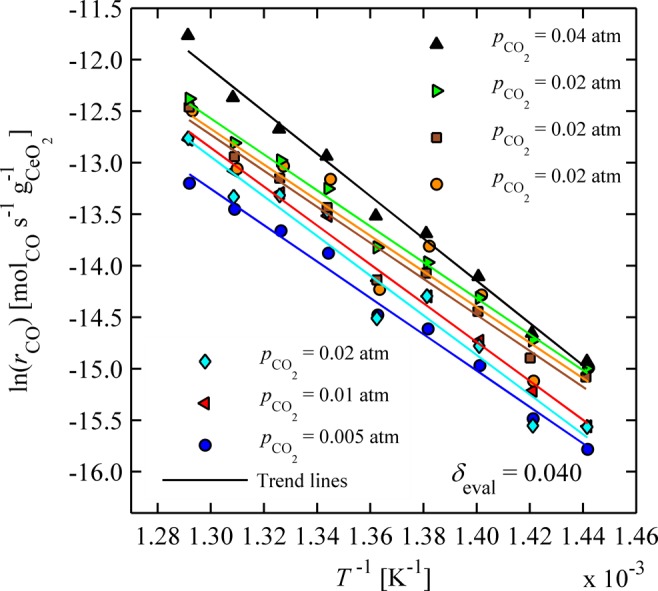
Rates of CO production over oxidizing ceria powder plotted as a function of the inverse temperature for different CO2 concentrations at a constant nonstoichiometry. Orange circles and blue diamonds are results from ceria powder mixed with inert zirconia powder with a ceria mass loading of 75 and 50%, respectively.
Activation energy, EA, was extracted using a simplified rate equation for a more detailed analysis of data. The simplified kinetic rate expression for the case of CO2 reduction over nonstoichiometric ceria, rCO, was defined as the product of the reaction rate constant, k(T), the reaction mechanism, f(δ), and the CO2 concentration, CCO2, with reaction order, n, as shown in eq 2.28
| 2 |
The CO2 concentration is related to the pCO2 through the following relationship:
| 3 |
For constant composition, the slope of the natural logarithm of k·f as a function of inverse temperature yields the activation energy of the reaction. Figure 5a shows natural logarithm of k·f as a function of inverse temperature for several pCO2 data sets at δeval = 0.015 and 0.06 calculated from rate data according to eqs 2 and 3. The data confirms Arrhenius type dependency and shows no dependency on CO2 concentration for n ≈ 0.45 (numerically determined through a least-squares minimization). It should be noted that the function used to describe the reaction mechanism has no bearing on the determination of activation energy because it is evaluated at constant composition.
Figure 5.
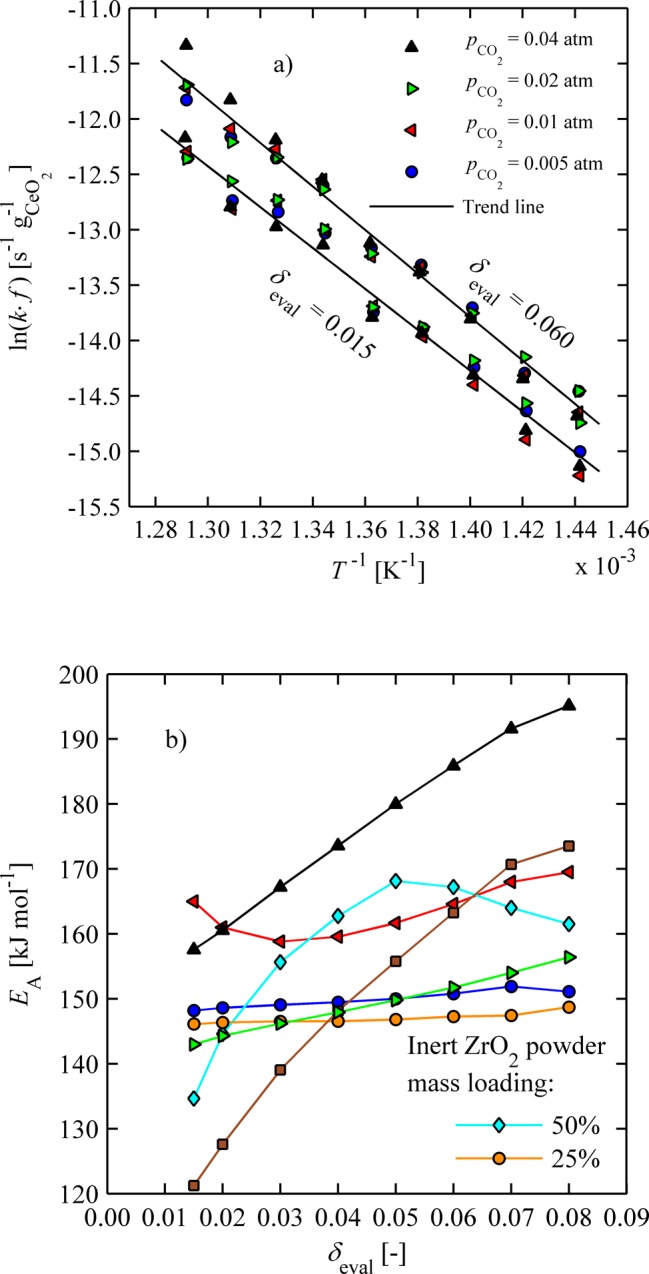
(a) Arrhenius plot of oxidizing ceria powder for several CO2 concentrations at constant nonstoichiometries; (b) activation energy of oxidizing ceria powder as a function of nonstoichiometry (see Figure 4 for legend).
Figure 5b shows EA, extracted from the data sets presented in Figure 4, as a function of δeval. In general, EA stays almost constant over all δeval for lower pCO2 values, with a mean value of ∼145 kJ mol–1. For pCO2 = 0.04, EA increases with increasing δeval from 155 to 190 kJ mol–1. One may hypothesize that in this case, where reactions are most rapid, there is insufficient heat dissipation leading to increased activation energy, in accordance with ref (5). In effect, measured temperatures are probably lower than those observed locally. An additional measurement error is related to the small mass changes due to oxidation in comparison to the natural drifts of the system with time. Furler et al.5 reported activation energies from 90 up to 136 kJ mol–1 for pure ceria at δeval = 0.015. However, oxidation rates were determined from highly porous structures and may be partly affected by pore diffusion limitations resulting in a lower apparent activation energy.29,30
3.2. TGA: Ceria Pellet
3.2.1. Chemical Reduction
To investigate oxidation behavior for T > 783 K, isothermal weight relaxation experiments were conducted with dense ceria pellets where oxidation rates were much slower than for the particles. Experimental errors associated with small mass changes during oxidation could be suppressed because substantially larger sample masses were utilized. Initially, pellets were reduced to different nonstoichiometries and subsequently oxidized at different temperatures. Figure 6a shows rCO (δeval = 0.04) in log space as a function of inverse temperature (913 ≤ T ≤ 1053 K, pCO2 = 0.2 atm, δeval = 0.04) for four different initial nonstoichiometries, namely, δi = 0.07, 0.154, 0.19, and 0.214. Interestingly, rates were strongly dependent on the initial nonstoichiometry, increasing by orders of magnitude with decreasing δi for the lowest temperatures. At higher temperatures the effect was suppressed. Here there is not a linear increase of rates with increasing temperature, as was observed for lower temperatures, presumably because of the onset of the reverse reaction. Figure 6b shows the same data presented in Figure 6a, but as a function of δi for varying temperature. Here, the transition in rates at high nonstoichiometries is more easily observed.
Figure 6.
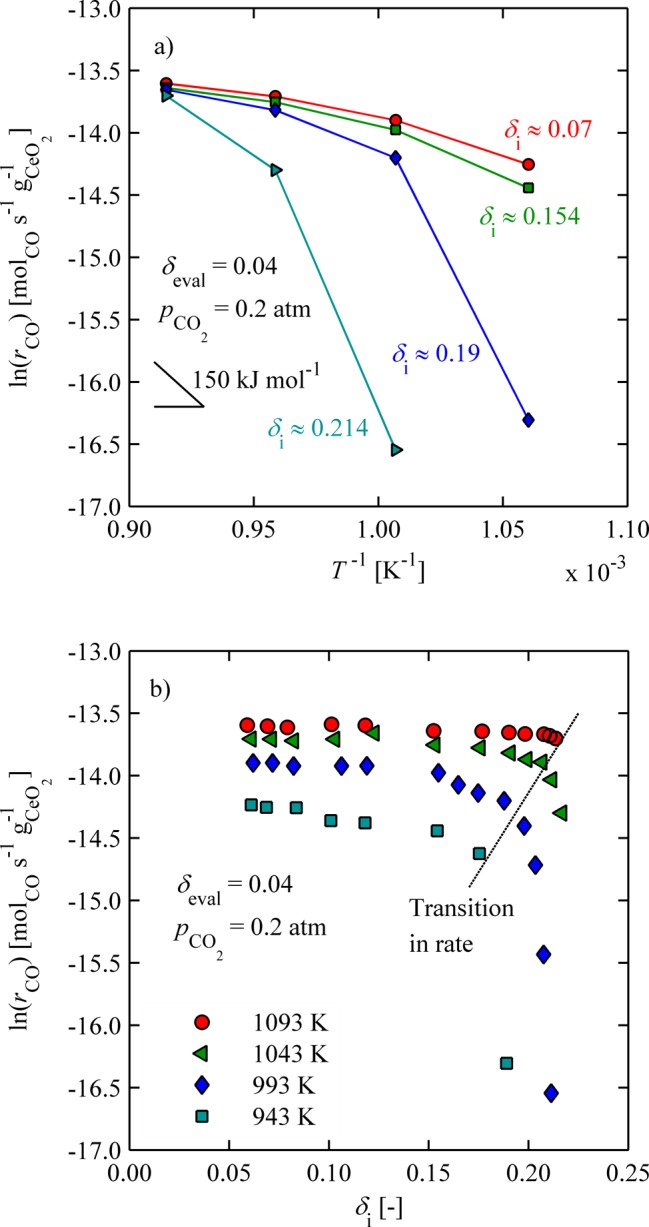
CO production rates for pCO2 = 0.2 atm evaluated at δeval = 0.04: (a) as a function of inverse temperature for several δi; (b) as a function of δi for several temperatures.
Such behavior may be based on a phase change and is a typical explanation for a sudden transition in a physical property of solid oxides. Normally, ceria is assumed to be a single-phase material for the purpose of thermochemical applications; however, several changes in local near order have been reported.27,31−33 For example, Bevan and Kordis31 used sudden changes in thermodynamic properties of ceria to construct a phase diagram between temperatures of 909 and 1442 K and δ between 0 and 0.5. Subphase changes have also been hypothesized by Sorenson27 to explain sudden changes in the slope of partial Gibbs free energies at high nonstoichiometries. Several ordered intermediate phases were proposed within the ά-phase region, each consisting of its own apparent nonstoichiometric single phase. In fact, the rate transition region shown in Figure 6b is found to be very close to a phase boundary, as shown in Figure 7. Here, the phase diagram of CeO2−δ, determined from specific heat measurements reported by Riess and co-workers32 with y = 2 – δ, is plotted alongside colored dots representing the transition region extracted from Figure 6b at 943, 993, 1043, and 1093 K. Each point is shifted slightly to lower δi, yet parallel to a phase boundary. One explanation for a shift toward lower δ compared to the boundary might be because the samples were not fully equilibrated. Thus, the surface where the reaction with CO2 takes place might be reduced to nonstoichiometries above the phase boundary, whereas some of the bulk remains below. We do not believe the hindered rates are due to carbonate formation because the mass balance between released O2 and produced CO is shown to be closed in this work and under similar reaction conditions in other works.4,5 Additionally, Li et al.34 showed with Fourier transform infrared spectroscopy that carbonates thermally desorb for T > 773 K. Furthermore, we saw no evidence of carbonate formation from unreasonable mass changes observed during oxidation.
Figure 7.
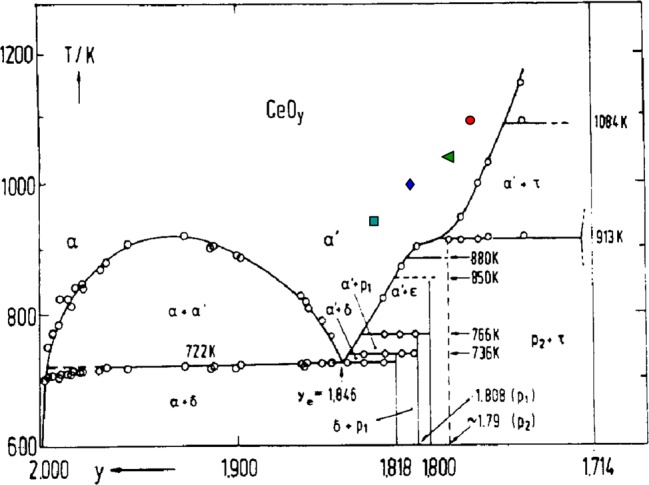
Phase diagram of pure CeO2 determined from specific heat measurements.32,33 Colored points represent initial nonstoichiometries of pellets where transition for drastic decrease in CO production rate is observed with TGA measurements (see Figure 6b).
Raman spectroscopy was employed to study the structural near-order oxygen anionic–cationic changes for the ceria pellets with respect to the oxygen nonstoichiometry. For this, we compare (i) a freshly sintered oxidized pellet, (ii) two chemically reduced pellets with different reduction durations at 1373 K using pH2 = 0.02 atm, and (iii) two thermally reduced samples with different reduction durations at 1773 K at low oxygen partial pressures as shown in Table 1. During cooling, chemically and thermally reduced samples were held under pure argon for 15 min at 993 and 1073 K, respectively. Chemical reduction at 1373 K for 120 min resulted in δi ≈ 0.253, which is clearly above the transition point of drastic decrease in CO production rate (see Figure 6b).
Table 1. Experimental Conditions and Initial Nonstoichiometries of Ceria Pellets for Performing Raman Spectroscopy of Surface.
| reduction methodology | none | chemical pH2 = 0.02 atm | chemical pH2 = 0.02 atm | thermal pO2 ≪ 1 atm | thermal pO2 ≪ 1 atm |
|---|---|---|---|---|---|
| Tred (K) | – | 1373 | 1373 | 1773 | 1773 |
| duration (min) | – | 0 | 120 | 5 | 180 |
| δi (−) | 0 | 0.128 | 0.253 | 0.034 | 0.057 |
For a given cubic fluorite crystal structure such as in undoped ceria, there is only a single characteristic cationic–anionic stretching vibration mode with Raman activity, namely, the F2g triply degenerated Raman mode, which is viewed as a symmetric breathing mode of the oxygen ions around each cerium cation in the lattice, see refs (35−37) for details. This breathing mode is sensitive to the “chemo-mechanic” property changes such as oxygen nonstoichiometry–bond strength changes, namely, the F2g mode shifts in wavenumber with respect to the nonstoichiometry of the material.38,39
Figure 8a shows the normalized Raman intensity as a function of wavelength for all samples. All spectra reveal a strong and single vibration mode around 465 cm–1. No additional bands were detected, clearly confirming the single-phase nature of the ceria independent of the oxygen nonstoichiometry over the range of δi = 0–0.253. This main vibration band is assigned to the symmetric oxygen anionic–cationic breathing Raman F2g mode and is in accordance with earlier literature references by McBride et al.,35 Weber et al.37, and Rupp et al.40 Extraction of the F2g peak position and full width at half-maximum as a function of δi was obtained through fitting data with a sixth-order polynomial function. Increasing the oxygen nonstoichiometry lowers the F2g Raman peak position by half a wavenumber from 465 cm–1 (δi ≈ 0) to 464.5 cm–1 (δi ≈ 0.253), Figure 8b. This trend is accompanied by a broadening of full width at half-maximum with increasing oxygen nonstoichiometry from Δω ≈ 7 to 9.5 cm–1 for δi ≈ 0 to 0.253, respectively, Figure 8c. Conventionally, one would expect that with increasing oxygen nonstoichiometry and lattice expansion of the ceria, the F2g signature peak would shift up to higher wavenumbers and peak width would broaden because of mixing of the band with second-order phonon scatter effects, see McBride et al. for details.35 In contrast, we report a lowering of the F2g mode in its wavenumber upon reduction of the ceria for the rather unusually high oxygen nonstoichiometries of 0.253. This reflects an active compression of the oxygen anion–cation near order and ceria lattice. In agreement with the ceria phase diagram,32 this is close to the phase transition regime of face-centered cubic cells with long-range defect–defect interactions (α′-phase) to intermediate rhombohedral cell structures (τ-phase).27,31 At this stage, the material may develop a phase instability that thermodynamically benefits an increased association energy of the reduced Ce3+ ions (CeCe′) with oxygen vacancies (Vo) to form dimer associates (CeCe′/Vo). Very recently, Marrocchelli et al.41 highlighted how changes in chemical expansion may significantly alter lattice bond strength by atomic scale simulations in the ceria system; for example, compressively straining the lattice can lead to shifts in the association energies and thereby result in oxygen anionic–cationic bond compression, in agreement with refs (38, and 42−44).
Figure 8.
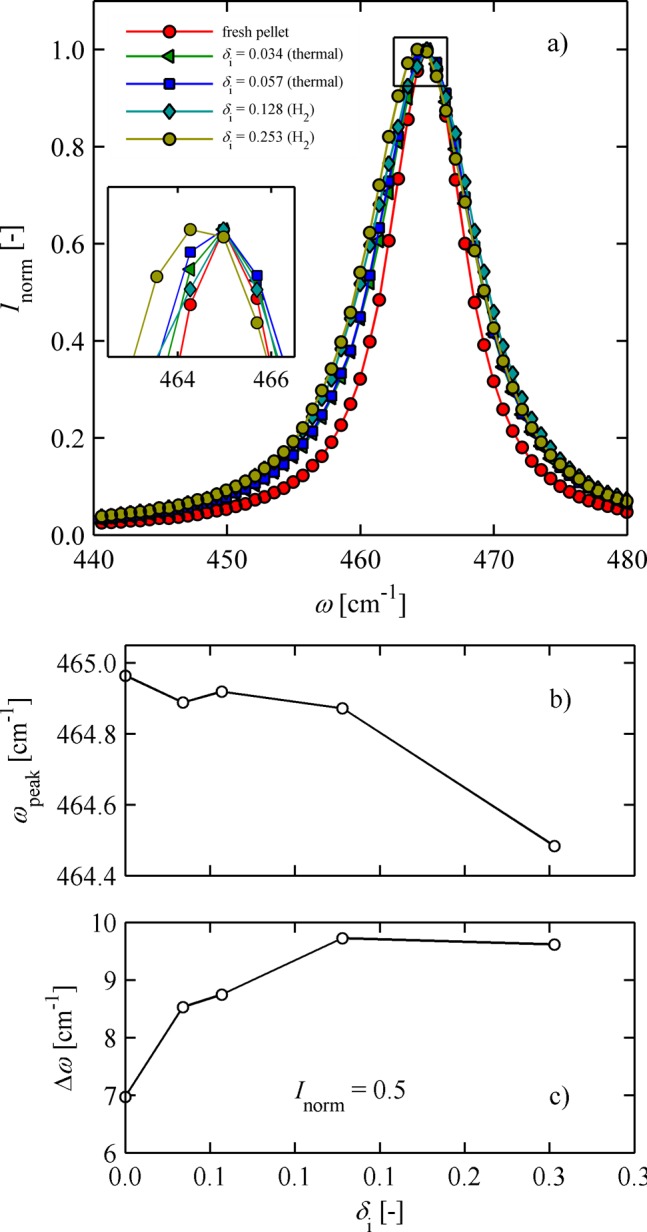
Raman spectroscopy of ceria pellet surface reduced to different δi: (a) single F2g peak at ω ≈ 465 cm–1; (b) decreasing peak wavelength position with increasing δi; (c) increasing full width at half-maximum intensity with increasing δi.
3.2.2. Thermal Reduction
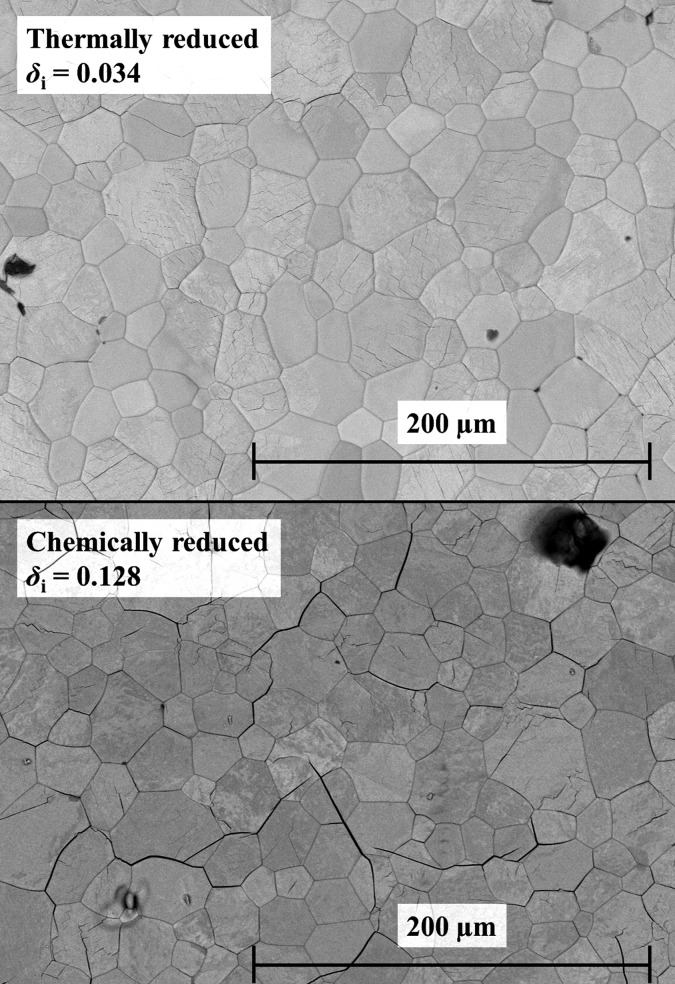
To study oxidation behavior following thermal reduction, sintered ceria pellets were thermally reduced at 1773 K and pO2 ≈ 2.5 × 10⁻⁴ atm for different reduction times.9 Compared to reduction with H2, oxidation rates are shown to be around 1 order of magnitude lower. These slower rates are attributed to the fact that fewer small cracks are induced. This can be seen in Figure 9 where we show SEM pictures of the surface of the thermally reduced pellet in the top panel (δi = 0.034) and the chemically reduced in the bottom panel (δi = 0.128). We were not able to measure the Brunauer–Emmett–Teller (BET) surface area without destroying their morphology and therefore could not quantify the change in BET surface area induced by cracks.
Figure 9.
SEM pictures of (top panel) grain surface of a ceria pellet thermally reduced to δi = 0.034 and (bottom panel) grain surface of a ceria pellet chemically reduced to δi = 0.128.
Figure 10a shows rCO in log space at δeval = 0.02 as a function of inverse temperature for 973 ≤ T ≤ 1273 K for CO2 concentrations ranging from 0.1 to 0.4 atm. Increasing rates are observed with increasing CO2 concentration, whereas a clear turnover of rCO with increasing temperature is observed for all CO2 concentrations. Similar behavior was observed after chemical reduction at these elevated temperatures, and is likely due to a shift in the chemical equilibrium.5 Increasing CO2 concentrations shift the transition to higher temperatures because higher CO2 concentrations favor the forward reaction.
Figure 10.
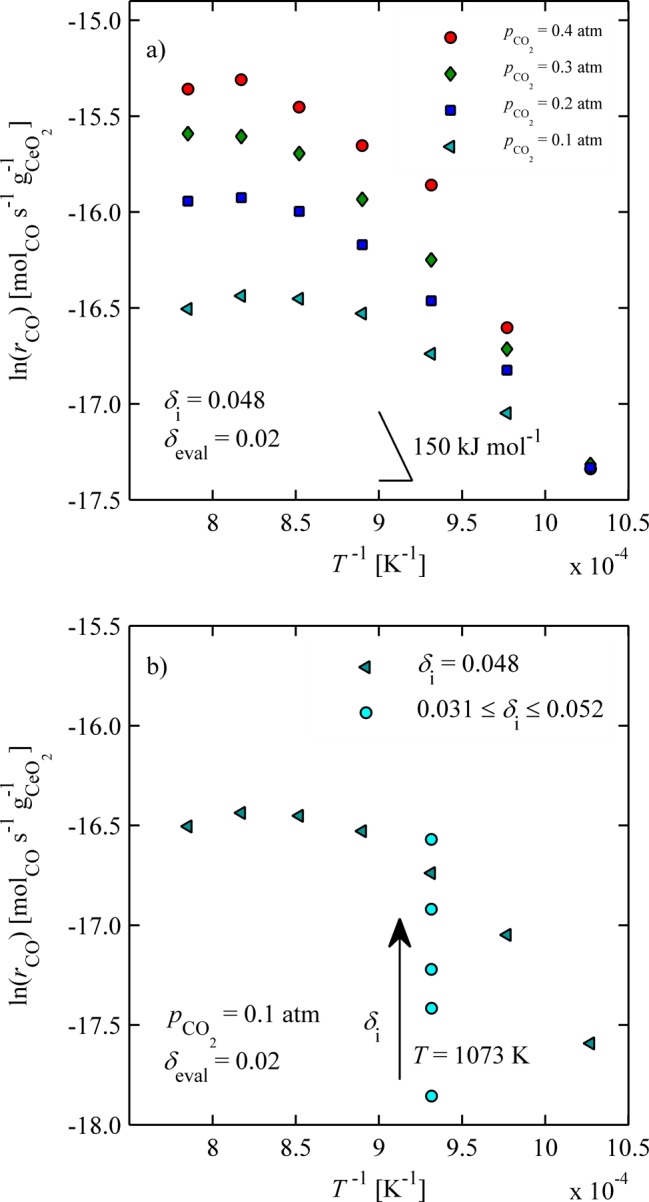
(a) CO production rates at δeval = 0.02 for 973 ≤ T ≤ 1273 K and 0.1 ≤ pCO2 ≤ 0.4 atm concentrations for δi = 0.048; (b) increasing CO production rate with increasing δi at T = 1073 K and pCO2 = 0.1 atm.
Oxidation rates were also strongly dependent on the initial nonstoichiometry and increased with δi over the range of nonstoichiometries probed (δi < 0.06). This is shown in Figure 10b, in which the oxidation rates are shown at T = 1073 K for initial nonstoichiometries increasing from 0.031 to 0.052. For reference, the rate versus inverse temperature is also shown for a single δi, extracted from Figure 10a. During chemical reduction in this reduction range, there was no observable effect on oxidation rates. The rates were affected only at higher δ, but in a contrasting way, that is, rates increased with increasing initial nonstoichiometry.
lnrCO increases almost linearly with δi for a range of operating conditions, as shown in Figure 11. Here, rCO is shown in log space as a function of δi for δeval = 0.02, pCO2 = 0.1 and 0.2 atm, and T = 1123 and 1173 K. Rates at δi ≈ 0.055 are almost twice as large as rates at δi ≈ 0.035. On the basis of the Raman results and phase diagram discussed above, this behavior is probably not due to near-order phase changes. One possible explanation is an increase in charge-driven defect interactions caused by increasing electron and vacancy concentrations. This would necessarily affect the dominant transport processes occurring in the lattice. In an effort to test this hypothesis, similar experiments were performed with a 10 mol % Gd doped ceria pellet that is expected to have less defect interactions under the conditions investigated.10,45−47 In fact, for Ce0.9Gd0.1O1.95−δ an ideal solution model accounting only for doubly ionized oxygen vacancies and localized electrons on the cerium lattice sites has been shown to be valid above 1073 K for δ < 0.04.46 In the case of pure ceria, such a model is not applicable except in the case of very low nonstoichiometries (δ < 0.01).9,12,48 Results are also shown in Figure 11, and in this case oxidation rates are mostly constant for δi < 0.04. Initial nonstoichiometries greater than δi = 0.04 were not possible in this system because of limitations in the operating temperature and baseline oxygen level.
Figure 11.
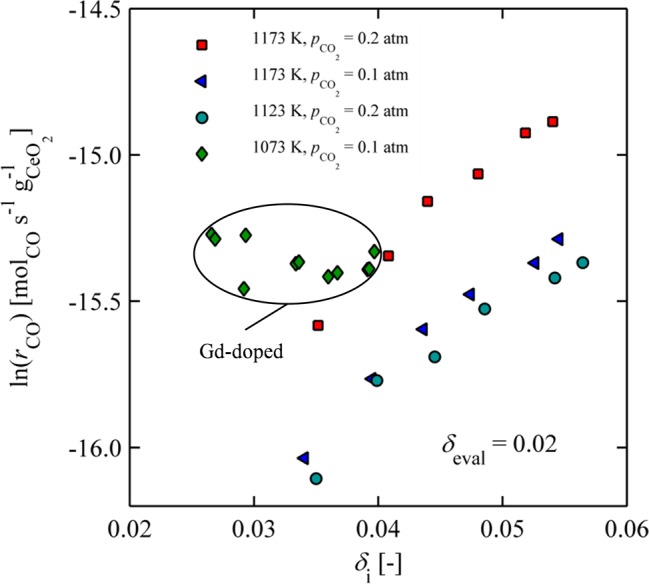
CO production rates as a function of increasing initial nonstoichiometry for different temperatures and CO2 concentrations for ceria and 10 mol % Gd doped ceria.
Another possible explanation for increased rates with nonstoichiometry may be related to the increase in chemical expansion with increasing δi.11,41,49−51 Prior to reduction, the grain sizes within the pure ceria pellet are larger (20–50 μm) compared to the grain sizes of 10 mol % Gd doped ceria (3–10 μm), and no cracks are visible (Figure 12a,c). However, following reduction, cracks are formed within pure ceria grains (Figure 12b) which probably lead to an increased surface area. No such small intragrain cracks can be observed on grain surface of the reduced 10 mol % Gd doped ceria pellet, as shown in Figure 12d, probably because the small grains can accommodate chemical expansion more easily than larger grains. However, there is noticeable crack propagation across grains. Unfortunately, because the same degree of crack propagation does not occur in Gd-doped ceria as in pure ceria, it is not possible to point toward a likely explanation for increasing oxidation rates with nonstoichiometry. Therefore, we can only hypothesize that it is due to either increasing defect interactions or increasing surface area caused by chemical expansion.
Figure 12.
SEM images: (a) grain surface of a stoichiometric pure ceria pellet; (b) grain surface of pure ceria pellet reduced to δi = 0.034; (c) grain surface of a stoichiometric 10 mol % Gd doped ceria pellet; and (d) grain surface of a stoichiometric 10 mol % Gd doped ceria pellet reduced to δi = 0.03.
4. Conclusion
It is shown that ceria oxidation rates are not only dependent on temperature and CO2 concentration but also strongly dependent on reduction extent and surface morphology of the sample. For sintered ceria pellets reduced with H2 to extreme nonstoichiometries (δ > 0.2), a transition toward very slow oxidation rates is observed. Specifically, as nonstoichiometry increased, the oxidation rate for a fixed oxygen concentration (constant δ) decreased. The nonstoichiometry where the transition occurs slightly increases with temperature and agrees well with a near-order phase change reported in literature. Results are further supported with Raman spectroscopy results that indicate an active compression of the oxygen anion–cation near order and ceria lattice in this region. For nonstoichiometries <0.06, achieved during higher-temperature thermal reduction with low oxygen partial pressure, the opposite behavior is observed, and oxidation rates increase almost linearly with increasing nonstoichiometry for pure ceria. We attribute this trend to one of two phenomena: (1) the formation of defect clusters that affect bulk transport, primarily because such behavior is not observed for 10 mol % Gd doped ceria where defect interactions are known to be less prevalent or (2) slight changes in morphology due to chemical expansion. While these results shed new light on oxidation rates of ceria under a broad range of operating conditions, further work is required to obtain more quantitative information about the rates and their relationship to nonstoichiometry so that they may ultimately be applied in system models to improve overall performance. For example, it will be important to decouple intrinsic reaction rates from any changes in subtle morphology during reduction (i.e., expansion, crack propagation). Already, extensive data exists describing the chemical and thermal expansion behavior of these materials,41,49,50,52,53 but it will also be important to quantify how cracks propagate as a function of grain size and nonstoichiometry.
Acknowledgments
We gratefully acknowledge the financial support by the Swiss Competence Center Energy & Mobility, the Helmholtz–Gemeinschaft Deutscher Forschungszentren (Virtuelles Institut SolarSyngas), and the European Research Council under the European Union’s ERC Advanced Grant (SUNFUELS–No. 320541).
Glossary
Nomenclature
- CCO2
CO2 concentration (mol m–3)
- EA
Activation energy of reaction (J mol–1)
- f(δ)
Reaction mechanism (−)
- Inorm
Normalized Raman intensity (−)
- k(T)
Reaction rate constant (s–1)
- mCeO2
Reactive sample mass (mg)
- ms
Total sample mass (mg)
- MCeO2
Molar mass of ceria (g mol–1)
- MO
Molar mass of oxygen (g mol–1)
- n
Reaction order (−)
- pCO2
CO2 partial pressure (atm)
- rCO
Rate of production of gaseous CO (molCO s–1 gCeO2–1)
- Rgas
Universal gas constant, 8.314 (J mol–1 K–1)
- T
Temperature (K)
- Tred
Reduction temperature (K)
- δ
Oxygen nonstoichiometry (−)
- δeval
Oxygen nonstoichiometry at which rates are evaluated (−)
- δi
Initial oxidation nonstoichiometry (−)
- Δm
Mass change of sample (mg)
- Δω
Full wavenumber width at half-maximum intensity (cm–1)
- ω
Wave number (cm–1)
- ωpeak
Wave number of maximum peak intensity (cm–1)
The authors declare no competing financial interest.
This paper was published ASAP on July 9, 2015. The Figures have been updated and the revised version was re-posted on July 13, 2015.
References
- Abanades S.; Flamant G. Thermochemical Hydrogen Production From a Two-step Solar-Driven Water-Splitting Cycle Based on Cerium Oxides. Sol. Energy 2006, 80, 1611–1623 10.1016/j.solener.2005.12.005. [DOI] [Google Scholar]
- Bader R.; Venstrom L. J.; Davidson J. H.; Lipiński W. Thermodynamic Analysis of Isothermal Redox Cycling of Ceria for Solar Fuel Production. Energy Fuels 2013, 27, 5533–5544 10.1021/ef400132d. [DOI] [Google Scholar]
- Chueh W. C.; Falter C.; Abbott M.; Scipio D.; Furler P.; Haile S. M.; Steinfeld A. High-Flux Solar-Driven Thermochemical Dissociation of CO2 and H2O Using Nonstoichiometric Ceria. Science 2010, 330, 1797–1801 10.1126/science.1197834. [DOI] [PubMed] [Google Scholar]
- Furler P.; Scheffe J.; Gorbar M.; Moes L.; Vogt U.; Steinfeld A. Solar Thermochemical CO2 Splitting Utilizing a Reticulated Porous Ceria Redox System. Energy Fuels 2012, 26, 7051–7059 10.1021/ef3013757. [DOI] [Google Scholar]
- Furler P.; Scheffe J.; Marxer D.; Gorbar M.; Bonk A.; Vogt U.; Steinfeld A. Thermochemical CO2 Splitting via Redox Cycling of Ceria Reticulated Foam Structures With Dual-Scale Porosities. Phys. Chem. Chem. Phys. 2014, 16, 10503–10511 10.1039/c4cp01172d. [DOI] [PubMed] [Google Scholar]
- Miller J. E.; McDaniel A. H.; Allendorf M. D. Considerations in the Design of Materials for Solar-Driven Fuel Production Using Metal-Oxide Thermochemical Cycles. Adv. Energy Mater. 2014, 4, 1300469. 10.1002/aenm.201300469. [DOI] [Google Scholar]
- Meng Q.-L.; Lee C.-i.; Ishihara T.; Kaneko H.; Tamaura Y. Reactivity of CeO2-Based Ceramics for Solar Hydrogen Production via a Two-Step Water-Splitting Cycle With Concentrated Solar Energy. Int. J. Hydrogen Energy 2011, 36, 13435–13441 10.1016/j.ijhydene.2011.07.089. [DOI] [Google Scholar]
- Smestad G. P.; Steinfeld A. Review: Photochemical and Thermochemical Production of Solar Fuels From H2O and CO2 Using Metal Oxide Catalysts. Ind. Eng. Chem. Res. 2012, 51, 11828–11840 10.1021/ie3007962. [DOI] [Google Scholar]
- Panlener R. J.; Blumenthal R. N.; Garnier J. E. A Thermodynamic Study of Nonstoichiometric Cerium Dioxide. J. Phys. Chem. Solids 1975, 36, 1213–1222 10.1016/0022-3697(75)90192-4. [DOI] [Google Scholar]
- Scheffe J. R.; Steinfeld A. Thermodynamic Analysis of Cerium-Based Oxides for Solar Thermochemical Fuel Production. Energy Fuels 2012, 26, 1928–1936 10.1021/ef201875v. [DOI] [Google Scholar]
- Mogensen M.; Sammes N. M.; Tompsett G. A. Physical, Chemical and Electrochemical Properties of Pure and Doped Ceria. Solid State Ionics 2000, 129, 63–94 10.1016/S0167-2738(99)00318-5. [DOI] [Google Scholar]
- Chueh W. C.; Haile S. M. A Thermochemical Study of Ceria: Exploiting an Old Material for New Modes of Energy Conversion and CO2 Mitigation. Philos. Trans. R. Soc., A 2010, 368, 3269–3294 10.1098/rsta.2010.0114. [DOI] [PubMed] [Google Scholar]
- Gopal C. B.; Haile S. M. An Electrical Conductivity Relaxation Study of Oxygen Transport in Samarium Doped Ceria. J. Mater. Chem. A 2014, 2, 2405–2417 10.1039/C3TA13404K. [DOI] [Google Scholar]
- Chueh W. C.; Haile S. M. Ceria as a Thermochemical Reaction Medium for Selectively Generating Syngas or Methane From H2O and CO2. ChemSusChem 2009, 2, 735–739 10.1002/cssc.200900138. [DOI] [PubMed] [Google Scholar]
- Omar S.; Wachsman E. D.; Jones J. L.; Nino J. C. Crystal Structure–Ionic Conductivity Relationships in Doped Ceria Systems. J. Am. Ceram. Soc. 2009, 92, 2674–2681 10.1111/j.1551-2916.2009.03273.x. [DOI] [Google Scholar]
- Teocoli F.; Esposito V. Viscoelastic Properties of Doped-Ceria Under Reduced Oxygen Partial Pressure. Scr. Mater. 2014, 75, 82–85 10.1016/j.scriptamat.2013.11.027. [DOI] [Google Scholar]
- Haxel G.; Hedrick J.; Orris G.. Rare Earth Elements—Critical Resources for High Technology: Reston. USGS Fact Sheet 087-02, 2002.
- Abanades S.; Legal A.; Cordier A.; Peraudeau G.; Flamant G.; Julbe A. Investigation of Reactive Cerium-Based Oxides for H2 Production by Thermochemical Two-Step Water-Splitting. J. Mater. Sci. 2010, 45, 4163–4173 10.1007/s10853-010-4506-4. [DOI] [Google Scholar]
- Le Gal A.; Abanades S.; Flamant G. CO2 and H2O Splitting for Thermochemical Production of Solar Fuels Using Nonstoichiometric Ceria and Ceria/Zirconia Solid Solutions. Energy Fuels 2011, 25, 4836–4845 10.1021/ef200972r. [DOI] [Google Scholar]
- Hao Y.; Yang C.-K.; Haile S. M. Ceria–Zirconia Solid Solutions (Ce1–xZrxO2−δ, x ≤ 0.2) for Solar Thermochemical Water Splitting: A Thermodynamic Study. Chem. Mater. 2014, 26, 6073–6082 10.1021/cm503131p. [DOI] [Google Scholar]
- Graves C.; Ebbesen S. D.; Mogensen M.; Lackner K. S. Sustainable Hydrocarbon Fuels by Recycling CO2 and H2O With Renewable or Nuclear Energy. Renewable Sustainable Energy Rev. 2011, 15, 1–23 10.1016/j.rser.2010.07.014. [DOI] [Google Scholar]
- Knoblauch N.; Dörrer L.; Fielitz P.; Schmuecker M.; Borchardt G. Surface Controlled Reduction Kinetics of Nominally Undoped Polycrystalline CeO2. Phys. Chem. Chem. Phys. 2015, 17, 5849–5860 10.1039/C4CP05742B. [DOI] [PubMed] [Google Scholar]
- Ackermann S.; Scheffe J. R.; Steinfeld A. Diffusion of Oxygen in Ceria at Elevated Temperatures and Its Application to H2O/CO2 Splitting Thermochemical Redox Cycles. J. Phys. Chem. C 2014, 118, 5216–5225 10.1021/jp500755t. [DOI] [Google Scholar]
- Petkovich N. D.; Rudisill S. G.; Venstrom L. J.; Boman D. B.; Davidson J. H.; Stein A. Control of Heterogeneity in Nanostructured Ce1–xZrxO2 Binary Oxides for Enhanced Thermal Stability and Water Splitting Activity. J. Phys. Chem. C 2011, 115, 21022–21033 10.1021/jp2071315. [DOI] [Google Scholar]
- Venstrom L. J.; Petkovich N.; Rudisill S.; Stein A.; Davidson J. H. The Effects of Morphology on the Oxidation of Ceria by Water and Carbon Dioxide. J. Sol. Energy Eng. 2012, 134, 011005. 10.1115/1.4005119. [DOI] [Google Scholar]
- Sørensen O. T. Thermogravimetric Studies of Non-stoichiometric Cerium Oxides Under Isothermal and Quasi-isothermal Conditions. J. Therm. Anal. 1978, 13, 429–437 10.1007/BF01912383. [DOI] [Google Scholar]
- Sørensen O. T. Thermodynamic Studies of the Phase Relationships of Nonstoichiometric Cerium Oxides at Higher Temperatures. J. Solid State Chem. 1976, 18, 217–233 10.1016/0022-4596(76)90099-2. [DOI] [Google Scholar]
- Levenspiel O.Chemical Reaction Engineering, 3rd ed.; Wiley: New York, 1999. [Google Scholar]
- Bernardo C. A.; Trimm D. L. The Kinetics of Gasification of Carbon Deposited on Nickel Catalysts. Carbon 1979, 17, 115–120 10.1016/0008-6223(79)90017-4. [DOI] [Google Scholar]
- Chorkendorff I.; Niemantsverdriet J. W.. Concepts of Modern Catalysis and Kinetics; Wiley-VCH: Weinheim, Germany, 2003. [Google Scholar]
- Bevan D. J. M.; Kordis J. Mixed Oxides of the Type MO2 (Fluorite)-M2O3—I Oxygen Dissociation Pressures and Phase Relationships in the System CeO2-Ce2O3 at High Temperatures. J. Inorg. Nucl. Chem. 1964, 26, 1509–1523 10.1016/0022-1902(64)80038-5. [DOI] [Google Scholar]
- Körner R.; Ricken M.; Nölting J.; Riess I. Phase Transformations in Reduced Ceria: Determination by Thermal Expansion Measurements. J. Solid State Chem. 1989, 78, 136–147 10.1016/0022-4596(89)90137-0. [DOI] [Google Scholar]
- Ricken M.; Nölting J.; Riess I. Specific Heat and Phase Diagram of Nonstoichiometric Ceria (CeO2–x). J. Solid State Chem. 1984, 54, 89–99 10.1016/0022-4596(84)90135-X. [DOI] [Google Scholar]
- Li C.; Sakata Y.; Arai T.; Domen K.; Maruya K.-i.; Onishi T. Carbon Monoxide and Carbon Dioxide Adsorption on Cerium Oxide Studied by Fourier-transform Infrared Spectroscopy. Part 1.—Formation of Carbonate Species on Dehydroxylated CeO2, at Room Temperature. J. Chem. Soc., Faraday Trans. 1 1989, 85, 929–943 10.1039/f19898500929. [DOI] [Google Scholar]
- McBride J. R.; Hass K. C.; Poindexter B. D.; Weber W. H. Raman and X-Ray Studies of Ce1–xRExO2–y, Where RE=La, Pr, Nd, Eu, Gd, and Tb. J. Appl. Phys. 1994, 76, 2435–2441 10.1063/1.357593. [DOI] [Google Scholar]
- Schweiger S.; Kubicek M.; Messerschmitt F.; Murer C.; Rupp J. L. M. A Micro-Dot Multilayer Oxide Device: Let’s Tune the Strain-Ionic Transport Interaction. ACS Nano 2014, 8, 5032–5048 10.1021/nn501128y. [DOI] [PubMed] [Google Scholar]
- Weber W.; Hass K.; McBride J. Raman Study of CeO2: Second-Order Scattering, Lattice Dynamics, and Particle-Size Effects. Phys. Rev. B: Condens. Matter Mater. Phys. 1993, 48, 178–185 10.1103/PhysRevB.48.178. [DOI] [PubMed] [Google Scholar]
- Rupp J. L. M.; Fabbri E.; Marrocchelli D.; Han J.-W.; Chen D.; Traversa E.; Tuller H. L.; Yildiz B. Scalable Oxygen-Ion Transport Kinetics in Metal-oxide Films: Impact of Thermally Induced Lattice Compaction in Acceptor Doped Ceria Films. Adv. Funct. Mater. 2014, 24, 1562–1574 10.1002/adfm.201302117. [DOI] [Google Scholar]
- Shi Y.; Bork A. H.; Schweiger S.; Rupp J. L. M. The Effect of Mechanical Twisting on Oxygen Ionic Transport in Solid-State Energy Conversion Membranes. Nat. Mater. 2015, 14, 721. 10.1038/nmat4278. [DOI] [PubMed] [Google Scholar]
- Rupp J. L. M.; Scherrer B.; Gauckler L. J. Engineering Disorder in Precipitation-Based Nano-Scaled Metal Oxide Thin Films. Phys. Chem. Chem. Phys. 2010, 12, 11114–11124 10.1039/b920971a. [DOI] [PubMed] [Google Scholar]
- Marrocchelli D.; Bishop S. R.; Tuller H. L.; Yildiz B. Understanding Chemical Expansion in Non-Stoichiometric Oxides: Ceria and Zirconia Case Studies. Adv. Funct. Mater. 2012, 22, 1958–1965 10.1002/adfm.201102648. [DOI] [Google Scholar]
- Hull S.; Norberg S. T.; Ahmed I.; Eriksson S. G.; Marrocchelli D.; Madden P. A. Oxygen Vacancy Ordering Within Anion-Deficient Ceria. J. Solid State Chem. 2009, 182, 2815–2821 10.1016/j.jssc.2009.07.044. [DOI] [Google Scholar]
- Kuru Y.; Bishop S. R.; Kim J. J.; Yildiz B.; Tuller H. L. Chemomechanical Properties and Microstructural Stability of Nanocrystalline Pr-Doped Ceria: An In-Situ X-Ray Diffraction Investigation. Solid State Ionics 2011, 193, 1–4 10.1016/j.ssi.2011.04.012. [DOI] [Google Scholar]
- Yildiz B. Stretching” the Energy Landscape of Oxides—Effects on Electrocatalysis and Diffusion. MRS Bull. 2014, 39, 147–156 10.1557/mrs.2014.8. [DOI] [Google Scholar]
- Kobayashi T.; Wang S.; Dokiya M.; Tagawa H.; Hashimoto T. Oxygen Nonstoichiometry of Ce1-ySmyO2–0.5y-x (y=0.1, 0.2). Solid State Ionics 1999, 126, 349–357 10.1016/S0167-2738(99)00259-3. [DOI] [Google Scholar]
- Wang S.; Inaba H.; Tagawa H.; Dokiya M.; Hashimoto T. Nonstoichiometry of Ce0.9Gd0.1O1.95–x. Solid State Ionics 1998, 107, 73–79 10.1016/S0167-2738(97)00519-5. [DOI] [Google Scholar]
- Wang S.; Inaba H.; Tagawa H.; Hashimoto T. Nonstoichiometry of Ce0.8Gd0.2O1.9–x. J. Electrochem. Soc. 1997, 144, 4076–4080 10.1149/1.1838139. [DOI] [Google Scholar]
- Duncan K. L.; Wang Y.; Bishop S. R.; Ebrahimi F.; Wachsman E. D. The Role of Point Defects in the Physical Properties of Nonstoichiometric Ceria. J. Appl. Phys. 2007, 101, 044906. 10.1063/1.2559601. [DOI] [Google Scholar]
- Bishop S. R.; Duncan K. L.; Wachsman E. D. Defect Equilibria and Chemical Expansion in Non-Stoichiometric Undoped and Gadolinium-Doped Cerium Oxide. Electrochim. Acta 2009, 54, 1436–1443 10.1016/j.electacta.2008.09.026. [DOI] [Google Scholar]
- Chiang H.-W.; Blumenthal R. N.; Fournelle R. A. A High Temperature Lattice Parameter and Dilatometer Study of the Defect Structure of Nonstoichiometric Cerium Dioxide. Solid State Ionics 1993, 66, 85–95 10.1016/0167-2738(93)90031-W. [DOI] [Google Scholar]
- Brauer G.; Gingerich K. A.; Holtschmidt U. Über die Oxyde des Cers—IV: Die Sauerstoffzersetzungdrucke im System der Ceroxyde. J. Inorg. Nucl. Chem. 1960, 16, 77–86 10.1016/0022-1902(60)80090-5. [DOI] [Google Scholar]
- Bishop S.; Marrocchelli D.; Chatzichristodoulou C.; Perry N.; Mogensen M. B.; Tuller H.; Wachsman E. Chemical Expansion: Implications for Electrochemical Energy Storage and Conversion Devices. Annu. Rev. Mater. Res. 2014, 44, 205–239 10.1146/annurev-matsci-070813-113329. [DOI] [Google Scholar]
- Esposito V.; Ni D. W.; He Z.; Zhang W.; Prasad A. S.; Glasscock J. A.; Chatzichristodoulou C.; Ramousse S.; Kaiser A. Enhanced Mass Diffusion Phenomena in Highly Defective Doped Ceria. Acta Mater. 2013, 61, 6290–6300 10.1016/j.actamat.2013.07.012. [DOI] [Google Scholar]


