

Abstract
BACKGROUND
Accumulating evidence suggests that chronic prostatic inflammation may lead to prostate cancer development. Growth differentiation factor-15 (GDF-15) is highly expressed in the prostate and has been associated with inflammation and tumorigenesis.
METHODS
To examine the relationship between GDF-15 and prostatic inflammation, GDF-15 expression was measured by immunohistochemical (IHC) staining in human prostatectomy specimens containing inflammation. The relationship between GDF-15 and specific inflammatory cells was determined using non-biased computer image analysis. To provide insight into a potential suppressive role for GDF-15 in inflammation, activation of inflammatory mediator nuclear factor of kappa B (NFκB) was measured in PC3 cells.
RESULTS
GDF-15 expression in luminal epithelial cells was decreased with increasing inflammation severity, suggesting an inverse association between GDF-15 and inflammation. Quantification of IHC staining by image analysis for GDF-15 and inflammatory cell markers revealed an inverse correlation between GDF-15 and CD3+, CD4+, CD8+, CD68+, and inos+ leukocytes. GDF-15 suppressed NFκB activity in luciferase reporter assays. Expression of the NFκB target, interleukin 8 (IL-8), was downregulated by GDF-15.
CONCLUSIONS
The inverse relationship between GDF-15 and inflammation demonstrates a novel expression pattern for GDF-15 in the human prostate and suppression of NFκB activity may shed light on a potential mechanism for this inverse correlation.
Keywords: GDF-15, inflammation, macrophage, NFκB
INTRODUCTION
Prostate cancer is the most common non-skin cancer in men and is responsible for close to 30,000 deaths annually in the United States [1]. Increasing evidence suggests that prostatic inflammation is a contributing factor in prostate tumorigenesis [2,3]. Prostate tumors are often found to contain inflammatory cells and men taking non-steroidal anti-inflammatory drugs (NSAIDs) long-term have been reported to have a reduced incidence of prostate cancer [4,5]. Pathologic studies show that the majority of men in the United States over 50 years of age harbor chronic prostatic inflammation [6]. Chronic inflammation in the form of lymphocytes and histiocytes has been associated with benign prostatic hyperplasia (BPH) and prostatic atrophic lesions.
A large number of factors are present in the inflammatory milieu that may provide a link between inflammation and cancer. Potential pro-tumorigenic factors found during inflammation include secreted growth factors, cytokines/chemokines, anti-apoptotic signaling proteins, and pro-angiogenic regulators [7]. A molecule implicated as an orchestrating factor linking inflammation and tumorigenesis is nuclear factor of kappa B (NFκB), a sequence-specific transcription factor known to activate transcription of pro-inflammatory genes including interleukins, cyclooxygenases, and nitric oxide synthase [8]. In addition to its role in inflammation, NFκB regulates genes involved in cell proliferation, apoptosis, migration, and angiogenesis [9]. NFκB is constitutively active in many cancer cell lines and constitutive NFκB activity has been observed in many tumors including prostate cancer [10,11]. NFκB activity was increased in the prostate of mice that were fed a high fat diet [12], providing a potential link between diet and prostatic inflammation.
Growth differentiation factor-15 (GDF-15) is a divergent member of the transforming growth factor-β (TGFβ) and bone morphogenetic protein (BMP) family of secreted cytokines. GDF-15 was first identified in a screen for genes involved in macrophage activation and is also known as macrophage inhibitory cytokine-1 (MIC-1) [13]. GDF-15 was identified as a gene induced by NSAIDs in colorectal cells, called NSAID-activated gene-1 (NAG-1), providing a potential role for GDF-15 as an anti-inflammatory signaling molecule [14]. NSAID-mediated inhibition of prostate cancer cell migration requires induction of GDF-15 expression, suggesting that GDF-15 may play an anti-tumorigenic role in the prostate [15]. GDF-15 is highly induced by vitamin D and plays an anti-tumorigenic role downstream of vitamin D in prostate cancer cells [16]. Examination of prostatectomy specimens using immunohistochemistry (IHC) for full-length GDF-15 showed no clear association between relative GDF-15 expression and prostate cancer or cancer grade (unpublished data). However, pathological analysis revealed an inverse association between GDF-15 expression and prostatic inflammation.
Previously, a role for GDF-15 in human prostatic inflammatory diseases has not been determined. Here, we report a significant inverse correlation between GDF-15 and prostatic inflammation using human prostatectomy specimens. Non-biased computer image quantification revealed an inverse relationship between GDF-15 expression and CD3+, CD4+, CD8+, CD68+, and inos+ leukocytes. To determine a potential mechanism for this relationship, we determined that GDF-15 suppresses transcriptional activity of the inflammatory mediator, NFκB. GDF-15 suppressed expression of interleukin 8 (IL-8), an NFκB target gene. Suppression of NFκB may provide a novel mechanism for the anti-inflammatory role of GDF-15 in the prostate.
MATERIALS AND METHODS
Prostatectomy Specimen Collection and Processing
From 1984 to 2013 inclusive, 3,123 surgical prostatectomy specimens were processed using a whole-mount technique at the University of Colorado Hospital Department of Pathology. Sixty prostates from this collection were selected at random for scoring for GDF-15. The prostates contained foci of prostatic carcinoma ranging in Gleason scores from 5 to 9. However, only benign areas including normal acini or inflammatory atrophic lesions were included for analysis in this study.
Whole prostatectomy specimens were fixed in 10% neutral buffered formalin, serially sectioned into 4 mm thick blocks, and embedded for whole-mount section preparation. Five micron sections were cut using a microtome and mounted onto positively charged glass slides. Hematoxylin and eosin (H&E) staining was performed using standard methods. Briefly, sections were deparaffinized with xylene, rinsed through graded alcohols and hydrated to water. The nuclei were stained for 5 min in Harris hematoxylin (Anatech), differentiated in acid alcohol (1% HCl in 70% alcohol by volume) and 1% ammonium hydroxide. The nonnuclear elements were stained with alcoholic eosin (Anatech) for three dips and dehydrated through graded alcohols to xylene. The sections were covered with cover slips using Cytoseal 60 synthetic resin (Thermo Fisher).
Immunohistochemistry
For each prostate, the paraffin block of a single whole-mount section from the mid-portion of the gland was chosen for IHC staining for GDF-15. From each block, fresh microtome cut paraffin sections (5 μm) were mounted on large format slides from Brain Research Labs and baked for a minimum of 1 hr at 60°C. The slides were deparaffinized in xylene, rinsed in graded alcohols and hydrated in water. Antigen retrieval was performed in the Decloaking Chamber pressure cooker (Biocare Medical) at 125°C (22 psi). Two types of epitope retrieval solutions were used to reveal the antigens, called DIVA (Biocare, pH 6–7) and BORG (Biocare, pH 9.5). Modest retrieval was utilized for CD3 and CD8 antigens in DIVA for 4 and 5 min, respectively, while CD68 and GDF-15 performed best at medium retrieval in BORG for 5 min. Only CD4 required extended retrieval in BORG for 10 min. The following antibodies were diluted in 10 mM Tris buffered saline serum +0.05% Tween bovine albumin (pH 7.4): CD3 +1% (DAKO Cytomation; cat# A-0452; rabbit polyclonal; 1:500), CD4 (Cell Marque; cat# 104R-15; rabbit monoclonal SP35, 1:25), CD8 (Biocare; cat# CM153A; mouse monoclonal BC/1F6; 1:50), CD68 (DAKO Cytomation; cat# M-0814; mouse monoclonal KP1; 1:4,000), arginase (Santa Cruz; cat# SC-18351; goat polyclonal), inos (Abcam; cat# Ab-15323; rabbit polyclonal) and GDF-15 (R&D Systems; cat# AF957; goat polyclonal; 1:100). The sections were rinsed thoroughly in TBST and endogenous peroxidases were blocked with 3% hydrogen peroxide (aq.) for 10 min. All detection steps were performed at room temperature using a humidity chamber. Primary antibodies were diluted and 400 μl was incubated on each slide for 1 hr. Biotinylated secondary antibodies from Jackson ImmunoResearch raised against mouse (goat anti-mouse; cat# 115-065-068; 1:400), rabbit (goat anti-rabbit; cat# 111-065-144; 1:400) and goat (rabbit anti-goat; cat# 305-065-045; 1:400) were all sourced from Jackson ImmunoRe-search, diluted in TBST and incubated for 30 min. Secondary antibodies were detected with streptavidin–horseradish peroxidase (Vector Laboratories; cat# SA-5004; 1:200) diluted in TBST and incubated for 30 min. Visualization of antibody complexes was accomplished with 3,3′ diaminobenzidine (Biocare; cat# DBC859L10) for 5 min. All slides were rinsed thoroughly in deionized water, counterstained in Mayer’s hematoxylin for 2 min, nuclei blued in 1% ammonium hydroxide (aq.), dehydrated in graded alcohols, cleared in xylene and cover glass was mounted with synthetic resin.
Assessment of GDF-15 Expression and Inflammation
GDF-15 expression and inflammation severity were visualized in human prostatectomy specimens by IHC and H&E staining, respectively. GDF-15 expression and inflammation severity were examined by four independent pathologists using 60 prostatectomy specimens. For each GDF-15-stained slide, 3–5 random fields of benign prostate were isolated by dotting with a felt pen by a technician not involved with scoring. The isolated fields were also traced on the corresponding H&E-stained slide. GDF-15 score was produced by IHC staining intensity (0 = no staining, 1 low, 2 = medium, 3 = high) and percent of cells staining positive (0 = no staining, 1 = 0–33% positive, 2 34–66% positive, 3 = 67–100% positive). Inflammation score was obtained as the average of four pathologists’ assessment of inflammation severity (0 = no inflammation, 1 = low inflammation, 2 = moderate inflammation, 3 = severe inflammation) as assessed on the H&E slide independent from and without comparison to the GDF-15-stained slide. The sum of GDF-15 scores were placed into each inflammation score category and averaged. Students t-test was used to calculate P-values comparing GDF-15 score in each inflammation score category.
Computer Image Analysis
To confirm the preliminary studies of inflammation and GDF-15, a non-biased image analysis approach was utilized. IHC staining of whole-mount sections from human prostatectomy specimens were stained for GDF-15 and inflammatory cell markers (CD3, CD4, CD8, and CD68) as described above. Staining intensity for each marker was quantified using computer image analysis software as follows. Serial sections were immunostained and entire sections were scanned using a ScanScope XT (Aperio Technologies) at a digital resolution of 0.50 μm/pixel. Serial sections from each case were examined using the Aperio ImageScope software. Specific sub-regions of normal and inflammatory atrophic lesions within the scanned images, across all inflammatory markers, were selected and exported. Forty random fields from 10 individual prostates were analyzed. Glandular luminal spaces within the exported regions were manually identified using Adobe Photoshop CS4. Identified luminal spaces were used as a central reference point for image analysis of immunostained cells. Representative areas of positive immunostain were isolated manually by a pathologist. Pixel values from areas of positive stain were collated into a color palette. Using a representing color palette for each immunostain, positive pixel identification was accomplished through a pixel color threshold operation. Analysis areas were segmented into categories of pixels which meet criteria of positive stain and non-positive stain pixels. Analysis steps outlined were completed using custom written plugins for ImageJ. The intraepithelial/periepithelial layer was defined as 0–45 μm outward from the border of the luminalluminal defined area. The stromal space was defined as between 45 and 300 μm from the border of the luminalluminal defined area, excluding any areas from adjacent acini that were included in the intra-epithelial/peri-epithelial capture.
Luciferase Assay
GDF-15 was expressed in PC3 cells by transient transfection of pCDNA3.1-GDF-15 expression vector. Empty vector control (pCDNA3.1-Empty) was used to normalize total DNA concentration when titrating in increasing concentrations of GDF-15 expression plasmid. All reporter assays were carried out in 6-well dishes and cells were plated at 3 × 10⁵ cells/well. Mirus transfection reagent (Mirus Bio LLC) was used for all transfection experiments. Mirus–DNA complex was formed using 1 μg of total plasmid DNA and 3 μl of Mirus in 100 μl of serum-free OptiMEM media (Life Technologies) and incubated at room temperature for 30 min. Two luciferase reporters were used to measure NFκB activity; one contained a minimal promoter, which included three NFκB consensus sites (NFκB-Luc), and one contained the NFκB binding region of the native COX2 promoter. Reporter plasmids were transfected into PC3 cells at 1 μg/well for all conditions. Twenty-four hours after transfection, cells were gently washed twice with 4°C PBS and lysed using 500 μl of 4°C luciferase harvest buffer (20 mM dibasic K2PO4, 5 mM MgCl2, 0.5% Triton X-100 diluted in ddH2O). Cells were incubated in harvest buffer at 4°C with gentle agitation for 15 min. Cell lysate was transferred to 1.5 ml microcentrifuge tubes and centrifuged 10 min at 14,000 rpm. Supernatant was transferred to a new 1.5 ml tube. Fifty microliters of supernatant was transferred to a luciferase tube containing 350 μl of luciferase assay buffer (100 mM dibasic K2PO4, 1 mM DTT, 5 mM ATP, 15 mM MgSO4 diluted in sterile ddH2O). Hundred microliters of luciferin solution (0.3 mg luciferin/ml diluted in ddH2O) was injected into each tube immediately prior to reading. Relative light units (RLU) were measured for 10 sec after luciferin injection. Protein concentration was measured for each sample using a Bradford protein assay kit (Bio-Rad Laboratories). RLU values were normalized to protein concentrations for each sample. Normalized luciferase activity (RLU/protein concentration) was averaged using three replicates per condition. Two-tailed Student t-test was used to determine statistically significant changes in luciferase activity with 95% confidence.
Cell Lines and Culture
PC3 prostate cancer cells were obtained from American Type Culture Collection (ATCC, Manassas, VA) and maintained in RPMI 1640 medium supplemented with 10% fetal bovine serum.
Immunoblot Analysis
Cells were harvested by washing two times in 4°C phosphate buffered saline. Total cellular extracts were prepared by cell lysis in RIPA buffer (150 mM NaCl, 1%NP40, 0.5% sodium deoxycholate, 0.1% SDS, 50 mM Tris pH 7.5) containing protease inhibitors (Protease Inhibitor Cocktail, Cat# P8340, Sigma-Aldrich, St. Louis, MO) and phosphatase inhibitors (10 mM NaVO4, and 50 mM NaF). Protein concentration of each extract was determined by dye-binding assay (Pierce BCA Protein Assay Kit, Cat# 23225, Thermo Scientific). Samples were separated on 4–12% MES NuPAGE gels (Invitrogen) and transferred to PVDF membrane. Signals were detected using enhanced chemiluminescence and autoradiography. Polyclonal antiserum directed against GDF-15 was generated by Zymed as described previously [16]. Affinity-purified anti-GDF-15 antibodies were prepared using the Pierce SulfoLink Coupling Resin according to the manufacturer’s instructions. β-Actin antibody was from Sigma (Cat# A5441).
qRT-PCR
Total RNA was isolated using the RNeasy Plus kit (Qiagen, Valencia, CA) as described by manufacturer’s instructions. cDNA was generated using 100 units of MMLV reverse transcriptase (Promega, Madison, WI), 1 μg of total RNA, 4 μl of 5 × reverse transcriptase buffer (Promega), 10 μg/μl random hexamers (Promega), and 10 mM deoxyribonucleotide tri-phosphate (dNTPs). The reverse transcriptase reaction was diluted to a final volume of 20 μl and run on a thermocycler using the following conditions: 10 min at 22°C, 45 min at 42°C, 5 min at 95°C, and 5 min at 5°C. Following cDNA synthesis, the reaction mixture was diluted to a final volume of 50 μl using ddH2O. Three microliters of cDNA solution was used in quantitative PCR (QPCR) reactions. QPCR reactions contained 10 μl × 2 SYBR Green PCR Master Mix (Applied Biosytems), 1 μl of primers (5 ng/ml final concentration), 3 μl cDNA, and 6 μl of ddH2O. The QPCR reaction mixture was loaded in triplicate into a 96-well QPCR plate. QPCR reactions were carried out on an ABI7500 real time thermocyler (Applied Biosytems) using the following settings: 2 min at 50°C, 10 min at 95°C, and 40 cycles of (15 sec at 95°C, 1 min at 60°C). Fold change was calculated using the comparative CT method [17] using expression of β-actin as a reference.
RESULTS
Inverse Correlation Between GDF-15 and Prostatic Inflammation
To investigate GDF-15 expression in normal and atrophic prostatic tissue, whole prostatectomy specimens were obtained from the University of Colorado Prostate Biorepository under IRB approval, and a representative section processed for histologic staining. IHC staining of normal non-cancerous prostate tissue revealed that GDF-15 was expressed in the luminalluminal epithelial compartment. Immunostaining for GDF-15 was decreased in areas containing inflammation (Fig. 1A). To examine the relationship between GDF-15 and inflammation, we scored for these two factors and measured their association using a semi-quantitative approach. Inflammation severity and GDF-15 expression were scored independently by four pathologists (KAI, MLS, MSL, FGLR, see Methods). GDF-15 expression was assessed using the sum of two scores from percent of cells staining positive (0 = 0%, 1 = 0–33%, 2 = 34–66%, 3 = 67–100%) and staining intensity within a low power field (0 = none, 1 = low, 2 = moderate, 3 = high). GDF-15 scores were added, assigned to inflammation score groups and graphed. Statistical analyses revealed that GDF-15 score decreases as inflammation score increases (Fig. 1B). This demonstrated that an inverse relationship exists between GDF-15 expression and inflammation in the prostate.
Fig. 1.
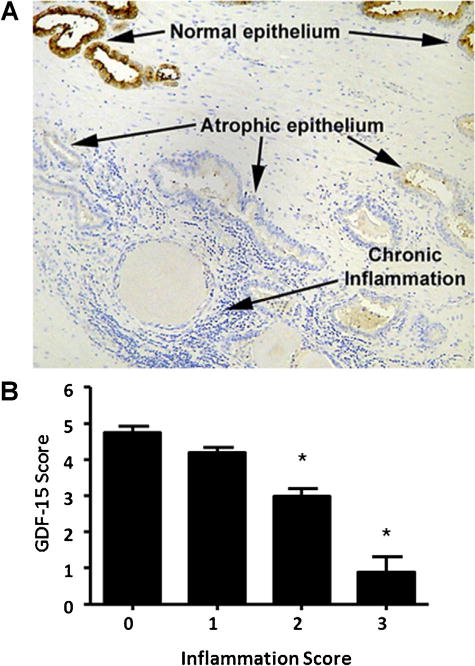
Expression of GDF-15 is inversely associated with prostatic inflammation. Top panel shows prostatic acini containing normal architecture, atrophic, and inflamed regions. IHC staining using an antibody against GDF-15 was performed. Bottom panel, GDF-15 expression and degree of inflammation were scored. GDF-15 expression was scored using the sum of two values—percent of cells staining positive (0= 0%, 1=1–20%, 2= 21–50%, 3=>50%) and staining intensity (0=none, 1=low, 2=moderate, 3=high) by IHC with in a low power field. Degree of inflammation was independently scored as: 0=no inflammation, 1=low inflammation, 2 =moderate inflammation, and 3=severe inflammation on H&E-stained sections of the same regions as stained for GDF-15. Statistical analysis was carried out using Student t-test. *P<0.05.
Inverse Association Between GDF-15 and Specific Inflammatory Cell Markers
To gain insight into which inflammatory cells are inversely associated with GDF-15, serial sections from prostate specimens were immunostained with antibodies against GDF-15 and specific inflammatory cell markers. Markers included CD3+ (T-cells), CD4+ (T-helper cells), CD8+ (cytotoxic T-cells), and CD68+ (activated macrophages). Macrophages were further classified as M1 versus M2 by staining for inos and arginase, respectively. Areas of the prostate containing normal and atrophic/inflammatory regions were analyzed. GDF-15 staining was high in normal prostatic acini and low in areas containing inflammation. CD3+ and CD68+ staining was low in normal acini and high in areas containing atrophy (Fig. 2).
Fig. 2.
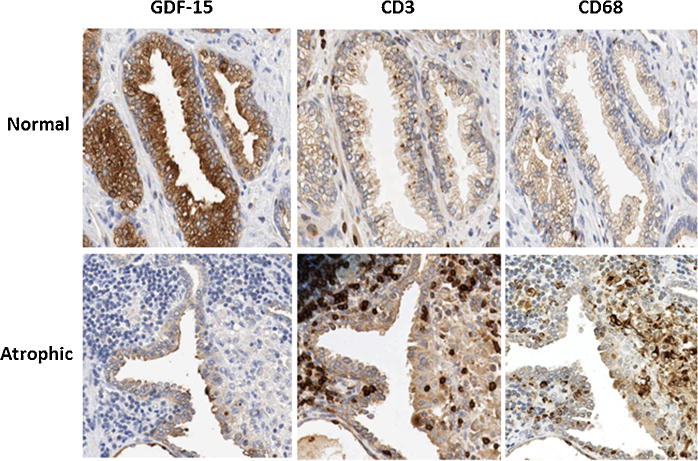
Inverse association between GDF-15 and leukocyte markers. Prostate specimens were immunostained with GDF-15 and leukocyte markers CD3 (T-cells) and CD68 (activated macrophages). Immunostaining is shown for regions containing normal architecture (Normal) and inflammatory atrophy (Atrophic). Photographs were taken at 40×magnification.
Quantifying Inverse Relationship Between GDF-15 Expression and Prostatic Inflammation Using Computer Image Analysis
A non-biased quantitative computer image analysis approach was used to define the association of GDF-15 and CD3-, CD4-, CD8-, and CD68-positive leukocytes using consecutive sections from prostatectomy specimens (Fig. 3). This approach allowed us to define the spatial relationship (epithelial/peri-epithelial or stromal) between GDF-15 and inflammatory cell markers. Entire whole-mount sections were scanned to obtain digital images. Prostatic glandular lumens were outlined manually to use as a starting point for spatial analysis. Staining intensity and extent/distance from glandular lumen (in pixels) for GDF-15 and inflammatory cell markers was obtained and numerical data for each immunostain was plotted scaled to provide a spectrum of pixel intensity for each marker (Fig. 4A and B). Linear correlation analysis revealed that an inverse relationship exists between GDF-15 and inflammatory cell markers CD3, CD4, CD8, and CD68. Spatial analysis revealed that this relationship exists in both the epithelial and periglandular regions surrounding the prostatic lumen (Fig. 4A and B and Table I).
Fig. 3.
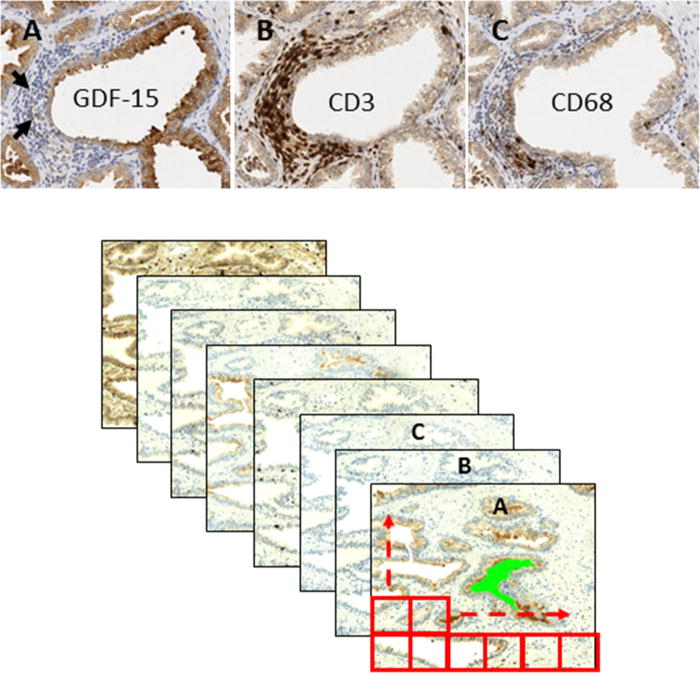
Computer image quantification of GDF-15 and inflammation marker immunostaining. Consecutive sections from whole prostatectomy specimens were immunostained using antibodies against GDF-15, CD3 (T-cells), CD4 (T-helper cells), CD8 (cytotoxic T-cells), and CD68 (activated macrophages) labeled as A, B, and C, respectively. Upper panel: representative IHC images. Arrows indicate inflammatory cells. Lower panel: example of grid-matching consecutive sections.
Fig. 4.
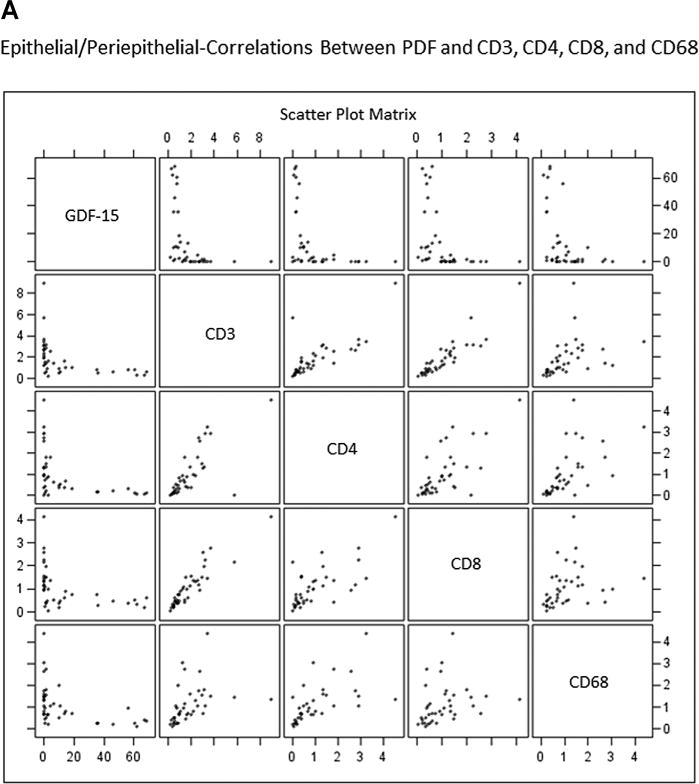
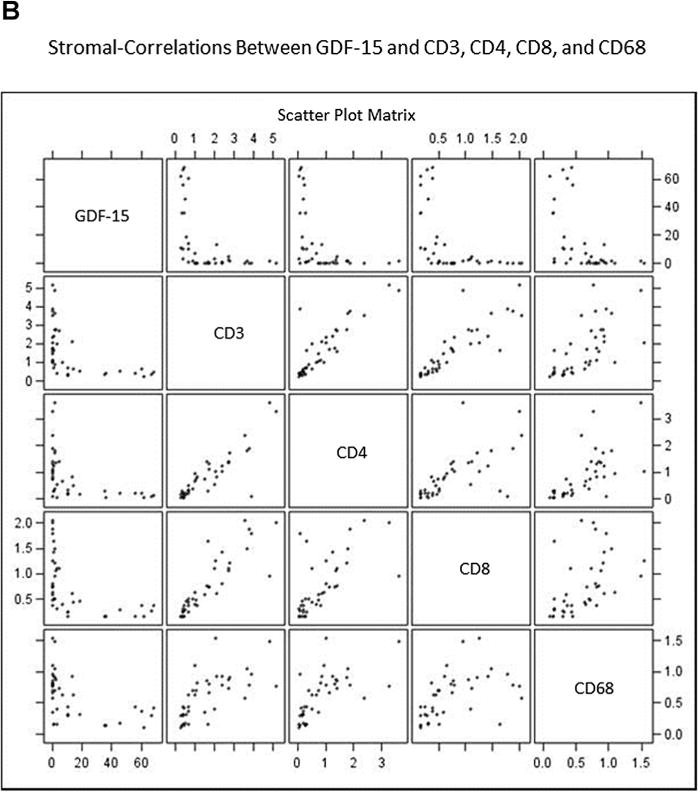
Scatterplots demonstrate inverse relationship between GDF-15 and inflammation markers in epithelial/peri-epithelial (A) and stromal (B) compartments. Prostate specimens were immunostained for GDF-15, CD3+ (T-cells), CD4+ (T-helper cells), CD8+ (cytotoxic T-cells), and CD68+ (macrophages). Staining intensity was scaled to normalize intensity measurements for markers to be compared. Graph shows staining intensity plotted as a scatterplot. Each panel shows normalized staining intensities for two (indicated) markers that intersect at each graph panel.
TABLE I.
Inverse Relationship Between GDF-15 Expression and Inflammatory Cell Staining in Human Prostate
| Target assoc. with GDF-15 | Correlation coefficient (r) | P-value |
|---|---|---|
| Epithelial/peri-epithelial (0–45 μm from lumen) | ||
| CD3 | −0.44 | 0.005 |
| CD4 | −0.46 | 0.003 |
| CD8 | −0.43 | 0.006 |
| CD68 | −0.44 | 0.005 |
| Inos+ | −0.33 | 0.041 |
| Arginine+ | −0.18 | 0.278 |
| Stromal (45–300 μm from lumen) | ||
| CD3 | −0.52 | 0.006 |
| CD4 | −0.47 | 0.002 |
| CD8 | −0.52 | 0.006 |
| CD68 | −0.51 | 0.009 |
| Inos+ | −0.56 | 0.0002 |
| Arginine+ | −0.22 | 0.187 |
Due to image analysis problems with positive staining of non-inflammatory cell elements with inos and arginase by IHC, these two markers could not be accurately scored using automation. Instead, the same regions as were scored for the other inflammatory markers were manually scored by a single pathologist (MSL) blinded as to the GDF-15 staining for these areas. Only the areas of each region defined as the epithelial/peri-epithelial or stromal regions were scored as the tissue outside of these boundaries was masked on the images by the software program. Inos- or arginase-positive macrophages were manually counted for each region analyzed and normalized to total tissue area for that region. The results are shown in Table I. Inos-positive macrophage (M1) counts are inversely correlated with prostatic epithelial GDF-15 expression in both the epithelial/peri-epithelial (P = 0.041) and stromal (P = 0.0002) compartments. There is no significant correlation between GDF-15 expression and the presence of arginase-positive (M2) macrophages.
GDF-15 Suppresses NFκB Activity
To gain insight into the potential mechanism for the inverse relationship between GDF-15 and inflammation, GDF-15 regulation of inflammatory mediator NFκB was examined. PC3 prostate cancer cells were transfected with GDF-15 expression vector and expression confirmed by immunoblot (Fig. 3A). PC3 cells were co-transfected with equal amounts of an NFκB responsive luciferase reporter (NFκB-Luc). As GDF-15 expression increased, NFκB-Luc reporter activity decreased (Fig. 5B). This suggested that GDF-15 suppresses NFκB activity. The NFκB transcription factor carries out its functions, in part, by increasing expression of pro-inflammatory genes including cyclo-oxygenase-2 (COX-2). To provide further evidence that GDF-15 suppresses NFκB, PC3 cells were co-transfected with GDF-15 expression vector and a luciferase reporter containing the NFκB-binding region of the native COX-2 promoter (COX-2-Luc). Increased expression of GDF-15 was accompanied by decreased activity of COX-2-Luc (Fig. 5C), suggesting that GDF-15 suppresses transcriptional activity through inhibition of NFκB activity on the COX-2 promoter. This suppression of NFκB transcriptional activity is not due to a general effect on global transcription; gene expression profiling of PC3 cells with forced expression of GDF-15 has been carried out in our laboratory. We observed subsets of genes that are positively regulated, negatively regulated and genes whose expression is not altered by expression of GDF-15 (data not shown).
Fig. 5.
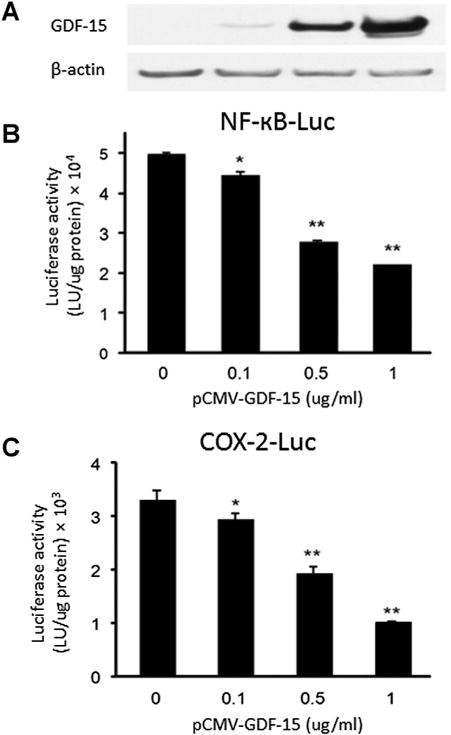
GDF-15 suppresses NFκB activity in PC3 cells. PC3 prostate cancer cells were co-transfected with the indicated amounts of GDF-15 expression vector (pCMV-GDF-15) and NFκB activated luciferase constructs (NFκB-Luc and COX-2-Luc) and luciferase activity was determined. (A) Immunoblot of GDF-15 expression in co-transfected cells. Statistical analysis was carried out using Student t-test. *P<0.05, **P<0.005.
IL-8 mRNA is Reduced in PC3 Cells Overexpressing GDF-15
To further investigate the ability of GDF-15 to suppress NFκB activity, we examined the expression of IL-8, an NFκB target gene. qRT-PCR analysis demonstrated significantly reduced levels of IL-8 mRNA in PC3 cells over expressing GDF-15 (Fig. 6). These data further support the model whereby GDF-15 suppresses expression of inflammation associated genes via suppression of NFκB action.
Fig. 6.
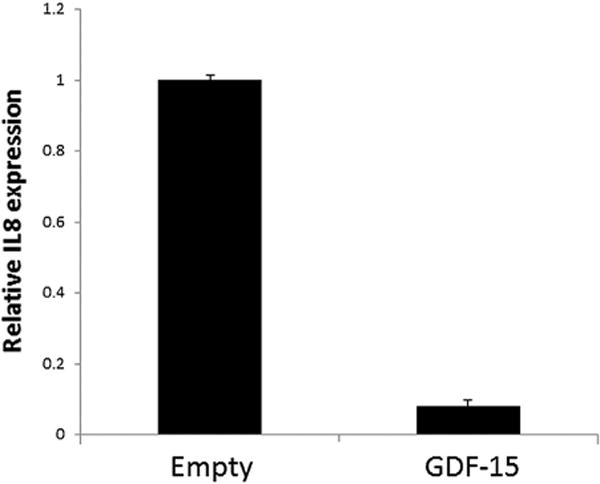
GDF-15 suppresses expression of IL8. PC3 cells were transfected with pCMV-GDF-15 (1 μg/ml) or empty vector control and IL-8 mRNA levels determined by qRT-PCR. β-Actin mRNA levels were used for normalization.
DISCUSSION
In this study, we examined the potential relationship between GDF-15 expression and prostatic lesions in human prostatectomy specimens. Although prostatic cancers showed widely variable expression of GDF-15 by IHC (data not shown), it was noted that GDF-15 expression was regularly decreased in areas containing inflammation. Expression of GDF-15 was scored in prostatectomy specimens containing areas of increasing inflammation severity. Using this technique, an inverse association between GDF-15 and prostatic inflammation in humans was identified (Fig. 1). Furthermore, using a non-biased image analysis approach, we found an inverse relationship between GDF-15 and CD3+ (T-cells), CD4+ (T-helper cells), CD8+ (cytotoxic T-cells), and CD68+ (activated macrophages) leukocytes. Further pathologic analysis demonstrated an inverse relationship between GDF-15 and inos+ (M1 macrophages) inflammatory cells in normal and atrophic prostate tissue. Spatial analysis revealed that this inverse association is significant and exists in both the epithelial/peri-epithelial and stromal compartments surrounding prostatic secretory lumens (Figs. 3 and 4).
The inverse correlation between GDF-15 and inflammation suggests a few hypotheses to explain this relationship: either expression of GDF-15 is suppressed by inflammation, or, conversely, GDF-15 plays an active role in inhibiting inflammatory processes in the prostate. To investigate the latter possibility, GDF-15 regulation of the inflammatory mediator, NFκB, was examined. GDF-15 suppressed activation of the NFκB-Luc and COX-2-Luc luciferase reporters in PC3 cells (Fig. 5), suggesting that GDF-15 actively suppresses NFκB activity. Consistent with our results, GDF-15 was recently reported to inhibit NFκB activity in osteoclasts [18]. Vanhara et al. reported that GDF-15 inhibited NFκB by causing delayed degradation of IκB, which is responsible for inhibiting NFκB transcriptional subunits. Degradation of IκB is triggered by phosphorylation by IκB kinase. We hypothesized that GDF-15 may inhibit NFκB activity by decreasing IκB phosphorylation and subsequent degradation. In our studies, no change in phosphorylation of IκB was observed (data not shown) suggesting that GDF-15 suppresses NFκB activity by a different mechanism in PC3 cells. Future studies will explore the mechanism of NFκB regulation by GDF-15 in prostate cancer cells. Another report indicated that GDF-15 is inversely associated with COX-2 expression in human colon cancer specimens and in the colon of ApcMIN/+ mice [19]. This suggests that GDF-15 potentially suppresses NFκB activity in the colon; however, this study did not determine activity of NFκB or any of its downstream-regulated genes.
IL-8 is an NFκB target gene. qPCR analysis revealed that IL-8 mRNA was decreased in PC3 cells with forced expression of GDF-15 (Fig. 6), giving further evidence to suggest that GDF-15 downregulates NFκB function. IL-8 is a chemoattractant for infiltrating inflammatory cells including T-cells and polymorphonuclear neutrophils (PMNs) [20,21]. GDF-15 may suppress the recruitment of inflammatory cells by suppressing IL-8. A recent report indicated that GDF-15 suppresses migration of PMNs by inhibiting integrin activation [22]. Suppression of integrins led to decreased migration of PMNs and decreased inflammation in cardiovascular tissue. This suggests that GDF-15 may play a dual role in the anti-inflammatory response; suppression of an inflammatory cell chemoattractant and inhibition of leukocyte migration.
GDF-15 was first identified as a gene up-regulated in activated macrophages and whose expression led to decreased TNF-α release from lipopolysaccharide-stimulated macrophages [13]. There is increased awareness of the importance of tumor promotional macrophages (M2) and tumor suppressive macrophages (M1) in the tumor microenvironment. In the current study, the inverse relationship between prostatic epithelial cell expression of GDF-15 and macrophages was limited to inos-positive macrophages, indicating that the M1-type macrophages are preferentially inhibited by GDF-15. Thus, there may be both potential tumor suppressive (through downregulation of NFκB) and tumor promotional (through downregulation of M1 macrophages) activities of GDF-15 in the prostate.
There is significant interest in the role of GDF-15 in prostatic disease including prostate cancer. A number of studies have demonstrated induction of GDF-15 expression following cellular exposure to various anti-tumorigenic compounds [14,16,19,23–29]. Forced expression of GDF-15 has been shown to inhibit tumor growth in several cancer types including prostate [16]. Conversely, GDF-15 expression is increased in several tumor types and increases in a model of prostate cancer progression [30]. Because GDF-15 is a secreted protein, serum levels of GDF-15 have been assessed. Several studies have demonstrated elevated serum GDF-15 levels in a variety of disease conditions and notably, prostate cancer [31]. Indeed, it has been proposed that evaluation of the combination of serum levels of GDF-15 and prostate-specific antigen might improve prostate cancer diagnosis [32]. The seemingly paradoxical nature of GDF-15 expression in prostate cancer is thought to be a function of it being a member of the TGFβ family of proteins; TGFβ is known to exert both anti-and pro-tumorigenic effects during cancer progression. Presently, the precise role of GDF-15 in prostate cancer development and progression remains unclear.
CONCLUSIONS
In summary, the present studies demonstrate an inverse association between GDF-15 expression and the presence of immune cells in human prostate specimens. The finding that GDF-15 suppresses NFκB, albeit by a yet to be determined mechanism, provides insight into a novel role for GDF-15 in suppression of prostatic inflammation. Elucidation of the role of GDF-15 in suppression of prostatic inflammation may promote the development of therapeutic strategies designed to target the GDF-15 signaling axis to prevent prostatic disease.
Supplementary Material
Acknowledgments
Grant sponsor: American Cancer Society; Grant number: RSG-04-170-01-CNE; Grant sponsor: Colorado Clinical and Translational Sciences Institute; Grant number: TL1 TR000155.
Footnotes
SUPPORTING INFORMATION
Additional supporting information may be found in the online version of this article at the publisher’s web-site.
References
- 1.Seigel R, Ma J, Jemal A. Cancer statistics, 2014. CA Cancer J Clin. 2014;64:9–29. doi: 10.3322/caac.21208. [DOI] [PubMed] [Google Scholar]
- 2.De Marzo AM, Nakai Y, Nelson WG. Inflammation, atrophy, and prostate carcinogenesis. Urol Oncol. 2007;25:398–400. doi: 10.1016/j.urolonc.2007.05.007. [DOI] [PubMed] [Google Scholar]
- 3.Nelson WG, De Marzo AM, DeWeese TL, Isaacs WB. The role of inflammation in the pathogenesis of prostate cancer. J Urol. 2004;172:s6–11. doi: 10.1097/01.ju.0000142058.99614.ff. discussion S11–12. [DOI] [PubMed] [Google Scholar]
- 4.Bosetti C, Rosato V, Gallus S, La Vecchia C. Aspirin and urologic cancer risk: an update. Nat Rev Urol. 2012;9:102–110. doi: 10.1038/nrurol.2011.219. [DOI] [PubMed] [Google Scholar]
- 5.Jacobs EJ, Rodriguez C, Mondul AM, Connell CJ, Henley SJ, Calle EE, Thun MJ. A large cohort study of aspirin and other nonsteroidal anti-inflammatory drugs and prostate cancer incidence. J Natl Cancer Inst. 2005;97:975–980. doi: 10.1093/jnci/dji173. [DOI] [PubMed] [Google Scholar]
- 6.Nelson WG, DeWeese TL, DeMarzo AM. The diet, prostate inflammation, and the development of prostate cancer. Cancer Metastasis Rev. 2002;21:3–16. doi: 10.1023/a:1020110718701. [DOI] [PubMed] [Google Scholar]
- 7.Lucia MS, Lambert JR, Platz EA, De Marzo AM. Inflammation as a target in prostate cancer. In: Figg WD, Chau CH, Small EJ, editors. Drug management of prostate cancer. New York: Springer; 2010. pp. 375–386. [Google Scholar]
- 8.Shih VF, Tsui R, Caldwell A, Hoffmann A. A single NFkappaB system for both canonical and non-canonical signaling. Cell Res. 2011;21:86–102. doi: 10.1038/cr.2010.161. [DOI] [PMC free article] [PubMed] [Google Scholar]
- 9.Nogueira L, Ruiz-Ontanon P, Vazquez-Barquero A, Moris F, Fernandez-Luna JL. The NFkappaB pathway: A therapeutic target in glioblastoma. Oncotarget. 2011;2:646–653. doi: 10.18632/oncotarget.322. [DOI] [PMC free article] [PubMed] [Google Scholar]
- 10.Andela VB, Gordon AH, Zotalis G, Rosier RN, Goater JJ, Lewis GD, Schwarz EM, Puzas JE, O’Keefe RJ. NFkappa B: A pivotal transcription factor in prostate cancer metastasis to bone. Clin Orthop Relat Res. 2003;415(Suppl):S75–85. doi: 10.1097/01.blo.0000093048.96273.aa. [DOI] [PubMed] [Google Scholar]
- 11.Lu T, Stark GR. Cytokine overexpression and constitutive NFkappaB in cancer. Cell Cycle. 2004;3:1114–1117. [PubMed] [Google Scholar]
- 12.Vykhovanets EV, Shankar E, Vykhovanets OV, Shukla S, Gupta S. High-fat diet increases NF-kappaB signaling in the prostate of reporter mice. Prostate. 2011;71:147–156. doi: 10.1002/pros.21230. [DOI] [PMC free article] [PubMed] [Google Scholar]
- 13.Bootcov MR, Bauskin AR, Valenzuela SM, Moore AG, Bansal M, He XY, Zhang HP, Donnellan M, Mahler S, Pryor K, Walsh BJ, Nicholson RC, Fairlie WD, Por SB, Robbins JM, Breit SN. MIC-1, a novel macrophage inhibitory cytokine, is a divergent member of the TGF-beta superfamily. Proc Natl Acad Sci USA. 1997;94:11514–11519. doi: 10.1073/pnas.94.21.11514. [DOI] [PMC free article] [PubMed] [Google Scholar]
- 14.Baek SJ, Kim KS, Nixon JB, Wilson LC, Eling TE. Cyclooxygenase inhibitors regulate the expression of a TGF-beta superfamily member that has proapoptotic and antitumorigenic activities. Mol Pharmacol. 2001;59:901–908. [PubMed] [Google Scholar]
- 15.Wynne S, Djakiew D. NSAID inhibition of prostate cancer cell migration is mediated by Nag-1 Induction via the p38 MAPK-p75(NTR) pathway. Mol Cancer Res. 2010;8:1656–1664. doi: 10.1158/1541-7786.MCR-10-0342. [DOI] [PMC free article] [PubMed] [Google Scholar]
- 16.Lambert JR, Kelly JA, Shim M, Huffer WE, Nordeen SK, Baek SJ, Eling TE, Lucia MS. Prostate derived factor in human prostate cancer cells: Gene induction by vitamin D via a p53-dependent mechanism and inhibition of prostate cancer cell growth. J Cell Physiol. 2006;208:566–574. doi: 10.1002/jcp.20692. [DOI] [PubMed] [Google Scholar]
- 17.Livak KJ, Schmittgen TD. Analysis of reltive gene expression data using real-time quantitative PCR and the 2(-delta delta C(T)) method. Methods. 2001;25(4):402–408. doi: 10.1006/meth.2001.1262. [DOI] [PubMed] [Google Scholar]
- 18.Vanhara P, Lincova E, Kozubik A, Jurdic P, Soucek K, Smarda J. Growth/differentiation factor-15 inhibits differentiation into osteoclasts—A novel factor involved in control of osteoclast differentiation. Differentiation. 2009;78:213–222. doi: 10.1016/j.diff.2009.07.008. [DOI] [PubMed] [Google Scholar]
- 19.Wang X, Kingsley PJ, Marnett LJ, Eling TE. The role of NAG-1/GDF15 in the inhibition of intestinal polyps in APC/Min mice by sulindac. Cancer Prev Res (Phila) 2011;4:150–160. doi: 10.1158/1940-6207.CAPR-10-0196. [DOI] [PMC free article] [PubMed] [Google Scholar]
- 20.Cassatella MA, Bazzoni F, Ceska M, Ferro I, Baggiolini M, Berton G. IL-8 production by human polymorphonuclear leukocytes. The chemoattractant formyl-methionyl-leucyl-phenylalanine induces the gene expression and release of IL-8 through a pertussis toxin-sensitive pathway. J Immunol. 1992;148:3216–3220. [PubMed] [Google Scholar]
- 21.Larsen CG, Anderson AO, Appella E, Oppenheim JJ, Matsushima K. The neutrophil-activating protein (NAP-1) is also chemo-tactic for T lymphocytes. Science. 1989;243:1464–1466. doi: 10.1126/science.2648569. [DOI] [PubMed] [Google Scholar]
- 22.Kempf T, Zarbock A, Widera C, Butz S, Stadtmann A, Rossaint J, Bolomini-Vittori M, Korf-Klingebiel M, Napp LC, Hansen B, Kanwischer A, Bavendiek U, Beutel G, Hapke M, Sauer MG, Laudanna C, Hogg N, Vestweber D, Wollert KC. GDF-15 is an inhibitor of leukocyte integrin activation required for survival after myocardial infarction in mice. Nat Med. 2011;17:581–588. doi: 10.1038/nm.2354. [DOI] [PubMed] [Google Scholar]
- 23.Nazarova N, Qiao S, Golovko O, Lou YR, Tuohimaa P. Calcitriol-induced prostate-derived factor: Autocrine control of prostate cancer cell growth. Int J Cancer. 2004;112:951–958. doi: 10.1002/ijc.20510. [DOI] [PubMed] [Google Scholar]
- 24.Baek SJ, Wilson LC, Eling TE. Resveratrol enhances the expression of non-steroidal anti-inflammatory drug-activated gene (NAG-1) by increasing the expression of p53. Carcinogenesis. 2002;23:425–434. doi: 10.1093/carcin/23.3.425. [DOI] [PubMed] [Google Scholar]
- 25.Lee SH, Kim JS, Yamaguchi K, Eling TE, Baek SJ. Indole-3-carbinol and 3,3′-diindolylmethane induce expression of NAG-1 in a p53-independent manner. Biochem Biophys Res Commun. 2005;328:63–69. doi: 10.1016/j.bbrc.2004.12.138. [DOI] [PubMed] [Google Scholar]
- 26.Appierto V, Villani MG, Cavadini E, Gariboldi M, De CI, Pierotti MA, Lambert JR, Reid J, Tiberio P, Colombo N, Formelli F. Analysis of gene expression identifies PLAB as a mediator of the apoptotic activity of fenretinide in human ovarian cancer cells. Oncogene. 2007;26:3952–3962. doi: 10.1038/sj.onc.1210171. [DOI] [PubMed] [Google Scholar]
- 27.Soto-Cerrato V, Vinals F, Lambert JR, Kelly JA, Perez-Tomas R. Prodigiosin induces the proapoptotic gene NAG-1 via glycogen synthase kinase-3beta activity in human breast cancer cells. Mol Cancer Ther. 2007;6:362–369. doi: 10.1158/1535-7163.MCT-06-0266. [DOI] [PubMed] [Google Scholar]
- 28.Newman D, Sakaue M, Koo JS, Kim KS, Baek SJ, Eling TE, Jetten AM. Differential regulation of nonsteroidal anti-inflammatory drug-activated gene in normal human tracheobronchial epithelial and lung carcinoma cells by retinoids. Mol Pharmacol. 2003;63:766–772. doi: 10.1124/mol.63.3.557. [DOI] [PubMed] [Google Scholar]
- 29.Lee SH, Yamaguchi K, Kim JS, Eling TE, Safe S, Park Y, Baek SJ. Conjugated linoleic acid stimulates and anti-tumorigenic protein NAG-1 in an isomer specific manner. Carcinogenesis. 2006;27:972–981. doi: 10.1093/carcin/bgi268. [DOI] [PubMed] [Google Scholar]
- 30.Chen SJ, Karan D, Johansson SL, Lin FF, Zeckser J, Singh AP, Batra SK, Lin MF. Prostate derived factor as a paracrine and autocrine factor for the proliferation of androgen receptor-positive human prostate cancer cells. Prostate. 2007;67:557–571. doi: 10.1002/pros.20551. [DOI] [PubMed] [Google Scholar]
- 31.Selander KS, Brown DA, Sequeiros GB, Hunter M, Desond R, Parpala T, Risteli J, Breit SN, Jukkola-Vuorinen A. Serum macrophage inhibitory cytokine-1 concentrations correlate with the presence of prostate cancer bone metastases. Cancer Epidemiol Biomarkers Prev. 2007;16:532–537. doi: 10.1158/1055-9965.EPI-06-0841. [DOI] [PubMed] [Google Scholar]
- 32.Brown DA, Stephan C, Ward RL, Law M, Hunter M, Bauskin AR, Amin J, Jung K, Diamandis EP, Hampton GM, Russell PJ, Giles GG, Breit SN. Measurement of serum levels of macrophage inhibitory cytokine 1 combined with prostate-specific antigen improves prostate cancer diagnosis. Clin Cancer Res. 2006;12:89–96. doi: 10.1158/1078-0432.CCR-05-1331. [DOI] [PubMed] [Google Scholar]
Associated Data
This section collects any data citations, data availability statements, or supplementary materials included in this article.