Abstract
Imaging of short-T2 species requires not only a short echo time (TE) but also efficient suppression of long-T2 species in order to maximize the short-T2 contrast and dynamic range. This paper introduces a method of long-T2 suppression using two long adiabatic inversion pulses. The first adiabatic inversion pulse inverts the magnetization of long-T2 water and the second one inverts that of fat. Short-T2 species experience a significant transverse relaxation during the long adiabatic inversion process, and are minimally affected by the inversion pulses. Data acquisition with a short TE of 8 μs starts following a time delay of TI1 for the inverted water magnetization to reach a null point, and a time delay of TI2 for the inverted fat magnetization to reach a null point. The suppression of long-T2 species depends on proper combination of TI1, TI2 and TR. It is insensitive to RF inhomogeneities because of the adiabatic inversion pulses. The feasibility of this dual inversion recovery ultrashort TE (DIR UTE) technique was demonstrated on phantoms, cadaveric specimens and healthy volunteers using a clinical 3T scanner. High image contrast was achieved for the deep radial and calcified layers of articular cartilage, cortical bone and the Achilles tendon.
Keywords: Ultrashort TE, short-T2 imaging, long-T2 suppression, adiabatic inversion pulses, musculoskeletal imaging
Introduction
The human body contains a variety of species or tissue components with short transverse relaxation times (T2), such as the deep radial and calcified layers of articular cartilage, menisci, ligaments, tendons, cortical and trabecular bone, periosteum, and the myelin water in white matter (1–3). The mean T2 values for these species range from several milliseconds down to tens of microseconds. Signal from these species decays rapidly after excitation, and is very low or undetectable when using conventional magnetic resonance imaging (MRI) sequences which typically utilize echo times (TE) of several milliseconds or longer.
The short-T2 species are of considerable scientific and clinical interest. By using a half radiofrequency (RF) pulse, variable rate selective excitation (VERSE) and radial mapping of k-space, TEs of 100 μs or shorter have been achieved with two-dimensional (2D) ultrashort TE (UTE) imaging sequences (4–11). Although short-T2 species can be detected with these UTE sequences, their contrast may be compromised by high signal intensity of the surrounding long-T2 species that often have a higher proton density. One of the major challenges for UTE imaging is suppression of this long-T2 signal in order to improve short-T2 contrast and dynamic range.
Long-T2 suppression can be achieved with saturation or inversion preparation pulses. The former approach employs long saturation pulses (90° or slightly higher flip angle) followed by spoilers to selectively suppress long-T2 species (10–15). This technique is sensitive to B1 and B0 inhomogeneity which may result in significant residual long-T2 signal and therefore reduced short-T2 contrast. The latter approach employs a long adiabatic inversion pulse to selectively invert and null long-T2 species while leaving the short-T2 species largely unaffected (6–9). UTE acquisition is initiated following the time delay (TI) necessary for the magnetization of inverted long-T2 species to reach the null point. This approach is relatively insensitive to B1 inhomogeneity because of the adiabatic inversion pulse (16, 17). But long-T2 water and fat typically have quite different T1 values and this precludes simultaneous nulling both tissues with a single TI. In addition, a relatively broad spectral bandwidth would be required to cover both fat and water simultaneously, resulting in significant short-T2 signal attenuation since this is inversely related to spectral bandwidth. Another approach is to subtract a later echo from the first UTE FID acquisition in order to suppress long-T2 species. However, this approach is subject to signal to noise ratio (SNR) reduction due to subtraction, and reduced image quality from the later echo due to susceptibility, B0 field inhomogeneity and eddy current.
Recently Larson et al proposed a novel approach for long-T2 signal suppression which utilized two UTE acquisitions: one with and the other without an adiabatic inversion preparation pulse (17). Long-T2 species are inverted by the adiabatic inversion pulse while short-T2 species are largely unaffected. Addition of the two UTE data sets suppresses those long-T2 signals which are negative as a result of the inversion preparation pulse but are positive when there is no inversion preparation pulse. However, simple subtraction results in incomplete long-T2 suppression because relaxation during the preparation pulses decreases the total magnetization. A scaling factor is needed so that the inverted long-T2 magnetization matches that of the non-inverted one in order to achieve better long-T2 suppression. This procedure is complicated if there are multiple long-T2 species with different T1 values. Furthermore, this approach requires two separate UTE acquisitions. The total scan time is doubled with increased sensitivity to motion.
In this paper we describe a new approach termed dual adiabatic inversion recovery ultrashort echo time (DIR UTE) imaging, which combines efficient suppression of long-T2 species with a 2D UTE sequence having a minimum TE of 8 μs. In this technique two long adiabatic inversion pulses are applied sequentially with the first one focused on the water peak and the second one on the fat peak. UTE acquisition starts at a delay time of TI1 for the inverted water protons to reach their null point, and a delay time of TI2 for the inverted fat protons to simultaneously reach their null point. The DIR UTE technique has been implemented on a clinical scanner and assessed on phantom, cadaveric specimens and healthy volunteers.
Materials and Methods
Pulse Sequence
The short-T2 contrast of an RF pulse is primarily determined by the spectral bandwidth of the pulse (12–14). Short-T2 species experience significant transverse relaxation during excitation and are largely unexcited by long duration pulses of low amplitude (12–14). Adiabatic inversion pulses, such as hyperbolic secant pulses, are preferable for long-T2 suppression, since these pulses are insensitive to B1 field inhomogeneity and provide uniform inversion of long-T2 species when the RF amplitude is above the adiabatic threshold (6–9, 16). With these pulses the short-T2 magnetization is only partly inverted. The degree of inversion depends on RF amplitude, pulse duration and T2 values. Longer duration pulses with narrower bandwidth tend to reduce attenuation of short-T2 signals (17). However, the spectral profile of a long duration adiabatic inversion pulse with a narrow bandwidth may not cover both the long-T2 water peak and fat peak, which are separated by 440 Hz at 3T. Therefore, a single long adiabatic inversion pulse may not be able to invert both long-T2 water and fat simultaneously. Furthermore, long-T2 water and fat have quite different T1 values. For example, muscle has a T1 of around 1400 ms and fat has a T1 of around 360 ms at 3T (18, 19). They cannot be nulled simultaneously using a single TI.
The DIR UTE sequence proposed in this paper is shown in Figure 1, where a 2D UTE sequence is preceded by two long adiabatic inversion pulses of 17 to 25 ms in duration. The sequence was implemented on a 3T Signa TwinSpeed scanner (GE Healthcare Technologies, Milwaukee, WI) with a maximum gradient performance of 40 mT/m and 150 mT/m/ms. The sequence combines half RF pulse, VERSE, radial ramp sampling and fast transmit/receive (T/R) switching and has a TE of 8 μs (20–22). Bipolar slice selective gradients and readout gradients are employed to help control eddy currents. Timing for the slice selection gradients and readout gradients was manually adjusted in increments of 2 μs by assessing image quality. Artifacts originating from these errors were further reduced by empirically shifting radial k-space trajectories during on-line image reconstruction. Two acquisitions with reversed slice selective gradient polarities were acquired and summed to form a complete slice profile. The radial projections were rotated to map k-space. The projection data were regridded onto 2D Cartesian grids which were then subject to 2D Fourier transformation to generate the final images (23). Two long duration adiabatic inversion pulses were employed to invert and null long-T2 water and fat magnetization, respectively.
Figure 1.
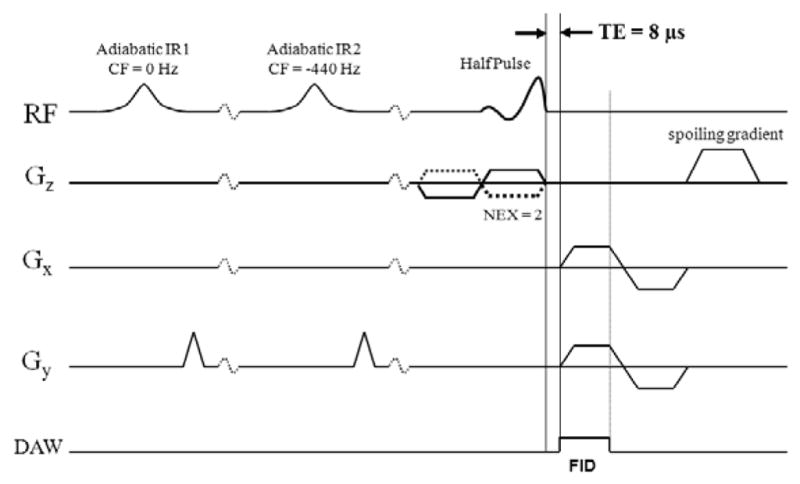
The dual inversion recovery UTE (DIR UTE) pulse sequence for imaging short-T2 species. The combination of half pulse excitation and radial ramp sampling allows a short TE of 8 μs. Two half RF excitations with opposite slice selection gradient polarity are required for each readout to form a complete slice profile. The long-T2 water and fat signals are inverted and nulled by two long duration adiabatic inversion pulses, with one centered on the water peak and one on the fat peak.
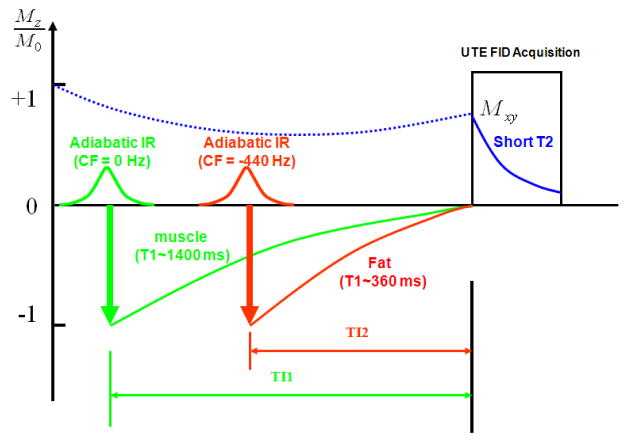
Figure 2 shows further detail of the DIR UTE acquisition scheme. The first long adiabatic inversion pulse is centered at 0 Hz to invert long-T2 water magnetization. The second long adiabatic inversion pulse is centered at −440 Hz to invert fat magnetization. TI can be calculated according to the following equation in order to null a tissue with a given T1:
| [1] |
or
Figure 2.
Data acquisition scheme for the DIR UTE sequence, where the first adiabatic inversion pulse is centered on the water peak and the second pulse is centered on the fat peak. The longitudinal magnetization of short-T2 species is not inverted since they experience significant transverse relaxation during the long adiabatic inversion process. UTE acquisition starts at a time delay of TI1 relative to the first inversion pulse and TI2 relative to the second inversion pulse, providing simultaneous nulling of long-T2 water and fat signals.
| [2] |
The water magnetization is subject to the initial adiabatic inversion pulse because long-T2 water magnetization usually has a longer T1, and requires a longer time delay of TI1 to reach the null point. Fat has shorter T1 and requires a shorter time delay TI2 to reach the null point. Proper combinations of TI1, TI2, and TR allow accurate nulling of both long-T2 water and fat.
The DIR UTE sequence was first evaluated using phantoms, followed by cadaver samples (patella and spine) and finally in vivo volunteers (distal tibia and the Achilles tendon). Inversion recovery fast spin echo (IR-FSE) sequence was used to measure T1 of each phantom or tissue in order to calculate TI based on equation [2].
Phantom Study
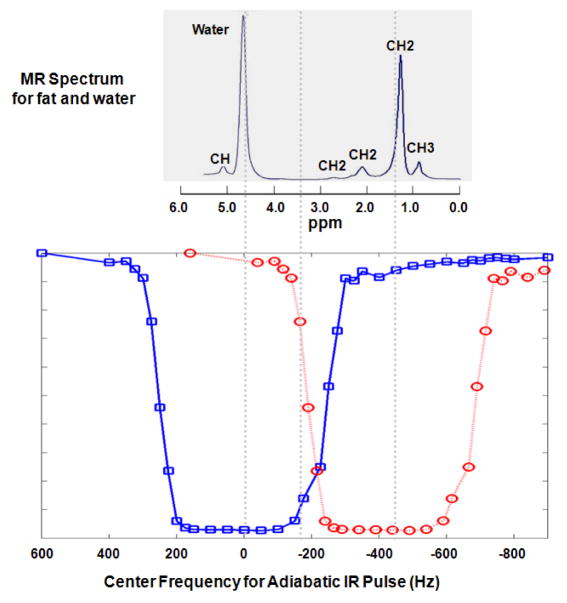
Since DIR UTE employs two adiabatic inversion pulses to suppress long-T2 water and fat, spectral overlap between the two pulses may lead to imperfect inversion and result in long-T2 signal contamination. The spectral profiles of various adiabatic inversion pulses have been investigated by several groups using Bloch equation simulations (14, 17, 23, 24). In this study we measured the spectral profile of a Silver Hoult adiabatic inversion pulse (25 ms in duration) using an inversion recovery UTE acquisition. The correct combination of TR and TI, such as 300/145 ms, nulls the distilled water (T1 ~ 2670 ms) signal completely when its resonance frequencies are well covered by the adiabatic inversion pulse in the spectral domain. High signal is achieved if the center frequency of the adiabatic inversion pulse is shifted away from the spectral peak. By repeating the experiment with a series of center frequencies from −800 Hz to 800 Hz, the signal intensity vs. center frequency of the adiabatic inversion pulse curve provides an approximation of its spectral response profile. The measured profile shown in Figure 3 demonstrates that the adiabatic inversion pulse with a duration of 25 ms has a spectral bandwidth of approximately 520 Hz with sharp transition regions. Figure 3 also shows a typical single voxel PRESS spectrum of fat and water, which includes five fat peaks and one water peak (25). The inversion pulse centered at zero Hz covers the water peak and CH peak, while the inversion pulse centered at −440 Hz covers the CH2 and CH3 peaks. There is only a small CH2 peak in the overlapping region. Thus the two long adiabatic inversion pulses provide effective coverage of the water and multiple fat peaks, allowing inversion of their longitudinal magnetization.
Figure 3.
A typical MR spectrum for plant oil and water (upper) and the measured adiabatic inversion pulse (25 ms in duration) spectral profile (lower) at 3T. The MR spectrum was reversed from left to right for the purpose of display in order to match the spectral profile, which has a spectral bandwidth of about 500 Hz with sharp transition regions. Two long adiabatic inversion pulses can be centered at 0 Hz to cover the water and CH peak, and −440 Hz to cover CH2 and CH3 peaks with little spectral overlap.
The DIR UTE sequence was applied to a phantom consisting of a tube of distilled water, a tube of vegetable oil (T1 ~270 ms), and a tube of distilled water doped with MnCl2 (T2* ~ 400 μs, T1 ~ 4 ms). The following imaging parameters were used: a FOV of 10 cm, a slice thickness of 2 mm, a readout of 512 (284 sampling points), sampling bandwidth (BW) of ±62.5 kHz, a TR of 300 ms, a TE of 8 μs, a TI1 of 145 ms, a TI2 of 110 ms, 511 half projections, 2 number of excitations (NEX), and total scan time of around 5 minutes. For comparison a regular dual echo UTE sequence, UTE combined with single adiabatic inversion pulse focused on the water and fat peaks, respectively, and clinical sequences, including a 2D gradient echo (GE) sequence with a TE of 3 ms and a fast spin echo (FSE) sequence without and with fat saturation were also performed with the same spatial resolution.
Cadaver Sample Study
The DIR UTE sequence was then performed on three patella samples and one spine sample. For the patella samples a 1-inch birdcage coil was used for signal excitation and reception. For the spine sample, a single channel 3-inch coil was used for signal reception and the body coil was used for signal excitation Typical imaging parameters were similar to those used in the phantom study, except a smaller FOV of 6 cm and a thinner slice thickness of 0.7 mm were used.. T1 was around 1100 ms for the superficial layers of cartilage and 310 ms for fat of these samples. A TI1 of 140 ms and TI2 of 110 ms were employed (TI2 is suboptimal in order to avoid overlap between the two long adiabatic pulses). For comparison a regular dual echo UTE sequence, UTE combined with single adiabatic inversion pulse focused on the water and fat peaks, respectively, and clinical sequences, including a 2D gradient echo (GE) sequence with a TE of 3 ms, a proton-density weighted fast spin echo (PD-FSE) sequence and a T1-weighted fast spin echo (T1-FSE) sequence were also performed without and with fat saturation with the same spatial resolution.
In Vivo Volunteer Study
The DIR UTE sequence was performed to image the distal tibia and the Achilles tendon of six healthy volunteers. Institutional review board permission was obtained for this study. A single channel receive-only 3-inch coil was used for signal reception and the body coil was used for signal excitation. Typical imaging parameters were similar to those used in the phantom study, except a slice thickness of 5 mm was used for the distal tibia, and a slice thickness of 3 mm and 299 half projections were used for the Achilles tendon. T1 was around 1500 ms for muscle and 340 ms for marrow fat. A TI1 of 140 ms and TI2 of 110 ms were employed (TI2 is suboptimal in order to avoid overlap between the two long adiabatic pulses). For comparison a regular UTE sequence and a clinical 2D GE sequence were performed for the distal tibia study, and a dual echo UTE sequence was performed for the Achilles tendon with the same spatial resolution.
Quantitative Analysis
For quantitative assessment of the quality of the DIR UTE, single IR UTE and regular UTE images, both SNR and contrast to noise ratio (CNR) measurements were performed in the phantom study. SNR was calculated as the ratio of the mean signal intensity inside a user-drawn region of interest (ROI) within the short-T2 water tube to the standard deviation of the signal in an ROI placed in the background. CNR between the short-T2 tube and distilled water tube (CNRS_W) and fat (CNRS_F) were calculated as their signal difference over background noise. SNR and CNR were also measured for short-T2 species, including SNR for the deep radial and calcified layers of articular cartilage (SNRDL), cortical bone (SNRBone) and the Achilles tendon (SNRTendon). CNR between the deep layers of cartilage and superficial layers of cartilage (CNRDLSL) or fat (CNRDLFat), CNR between cortical bone and fat (CNRBoneFat) and CNR between the Achilles tendon and muscle (CNRTendonMuscle) were also measured. Standard deviations were calculated by placing multiple ROIs at different regions for the short T2 species. Typical ROIs included more than 100 pixels for the water/fat phantoms, cortical bone and the Achilles tendon. A small line-shape ROI with 4 to 10 pixels was carefully placed along the high signal line for the deep radial and calcified layers of articular cartilage.
Results
Phantom Study
Figure 4 shows the results of the phantom study using the DIR UTE sequence, as well as conventional dual echo UTE, UTE with a single long adiabatic inversion pulse focused on either the water peak or fat peak, and clinical gradient echo (GE) and fast spin echo (FSE) acquisitions without and with fat saturation. The short-T2 phantom is invisible with all clinical sequences. There is significant residual fat signal in images acquired with clinical sequences even with fat saturation pulses, possibly due to the CH peak which is located at 5.3 ppm (close to the water peak) and is not suppressed by chemical shift based fat saturation pulses. The conventional UTE image shows high signal in all three tubes. There are some ring artifacts around the oil tube due to off-resonance which results in ringing artifact in radial imaging. There is significant residual fat signal in the UTE echo subtraction image due to significant fat signal decay during the echo spacing of 4.4 ms, which is the minimal value for the fat and water in-phase imaging. The long duration adiabatic inversion pulse focused on water peak (0 Hz) selectively nulls water signal with a TR of 300 ms and TI of 145 ms, but fat signal remains bright. When the long adiabatic inversion pulse is shifted to −440 Hz, fat signal is selectively suppressed with a TR of 300 ms and a TI of 110 ms, but water signal remains bright. There are some residual fat signal from CH peak which is close to the water peak and is not inverted by the inversion pulse. The DIR UTE sequence with a TR of 300 ms, TI1 of 145 ms and TI2 of 110 ms selectively suppresses both water and fat, leaving excellent contrast for the short-T2 water tube. Furthermore, DIR UTE provides better fat suppression than clinical fat suppressed GE or FSE sequences, or UTE with single adiabatic inversion pulse focused on fat peak. This is because fat has multiple peaks which cannot be covered by a single fat saturation pulse or inversion pulse, but are covered and suppressed by the two adiabatic inversion pulses, respectively. Quantitative measurements of SNR and CNR shown in Table 1 demonstrate that DIR UTE provides a significant contrast improvement between the short-T2 phantom and long-T2 water or fat phantom over the conventional UTE, UTE with echo subtraction or single adiabatic inversion pulse.
Figure 4.
Conventional MR imaging and UTE imaging of a phantom consisting of three tubes of distilled water, plant oil and distilled water doped with MnCl2 (which has a short T2* of around 0.4 ms). From left to right, the images correspond to: gradient echo imaging (A), gradient echo imaging with chemical shift based fat saturation pulse (B), fast spin echo imaging (C), fast spin echo imaging with fat saturation (D), UTE imaging with a TE of 8 μs (E) and 4.4 ms (F), UTE imaging with echo subtraction (G), UTE imaging with long adiabatic inversion and nulling of long-T2 water signals (H), UTE imaging with long adiabatic inversion and nulling of fat signals (I), and DIR UTE (J). The short-T2 phantom is only visible with UTE sequences (short thick arrows). There are significant residual fat signals (long thin arrows) with all clinical sequences, as well as conventional UTE and UTE with single inversion pulse.
Table 1.
Quantitative measurements of SNR for the short-T2 phantom, CNR between the short-T2 phantom and long-T2 water phantom (CNRS_W) and CNR between the short-T2 phantom and fat (CNRS_F) for conventional UTE, dual echo UTE with subtraction, UTE with the adiabatic IR pulse shifted to 0 Hz and −440 Hz, and DIR UTE.
| UTE | UTE Subtraction | UTE IR (0 Hz) | UTE IR (−440 Hz) | DIR UTE | |
|---|---|---|---|---|---|
| SNR | 25.7 | 16.4 | 24.8 | 25.2 | 23.6 |
| CNRS_W | 5.8 | 15.3 | 24.3 | 5.5 | 23.2 |
| CNRS_F | −10.1 | 0.8 | −6.0 | 19.3 | 22.8 |
Cadaver Sample Study
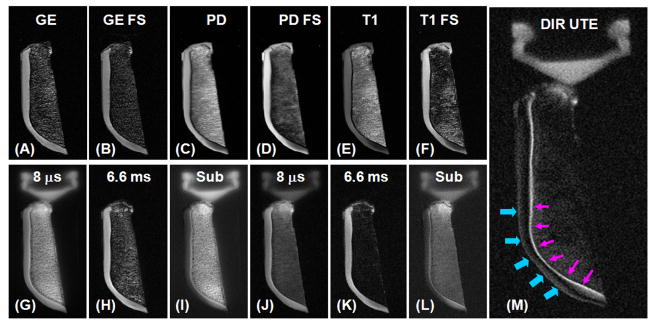
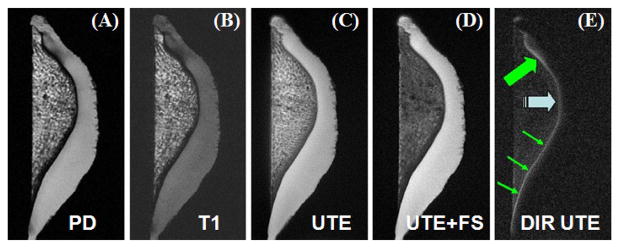
Figure 5 shows DIR UTE imaging of a normal axial patellar cadaveric slice obtained from a human knee specimen. The imaging FOV of 8 cm, slice thickness of 0.7 mm and readout length of 512 result in an acquired voxel size of 0.16×0.16×0.7 mm3, providing high resolution imaging of the patella with a total scan time of 6 minutes. The high signal line probably represents a combination of signals from the deepest radial zone and calcified cartilage. The PD-FSE, T1-FSE and GE sequences did not show the deep radial and calcified layers of cartilage. The regular UTE sequence shows a high signal line, representing the deep radial and calcified layers of cartilage. However, there is limited contrast between the deep and superficial layers of this tissue. The DIR UTE sequence selectively suppresses signals from the superficial layers of articular cartilage and fat, providing a SNR of 15.6 ± 3.8 for the deep layers of cartilage, a CNR of 10.7 ± 3.2 between the deep and superficial layers of articular cartilage, and a CNR of 10.0 ± 2.5 between the deep layers of cartilage and fatty marrow. Compared to regular UTE imaging, the DIR UTE sequence increases the contrast between the deep layers and superficial layers of cartilage by a factor of 5.8, and the contrast between the deep layers of cartilage and bone marrow fat by a factor of 4.2. Figure 6 shows DIR UTE imaging of another patella slice with a smaller FOV of 5 cm, and an acquired voxel size of 0.1×0.1×0.7 mm3. The DIR UTE sequence provides high contrast demonstration of the deep radial and calcified layers of cartilage, which is represented by a linear, well-defined area of high signal (thin arrows). Effacement and thickening (thick arrows) of the deep layers of cartilage is also observed. The deep radial and calcified cartilage are invisible with clinical PD or T1 FSE sequences, and visible, but with limited contrast when imaged with UTE or UTE with fat saturation.
Figure 5.
Axial imaging of a patella slice with clinical gradient echo (A), GE with fat saturation (B), PD FSE (C), PD FSE with FS (D), T1 FSE (E), T1 FSE with FS (F), conventional UTE with a TE of 8 μs (G) and 6.6 ms (H), subtraction of the second echo from the first echo (I), fat saturated UTE with a TE of 8 μs (J) and 6.6 ms (K) with the corresponding later echo subtraction (L), and DIR UTE (M). Clinical GE or SE sequences show no signal from deep radial and calcified cartilage, which appears bright with UTE sequences but there is limited contrast between the deep layers of cartilage and superficial layers of cartilage as well as with bone marrow fat. The DIR UTE image shows the deep radial and calcified cartilage with high contrast (pink arrows) with good suppression of the signal from the superficial layers of cartilage and fat. There is some residual signal from the superficial layers of cartilage due to variation in its T1 (imperfect nulling).
Figure 6.
Axial imaging of a patellar slice using PD-FSE (A), T1-FSE (B), UTE without (C) and with (D) fat saturation, and DIR UTE (E) sequences, respectively. The DIR UTE sequence selectively suppresses signals from the superficial layers of cartilage and bone marrow fat, creating excellent image contrast with the deep radial and calcified cartilage which is shown as a linear, well-defined area of high signal (thin arrows). Effacement and thickening (thick arrows) of the deep radial and calcified cartilage is also observed.
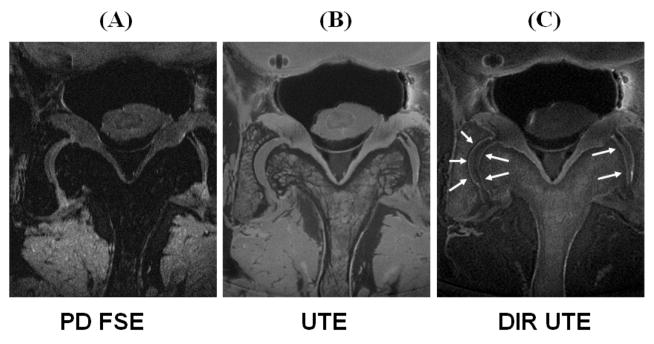
The 2D DIR UTE sequence was also applied to a spine sample. Signal from fat and the superficial layers of cartilage was selectively suppressed by the dual adiabatic inversion preparation pulses, providing high contrast visualization of the deep radial and calcified layers of cartilage, as shown by the arrow heads (Figure 7). The acquired voxel size was 0.1×0.1×0.7 mm3 and the CNR between the deep layers and superficial layers of cartilage was 9.8 ± 2.1. In comparison the PD-FSE sequence provided little information about short-T2 species. Conventional UTE imaging provides high signal for both short and long-T2 species including the deep layers of cartilage, periosteum, and fibrocartilage. However, there is little image contrast (CNR < 1) between the deep and superficial layers of cartilage.
Figure 7.
Imaging of an axial cadaveric lumbar spine sample using PD-FSE (A), regular UTE (B) and DIR UTE (C) sequences, respectively. The clinical FSE sequence shows no delineation of the deep layers of cartilage. The regular UTE sequence shows high signal from the deep radial and calcified cartilage, but little contrast with the superficial layers of cartilage. The DIR UTE sequence selectively suppresses signals from fat and superficial layers of cartilage, creating high contrast with the deep layers (arrow heads).
In Vivo Volunteer Study
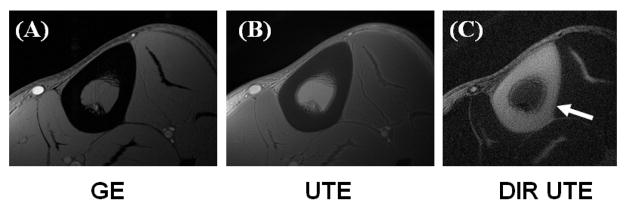
Figure 8 shows images of the left distal tibia of a 31 year old healthy male volunteer using clinical 2D GE, conventional UTE and DIR UTE techniques with a FOV of 10 cm and a slice thickness of 5 mm. Cortical bone demonstrates a signal void with the 2D GE sequence, and poor contrast with the conventional UTE sequence due to the high signal from the surrounding muscle and fat. The DIR UTE sequence suppresses both muscle and fat, displays cortical bone with high contrast. Figure 9 shows a DIR UTE image of the Achilles tendon in a 53 year old healthy male volunteer. High resolution images are generated with a FOV of 10 cm, a slice thickness of 3 mm and a readout of 512, resulting in an acquired voxel size of 0.2×0.2×3.0 mm3. The total scan time was 3 minutes with a TR of 300 ms and 299 projections. The DIR UTE sequence provides excellent suppression of long-T2 muscle and fat signals, and high contrast visualization of the Achilles tendon. In comparison, a fat suppressed dual echo UTE acquisition with a TE of 8 μs and 6.6 ms shows reduced image contrast and SNR in the subtraction image. This signal and contrast reduction is due to increased signal attenuation from the clinical fat saturation pulse, reduced image quality in the second echo and the SNR penalty resulting from image subtraction.
Figure 8.
Axial MR imaging through the mid-tibia of a healthy volunteer using gradient echo sequence (A), conventional UTE (B) and DIR UTE sequences (zoomed up) (C), respectively. The clinical GE sequence shows signal void for cortical bone. The regular UTE sequence shows slightly higher signal from cortical bone but poor contrast due to the high signal from the surrounding muscle and fat which limit the dynamic range for bone. The DIR UTE sequence selectively suppresses signal from fat and muscle creating high contrast with cortical bone.
Figure 9.
Axial MR images through the lower extremity of a healthy volunteer depicting the Achilles tendon using a conventional dual echo UTE acquisition with a TE of 8 μs (A) and 6 ms (B), and a DIR UTE sequence (D), respectively. Echo subtraction suppresses the long-T2 muscle and fat signals, increasing contrast with the Achilles tendon (C). However, the residual long-T2 signal limits the achievable contrast. The DIR UTE sequence selectively suppresses signal from fat and muscle, creating high contrast with the Achilles tendon (arrows).
Quantitative Analysis
Quantitative measurements of SNR and CNR shown in Table 2 demonstrate that the DIR UTE sequence provides a significant contrast improvement between the short-T2 species and long-T2 water and/or fat in both cadaveric samples and human volunteers when compared with the conventional UTE technique, although SNR is reduced by 25 to 30 percent because of the short-T2 signal attenuation produced by the two long adiabatic inversion pulses.
Table 2.
Quantitative measurements of SNR and CNR for the short-T2 species, including SNR for the deep radial and calcified layers of articular cartilage (SNRDL), cortical bone (SNRBone) and the Achilles tendon (SNRTendon), CNR between the deep layers of cartilage and superficial layers of cartilage (CNRDLSL) or fat (CNRDLFat), CNR between cortical bone and fat (CNRBoneFat) and CNR between the Achilles tendon and muscle (CNRTendonMuscle).
| Patella | Spine | Cortical Bone | Tendon | |||||||||||||||
|---|---|---|---|---|---|---|---|---|---|---|---|---|---|---|---|---|---|---|
| SNRDL |
|
|
SNRDL |
|
|
SNRBone |
|
|
SNRTendon |
|
||||||||
| UTE | 21.3 (4.9) | 1.3 (0.3) | −3.5 (0.6) | 20.5 (4.9) | 0.6 (0.2) | −1.4 (0.3) | 19.9 (4.2) | −37.3 (5.4) | −49.7 (5.7) | 38.8 (6.2) | −8.8 (1.7) | |||||||
| DIR UTE | 15.6 (3.6) | 10.7 (3.2) | 8.8 (2.3) | 14.6 (3.8) | 8.5 (2.1) | 5.6 (1.4) | 15.1 (2.5) | 12.8 (2.3) | 11.9 (2.1) | 27.2 (3.4) | 22.1 (2.4) | |||||||
Note: Values in brackets – standard deviation
Discussion
The DIR UTE sequence is capable of suppressing long-T2 water and fat signals simultaneously, and providing excellent image contrast for short-T2 species, including the deep radial and calcified layers of articular cartilage, cortical bone and the Achilles tendon. The success of DIR UTE technique relies on the following four factors. Firstly, an ultrashort TE of 8 μs allows the detection of species with extremely short T2 relaxation times, such as cortical bone with a T2* of around 400 μs (7). Secondly, long adiabatic inversion pulses allow robust inversion of long-T2 species even with inhomogeneous B1 fields once B1 is above the adiabatic threshold (16, 17). Thirdly, long duration adiabatic inversion pulses have only a small effect on the magnetization of short-T2 species, which experience significant transverse relaxation during the long inversion process (17). Fourthly, proper combination of TR, TI1 and TI2 allows simultaneous nulling of both long-T2 water and fat.
Since the two adiabatic inversion pulses are applied at two distinct resonance frequencies the spectral profiles of the two adiabatic pulses must be separated Overlap between the two spectral profiles may potentially cause re-inversion of the long-T2 species magnetization, resulting in imperfect signal nulling and potentially reduced short-T2 contrast. The long adiabatic inversion hyperbolic secant pulses employed in the DIR UTE sequence have a sharp transition band with a spectral bandwidth of around 520 Hz, as shown in Figure 3. As a result, there is little overlap when centering one pulse at zero Hz and one at −440 Hz. To further minimize the possibility of spectral overlapping, the first adiabatic inversion pulse could be shifted to a positive resonance frequency (e.g., 100 Hz) and/or the second adiabatic inversion pulse could be shifted to a lower negative value (e.g., −500 Hz). Another way to minimize the possibility of spectral overlap is to use narrow bandwidth adiabatic inversion pulses. These also reduce short-T2 signal attenuation but may lead to increased sensitivity to off-resonance effects.
Several research groups have investigated the effect of adiabatic inversion pulses on short-T2 species and show that short-T2 signal attenuation depends on pulse bandwidth, RF amplitude and the T2 values (2, 17, 21). Longer adiabatic inversion pulses with narrower spectral bandwidths reduce short-T2 signal attenuation. Compared to the single IR UTE technique where the inversion pulse must have a bandwidth broad enough to cover both fat and water (19), the DIR UTE sequence allows significantly longer adiabatic inversion pulses with narrower pulse bandwidths. This is likely to reduce short-T2 signal attenuation. Quantitative evaluation of the short-T2 signal attenuation by long duration pulses can be performed through simulation (17). The use of lower RF amplitude also reduces short-T2 signal attenuation. Recently, Larson et al reported obvious short-T2 signal enhancement by reducing the adiabatic RF peak power by 20% (17). The drawback is that the reduced RF peak power may be below the adiabatic threshold and thus affect the inversion. For small FOV imaging where B1 is relatively homogeneous, reducing the adiabatic RF peak power may significantly enhance short-T2 signals. This might be especially helpful with DIR UTE imaging since short-T2 magnetization experiences two inversion pulses.
The DIR UTE technique works robustly when there are two pools of long-T2 species with two different T1 values, which is often the case in short-T2 imaging where muscle and fat are the source of the two most important confounding signals. When there are more than two tissues with distinct T1 values, there may be no ideal suppression techniques for all long-T2 species. For example, the water protons in muscle and skin may have different T1 values, precluding simultaneous nulling as demonstrated in Figures 8 and 9 where signal from the skin is not nulled and appears relatively bright. However, the longitudinal magnetization of skin is still inverted by the first adiabatic inversion pulse focused on the water peak, resulting in reduced skin signal with the imperfect nulling time of TI1. The olefinic protons in the fatty acid chains (double bond CH fat peak) which are located close to the water peak are also inverted by the first adiabatic inversion pulse, and are significantly suppressed even with an imperfect nulling time of TI1 as shown in Figure 4J. The residual fat signal in Figure 7c may also be due to the olefinic protons in the fatty acid chains which are not completely nulled.
The DIR UTE technique can readily be used for imaging of other short-T2 species, such as the menisci, ligaments, entheses, and calcification in many human body tissues. It can also be integrated into T1 and T2* measurement techniques where long-T2 suppression is critical since residual long-T2 signal contamination due to out-of-slice excitation may significantly affect the quantification accuracy of short-T2 species (26).
One limitation of the DIR UTE technique is that it requires two adiabatic inversion pulses, which may lead to an increased specific absorption ratio (SAR) especially at high field strengths. Adiabatic inversion pulses partly rotate the short T2 magnetization, resulting in reduced short T2 signal. As a result, DIR UTE may lead to more short T2 signal attenuation since two adiabatic inversion pulses are used sequentially. On the other hand, unlike UTE with a single inversion pulse which must have a spectral profile wide enough to cover both water and fat peaks simultaneously for robust inversion, The DIR UTE sequence allows adiabatic inversion pulses with much narrower spectral bandwidths to cover the water and fat peaks, respectively, resulting in reduced short T2 signal attenuation (17). Another limitation is that the DIR UTE sequence is a 2D imaging technique. It is subject to a significant partial volume effect in imaging fine structures such as the calcified cartilage (<0.1 mm) using a relatively thick slice (e.g. 0.7 mm). A 3D UTE sequence combined with the DIR preparation approach may be more appropriate to image the thin structure (27), and will be investigated in the future.
Conclusion
DIR UTE can be used to robustly suppress long-T2 species, providing high image contrast for short-T2 species such as the deep radial and calcified layers of cartilage, cortical bone and the Achilles tendon.
Acknowledgments
The authors thank Sheronda Statum and Richard Znamirowski for sample preparation. This work was supported by grants from the Agfa Healthcare/RSNA Research Scholar, GE Healthcare, and VA #1136264.
References
- 1.Gold GE, Pauly JM, Macovski A, Herfkens RJ. MR spectroscopic imaging of collagen: tendons and knee menisci. Magn Reson Med. 1995;34:647–654. doi: 10.1002/mrm.1910340502. [DOI] [PubMed] [Google Scholar]
- 2.Gatehouse PD, Bydder GM. Magnetic resonance imaging of short T2 components in tissues. Clin Radiol. 2003;58:1–19. doi: 10.1053/crad.2003.1157. [DOI] [PubMed] [Google Scholar]
- 3.Wu Y, Ackerman JL, Chesler DA, Graham L, Wang Y, Glimcher MJ. Density of organic matrix of native mineralized bone measured by water- and fat-suppressed proton projection MRI. Magn Reson Med. 2003;50:59–68. doi: 10.1002/mrm.10512. [DOI] [PubMed] [Google Scholar]
- 4.Conolly S, Nishimura D, Macovski A, Glover G. Variable-rate selective excitation. J Magn Reson. 1988;78:440–458. [Google Scholar]
- 5.Bergin CJ, Pauly JM, Macovski A. Lung parenchyma: projection reconstruction MR imaging. Radiology. 1991;179:777–781. doi: 10.1148/radiology.179.3.2027991. [DOI] [PubMed] [Google Scholar]
- 6.Robson MD, Gatehouse PD, Bydder M, Bydder GM. Magnetic resonance: an introduction to Ultrashort TE (UTE) imaging. J Comput Assist Tomogr. 2003;27:825–846. doi: 10.1097/00004728-200311000-00001. [DOI] [PubMed] [Google Scholar]
- 7.Reichert ILH, Robson MD, Gatehouse PD, He T, Chappell KE, Holmes J, Girgis S, Bydder GM. Magnetic resonance imaging of cortical bone with ultrashort TE (UTE) pulse sequences. Magn Reson Imag. 2005;23:611–618. doi: 10.1016/j.mri.2005.02.017. [DOI] [PubMed] [Google Scholar]
- 8.Du J, Hamilton G, Takahashi A, Bydder M, Chung CB. Ultrashort TE spectroscopic imaging (UTESI) of cortical bone. Magn Reson Med. 2007;58:1001–1009. doi: 10.1002/mrm.21397. [DOI] [PubMed] [Google Scholar]
- 9.Du J, Takahashi A, Bydder M, Chung CB. Two dimensional ultrashort echo time imaging using a spiral trajectory. Magn Reson Imaging. 2008;26:304–312. doi: 10.1016/j.mri.2007.08.005. [DOI] [PubMed] [Google Scholar]
- 10.Rahmer J, Bornert P, Groen J, Bos C. Three-dimensional radial ultrashort echo-time imaging with T2 adapted sampling. Magn Reson Med. 2006;55:1075–1082. doi: 10.1002/mrm.20868. [DOI] [PubMed] [Google Scholar]
- 11.Techawiboonwong A, Song HK, Wehrli FW. In vivo MRI of submillisecond T2 species with two-dimensional and three-dimensional radial sequences and applications to the measurement of cortical bone water. NMR in Biomed. 2008;21:59–70. doi: 10.1002/nbm.1179. [DOI] [PubMed] [Google Scholar]
- 12.Pauly JM, Conolly SM, Macovski A. Suppression of long T2 components for short T2 imaging. Proceedings of the 10th Annual Meeting of SMRI; New York, USA. 1992; p. 330. [Google Scholar]
- 13.Sussman MS, Pauly JM, Wright GA. Design of practical T2-selective RF excitation (TELEX) pulses. Magn Reson Med. 1998;40:890–899. doi: 10.1002/mrm.1910400615. [DOI] [PubMed] [Google Scholar]
- 14.Larson PE, Gurney PT, Nayak K, Gold GE, Pauly JM, Nishimura DG. Designing long-T2 suppression pulses for ultrashort echo time imaging. Magn Reson Med. 2006;56:94–103. doi: 10.1002/mrm.20926. [DOI] [PMC free article] [PubMed] [Google Scholar]
- 15.Wu Y, Dai G, Ackerman JL, Hrovat MI, Glimcher MJ, Snyder BD, Nazarian A, Chesler DA. Water- and fat-suppressed proton projection MRI (WASPI) of rat femur bone. Magn Reson Med. 2007;57:554–567. doi: 10.1002/mrm.21174. [DOI] [PubMed] [Google Scholar]
- 16.Silver MS, Joseph RI, Hoult DI. Highly selective π/2 and π pulse generation. J Magn Reson. 1984;59:347–351. [Google Scholar]
- 17.Larson PE, Conolly SM, Pauly JM, Nishimura DG. Using adiabatic inversion pulses for long-T2 suppression in ultrashort echo time (UTE) imaging. Magn Reson Med. 2007;58:952–961. doi: 10.1002/mrm.21341. [DOI] [PMC free article] [PubMed] [Google Scholar]
- 18.Gold GE, Han E, Stainsby J, Wright G, Brittain J, Beaulieu C. Musculoskeletal MRI at 3.0T: relaxation times and image contrast. Am J Roentgenol. 2004;183:343–351. doi: 10.2214/ajr.183.2.1830343. [DOI] [PubMed] [Google Scholar]
- 19.Stanisz GJ, Odrobina EE, Pun JH, Escaravage M, Graham SJ, Bronskill MJ, Henkelman RM. T1, T2 relaxation and magnetization transfer in tissue at 3T. Magn Reson Med. 2005;54:507–512. doi: 10.1002/mrm.20605. [DOI] [PubMed] [Google Scholar]
- 20.Brittain JH, Shankaranarayanan A, Ramanan V, Shimakawa A, Cunningham CH, Hinks S, Francis R, Turner R, Johnson JW, Nayak KS, Tan S, Pauly JM, Bydder GM. Ultra-Short TE imaging with single-digit (8 microsecond) TE. Proceedings of the 12th Annual Meeting of ISMRM; Kyoto, Japan. 2004; p. 629. [Google Scholar]
- 21.Du J, Takahashi A, Chung CB. Ultrashort TE spectroscopic imaging (UTESI): Application to the Imaging of Short T2 Relaxation Tissues in the Musculoskeletal System. J Magn Reson Imaging. 2009;29:412–421. doi: 10.1002/jmri.21465. [DOI] [PubMed] [Google Scholar]
- 22.Filho GH, Du J, Pak BC, Statum S, Znamorowski R, Haghighi P, Bydder GM, Chung CB. Quantitative characterization of the Achilles tendon in cadaveric specimens: T1 and T2* measurements using ultrashort-TE MRI at 3T. AJR Am J Roentgenol. 2009;192:117–124. doi: 10.2214/AJR.07.3990. [DOI] [PubMed] [Google Scholar]
- 23.Jackson JI, Meyer CH, Nishimura DG, Macovski A. Selection of a convolution function for Fourier inversion using gridding. IEEE Trans Med Imaging. 1992;10:473–478. doi: 10.1109/42.97598. [DOI] [PubMed] [Google Scholar]
- 24.Balchandani P, Pauly J, Spielman D. Slice-selective tunable-flip adiabatic low peak-power excitation pulse. Magn Reson Med. 2008;59:1072–1078. doi: 10.1002/mrm.21540. [DOI] [PMC free article] [PubMed] [Google Scholar]
- 25.Bottomley PA. Spatial localization in NMR spectroscopy in vivo. Ann NY Acad Sci. 1987;508:333–326. doi: 10.1111/j.1749-6632.1987.tb32915.x. [DOI] [PubMed] [Google Scholar]
- 26.Wanspaura JP, Daniel BL, Pauly JM, Butts K. Temperature mapping of frozen tissue using eddy current compensated half excitation RF pulses. Magn Reson Med. 2001;46:985–992. doi: 10.1002/mrm.1285. [DOI] [PubMed] [Google Scholar]
- 27.Du J, Takahashi AM, Statum S, Biswas R, Chung CB, Bydder GM. Creating short-T2 contrast with three-dimensional ultrashort TE (3D UTE) imaging. Seventeenth Annual ISMRM; Hawaii, USA. 2009; p. P843. [Google Scholar]


