In the article “Protein Tyrosine Phosphatase α in the Dorsomedial Striatum Promotes Excessive Ethanol-Drinking Behaviors” by Sami Ben Hamida, Emmanuel Darcq, Jun Wang, Su Wu, Khanhky Phamluong, Viktor Kharazia, and Dorit Ron, which appeared on pages 14369–14378 of the September 4, 2013 issue, the authors would like to correct two errors in Figures 3 and 7.
Figure 3.
Figure 7.
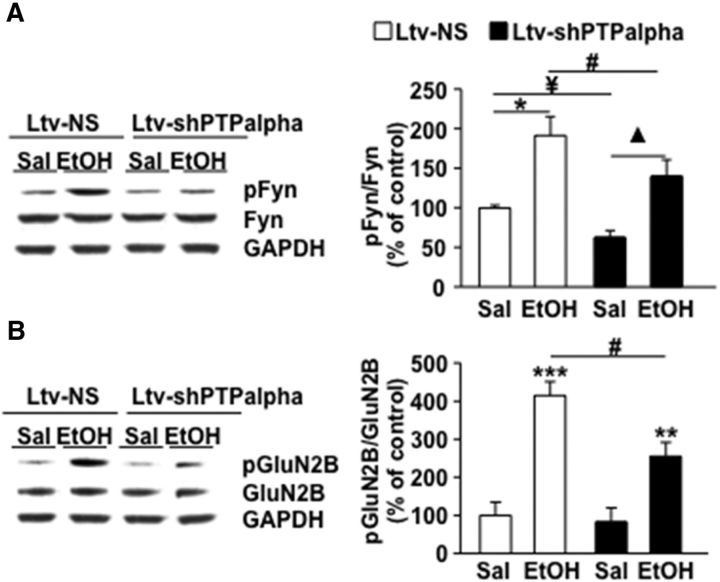
Ethanol-mediated Fyn activation and GluN2B-NMDAR phosphorylation in response to ethanol treatment and PTPα knockdown. Mice were infused with Ltv-NS or Ltv-shPTPα in the dorsomedial striatum, DMS. Four weeks after the virus infusion, animals were treated with an acute administration of saline (Sal) or ethanol (EtOH, 2.5 g/kg, i.p.) and the DMS was collected 15 min later. Anti-[pY418/420]Src/Fyn and anti-Fyn antibodies (A) and anti-[pY1472]GluN2B and anti-GluN2B antibodies (B) were used to detect the phosphorylated form and the total amount of Fyn and GluN2B. Optical density of immunoreactivity of the phosphorylated-protein bands was normalized to total protein and plotted as percentage of Ltv-NS/saline treatment. (A) *p < 0.001 Ltv-NS/EtOH versus Ltv-NS/Sal. ▴p < 0.001 Ltv-shPTPα/EtOH versus Ltv-shPTPα/Sal. ¥p < 0.001 Ltv-shPTPα/Sal versus Ltv-NS/Sal. #p = 0.05 Ltv-shPTPα/EtOH versus Ltv-NS/EtOH. (B) **p < 0.01, ***p < 0.001 versus Ltv-NS/Sal and #p < 0.05 versus Ltv-NS/EtOH. n = 8–10 for each group.
In Figure 3, the immunoblot image of Fyn was mistakenly embedded twice. The correct figure is shown below. The legend of Figure 3 and the interpretation of the data remain the same.
In Figure 7, the authors have identified an error in the quantification of the data described in Figure 7A. The corrected Figure 7 and the revised legend of Figure 7 are shown below. The description of Figure 7A in the Results section of the published article stated that “the increase in the activity of the kinase in response to ethanol was abolished in the DMS of mice infected with Ltv-shPTPα.” The correct analyses indicate that Fyn was activated by ethanol in both Ltv-shPTPα- and Ltv-NS-infected mice. A two-way ANOVA showed a main effect of Ethanol treatment (F(1,35) = 41.58, p < 0.001), a significant effect of Ltv-shPTPα infusion (F(1,35) = 11.36, p = 0.002), and no interactions between the factors (F(1,35) = 0.3, p = 0.59). Method of contrasts revealed that the increase in Fyn activation in response to ethanol treatment was lower in mice infected with Ltv-shPTPα than in mice infected with Ltv-NS (t(18) = 2.1, p = 0.05). There was also a significant decrease in the basal Fyn activation in saline-injected mice infected with Ltv-shPTPα compared with saline-injected mice infected with Ltv-NS (t(17) = 4.9, p < 0.001). Based on these statistical results, the reduction in ethanol-induced Fyn activation by Ltv-shPTPα can be due, in part, to the effect of the viral manipulation on the basal levels of Fyn activity. Thus, all instances of the phrase “ethanol-mediated Fyn activation” should be interpreted as “the level of Fyn activation after ethanol treatment.”


