Abstract
Here, we report results from a protein quantitative trait analysis in monocytes from 226 individuals to evaluate cross-talk between Alzheimer loci. We find that the NME8 locus influences PTK2B and that the CD33 risk allele leads to greater TREM2 expression. Further, we observe (1) a decreased TREM1/TREM2 ratio with a TREM1 risk allele, (2) decreased TREM2 expression with CD33 suppression, and (3) elevated cortical TREM2 mRNA expression with amyloid pathology.
Genetic association studies of late-onset Alzheimer’s disease (AD) have identified several susceptibility variants in loci harboring innate immune-related genes including CLU, CR1, CD33, EPHA1, MS4A4E/MS4A6A, PTK2B, TREM2 and TREML21–6. In addition, our group has recently uncovered common variants in TREM1 (rs6910730G) and TREM2 (rs7759295C) that are associated with increased AD pathology and cognitive decline7. The role of the innate immune system is further supported by (1) evidence implicating microglia and infiltrating monocytes/macrophages in the accumulation of amyloid pathology8–10, (2) the TYROBP (DAP12) microglial transcriptomic network associated with AD11, and (3) our recent work on the Immunological Variation (ImmVar) Project, which revealed that AD-associated loci regulate mRNA expression levels of nearby genes (i.e. are cis-expression quantitative trait loci, cis-eQTLs) in monocytes but not T cells12.
How these AD risk loci act to affect innate immune function and AD susceptibility is not yet clear. Large mRNA expression screens, such as the ImmVar Project, have provided a first evaluation of functional consequences12, but mRNA levels do not necessarily reflect protein levels and cannot identify post-translational effects on protein expression. To address this, we measured expression of TREM1, TREM2, TREML2, TYROBP, PTK2B and CD33 - six proteins expressed in monocytes that have been previously shown to be either (1) the target of an eQTL with an AD variant in cis (CD33, TREM1, PTK2B) or (2) important in AD (TREM2, TREML2, and TYROBP) - by flow cytometry in primary human monocytes from 115 younger, healthy subjects of the PhenoGenetic Project (PGP) at Brigham and Women’s Hospital as well as 61 older, cognitively non-impaired subjects from the Harvard Aging Brain Study (HABS) (Supplementary Table 1). We first analyzed previously reported cis-eQTLs at the protein level (cis-pQTLs) and then performed our primary investigation: identifying trans effects of 26 single nucleotide polymorphisms (SNPs) robustly associated with AD or AD neuropathology (Supplementary Table 2) on TREM1, TREM2, TREML2, TYROBP, PTK2B, and CD33 protein expression (trans-pQTLs). Thus, the scope of our discovery screen to identify novel effects in trans was highly targeted. For both cis and trans evaluations, we meta-analyzed the two datasets in a discovery phase and attempted to validate the most suggestive results (p<0.01 for trans associations) in an independent sample of 50 PGP subjects. A joint analysis (discovery + validation) was also performed to summarize all available data for the SNP:protein pairs that were validated. Details of the analysis method, including batch correction and normalization, can be found in the Online Methods Section.
Consistent with ImmVar data12, CD33, TREM1, TREM2, TREML2 and TYROBP were expressed predominantly by monocytes, while PTK2B was highly expressed by both lymphocytes and monocytes (Supplementary Fig. 1). In monocytes, we found strong positive correlations between the expression of intracellular proteins PTK2B and TYROBP (t175=5.57, pjoint=9.26×10⁻⁸) and cell surface molecules CD33 and TREM2 (t224=4.55, pjoint=8.83×10⁻⁶) (Supplementary Fig. 2).
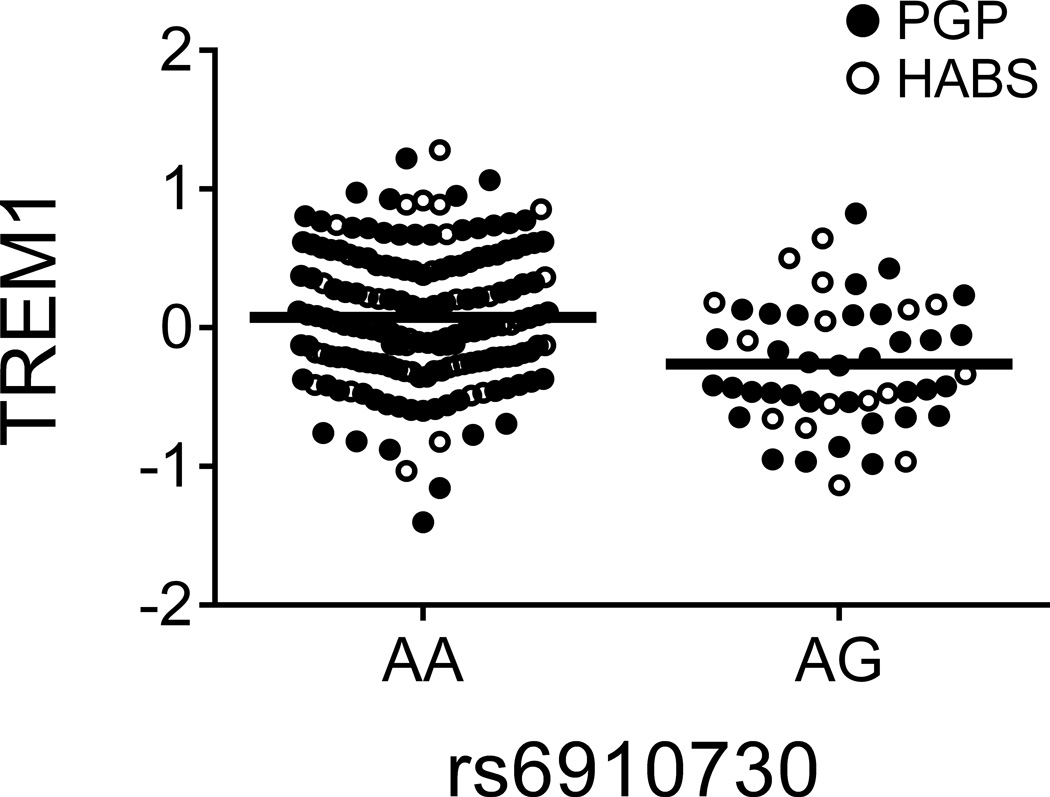
Evaluating previously reported associations, we noted the strong correlation between the TREM1 susceptibility allele rs6910730G and reduced TREM1 surface expression (zjoint=−4.05, pjoint=5.02×10⁻⁵; Table 1 and Fig. 1a), which we recently reported in a subset of the PGP discovery subjects7. We also confirmed the robust association of the CD33 rs3865444C risk allele with increased CD33 expression10 (zjoint=13.6, pjoint=3.12×10−42) and validated the rs28834970-PTK2B monocyte cis-eQTL12 at the protein level (zjoint=3.42, pjoint=6.36×10⁻⁴) (Table 1). These results are important in illustrating the properties of our dataset in which known effects of susceptibility loci are clearly observed and help to support the narrative that we have pursued in selecting the target genes in this study.
Table 1.
Summary of top pQTL effectsa
| SNP | Locus | Protein | Risk/Prot. Allele ↑↓b |
pdiscc | pval | pjointd | R2val |
|---|---|---|---|---|---|---|---|
| cis-pQTL | |||||||
| rs3865444 | CD33 | CD33 | C↑/A↓ | 6.53 × 10⁻³³ | 6.44 × 10⁻¹¹ | 3.12 × 10−42 | 0.60 |
| rs3826656e | CD33 | CD33 | G↑/A↓ | 7.00 × 10⁻⁶ | 0.045 | 9.25 × 10⁻⁷ | 0.094 |
| rs2627567f | TREM1 | TREM1 | A↓/C↑ | 5.36 × 10⁻⁶ | 0.044 | 6.89 × 10⁻⁷ | 0.082 |
| rs6910730 | TREM1 | TREM1 | G↓/A↑ | 2.87 × 10⁻³ | 2.47 × 10⁻³ | 5.02 × 10⁻⁵ | 0.17 |
| rs28834970 | PTK2B | PTK2B | C↑/T↓ | 0.017 | 5.33 × 10⁻³ | 6.36 × 10⁻⁴ | 0.16 |
| trans-pQTLg | |||||||
| rs3865444 | CD33 | TREM2 | C↑/A↓ | 1.60 × 10⁻³ | 0.011 | 6.69 × 10⁻⁵ | 0.13 |
| rs2718058 | NME8 | PTK2B | A↑/G↓ | 6.39 × 10⁻³ | 9.26 × 10⁻³ | 3.27 × 10⁻⁴ | 0.14 |
| rs10498633 | SLC24A4/RIN3 | TREM2 | G↑/T↓ | 8.18 × 10⁻³ | ---- | ---- | ---- |
| rs190982 | MEF2C | TREM1 | A↑/G↓ | 7.19 × 10⁻³ | ---- | ---- | ---- |
Complete results for the discovery phase can be found in Supplementary Table 3.
Arrow indicates direction of effect relative to the indicated allele.
Meta-analysis p-value for discovery phase (discovery PGP and HABS subjects combined).
Joint p-value combining discovery and validation phases.
Conditioned on rs3865444.
rs2627567 is not associated with AD (A is the reference allele).
Four trans-pQTLs met our threshold for attempting validation (p<0.01 in the discovery analysis), and only two were significant in the validation analysis after Bonferroni correction (P<0.013).
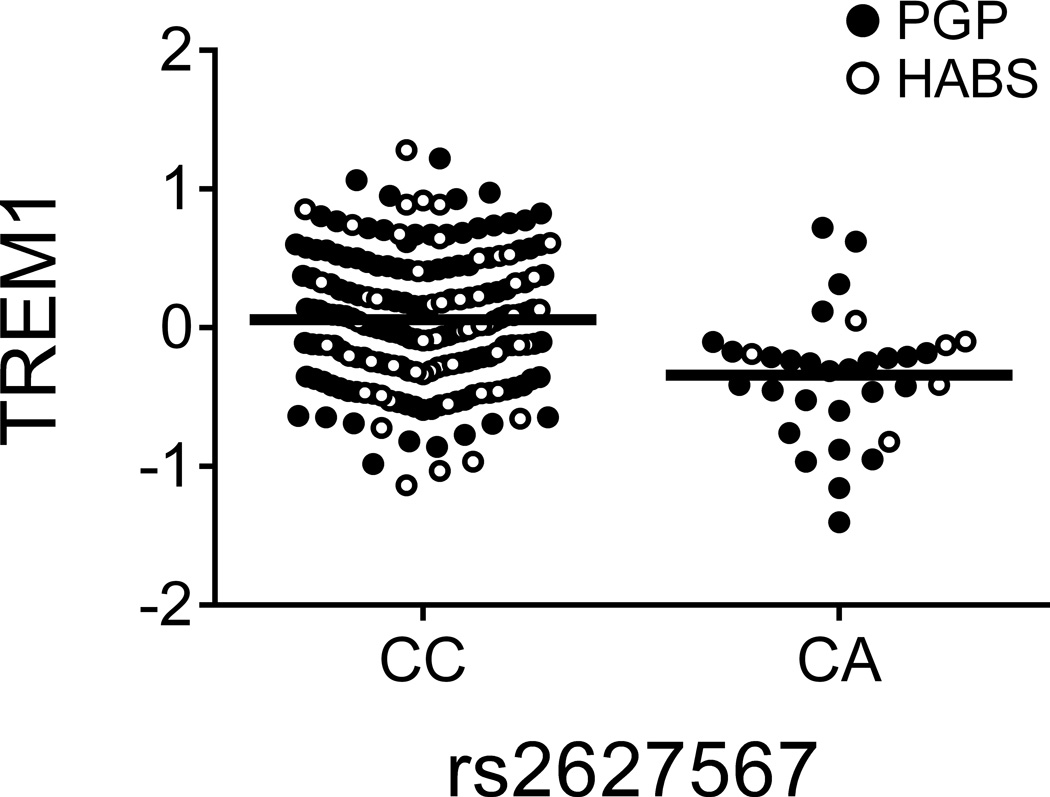
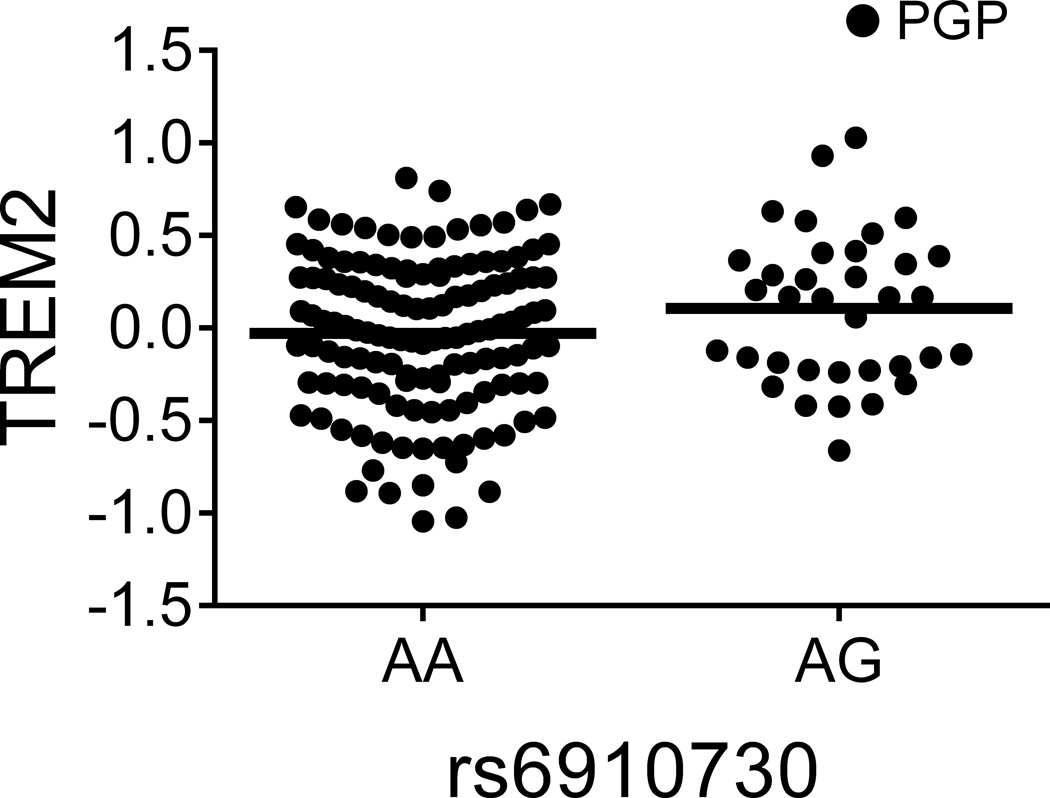
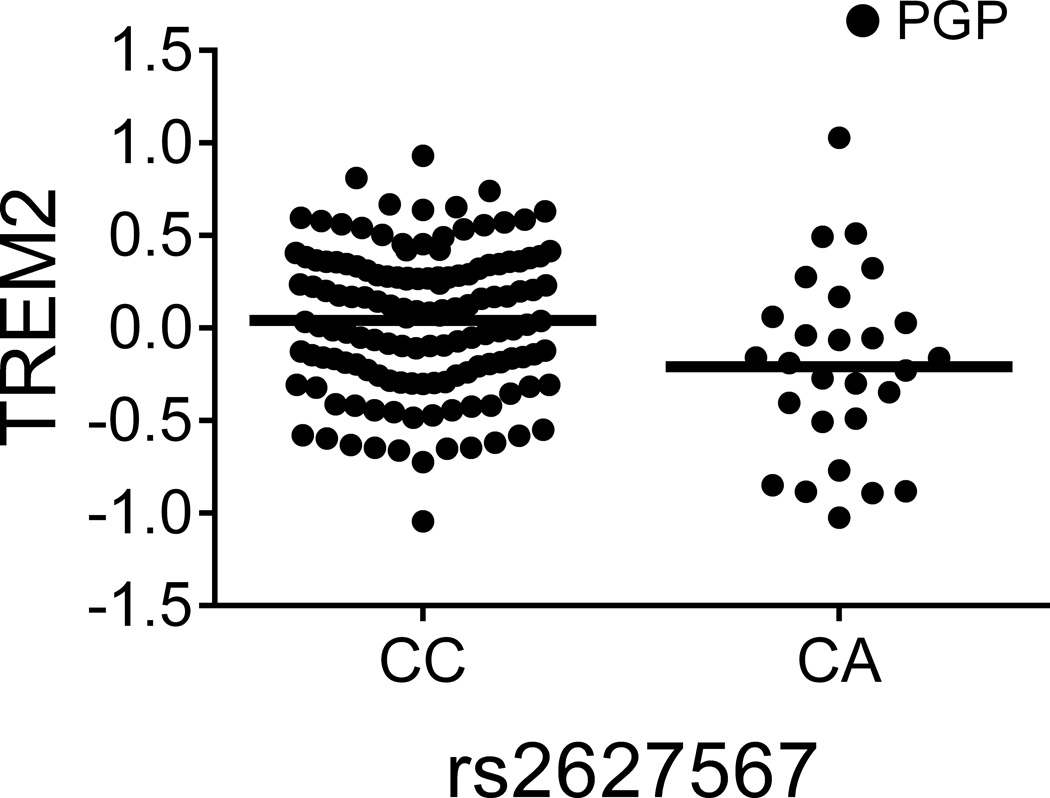
Figure 1. TREM1 association with AD may not be mediated by a simple reduction of TREM1 expression but by a balance of TREM1 and TREM2.
(a and b) The TREM1 AD-risk allele rs6910730G and the non-disease associated TREM1 allele rs2627567A are associated with lower TREM1 expression. (Note: two rs6910730 GG subjects are combined with the AG subjects). (c and d) Stratified analyses limited to the larger collection of PGP subjects (combining the discovery and replication PGP samples): rs6910730G is associated with an increase in TREM2 (whereas rs2627567A is associated with a decrease in TREM2), resulting in a greater reduction in the TREM1/TREM2 ratio than that caused by the reduction in TREM1 expression alone (Supplementary Fig. 3b). TREM1 and TREM2 surface expression on monocytes was quantified via flow cytometry; the y-axis represents normalized median fluorescence intensity (MFI) and the horizontal line denotes mean MFI. Each dot represents one individual from either the PGP (●) or HABS (○) cohort.
Having validated these associations, we next evaluated whether multiple cis-pQTLs exist within these loci. In the TREM1 locus, we found that rs2627567A decreased TREM1 surface expression (zjoint=−4.96, pjoint=6.89×10⁻⁷) independently from rs6910730G (Table 1 and Fig. 1b). Curiously, unlike rs6910730, rs2627567 is not associated with AD phenotypes in Religious Orders Study and Memory and Aging Project (ROS-MAP) subjects (Supplementary Table 4). Intrigued by this discrepancy, we evaluated the relation of these two SNPs to the ratio of TREM1 (a pro-inflammatory receptor13) to TREM2 (an anti-inflammatory receptor13), since both genes lie in the same locus and the inflammatory potential of a monocyte results from the balance of such competing forces. Interestingly, we found that the AD pathology risk allele rs6910730G was more strongly associated with a decreased TREM1/TREM2 ratio (zjoint=−4.47, pjoint=7.95×10⁻⁶) when compared to the non-AD associated SNP rs2627567 (zjoint=−2.54, pjoint=0.011) suggesting that the TREM1 association with AD may be mediated not by a simple reduction of TREM1 expression (in which case rs2627567 would be expected to influence AD pathology) but by influencing the balance of signaling molecules that affect myeloid activation. In an exploratory manner, we looked more carefully at our data and noted that the SNPs’ effect on the TREM1/TREM2 ratio was driven by the younger PGP subjects, as it is not seen in the smaller set of older HABS subjects (Supplementary Fig. 3a). Using all PGP subjects from the discovery and replication experiments, the AD pathology risk allele rs6910730G was associated with an increase in TREM2 (zPGP_meta=2.32, pPGP_meta=0.021; Fig. 1c), while the non-AD associated allele rs2627567A was associated with a decrease in TREM2 (zPGP_meta=−2.43, pPGP_meta=0.015; Fig. 1d). Thus, in younger PGP individuals, rs6910730G was more strongly associated with a decreased TREM1/TREM2 ratio (zPGP_meta=−5.19, pPGP_meta=2.08×10⁻⁷) when compared to the non-AD associated SNP rs2627567A (zPGP_meta=−1.88, pPGP_meta=0.061) (Supplementary Fig. 3b). These data suggest that while both SNPs affect TREM1 expression, they may have opposite, weaker effects on TREM2 expression leading to differences in the ratio of TREM1 to TREM2 in PGP. We did not see this effect on TREM2 and the TREM1/TREM2 ratio in our smaller set of older HABS subjects, and therefore additional data in both younger and older subjects are needed to further explore the possibility of an age-specific effect of this TREM1 variant. We also noted that TREM1 expression increased with advancing age in younger subjects (t162=3.35, pPGP_meta=9.98×10⁻⁴) but not in older subjects (t58=−1.37, pHABS=0.18), further suggesting that age may affect expression of genes from the TREM locus.
In the CD33 locus, conditioning on rs3865444 uncovered rs3826656A, which was associated with increased CD33 surface expression (zjoint=4.91, pjoint=9.25×10⁻⁷) (Table 1). This cis-pQTL, although weaker than rs3865444, was also observed in existing ROS-MAP data (t153=3.65, p=3.60×10⁻⁴) and at the mRNA level in existing ImmVar monocyte data (t209=−2.19, p=0.03)12. Interestingly, while rs3865444C and rs3826656A are both associated with increased CD33 expression, the two SNPs have contrasting associations with AD susceptibility6,10,14,15. It’s important to note that rs3865444C is associated with greater expression of the full-length CD33 isoform16, whereas the effect of rs3826656 on the different isoforms needs further characterization.
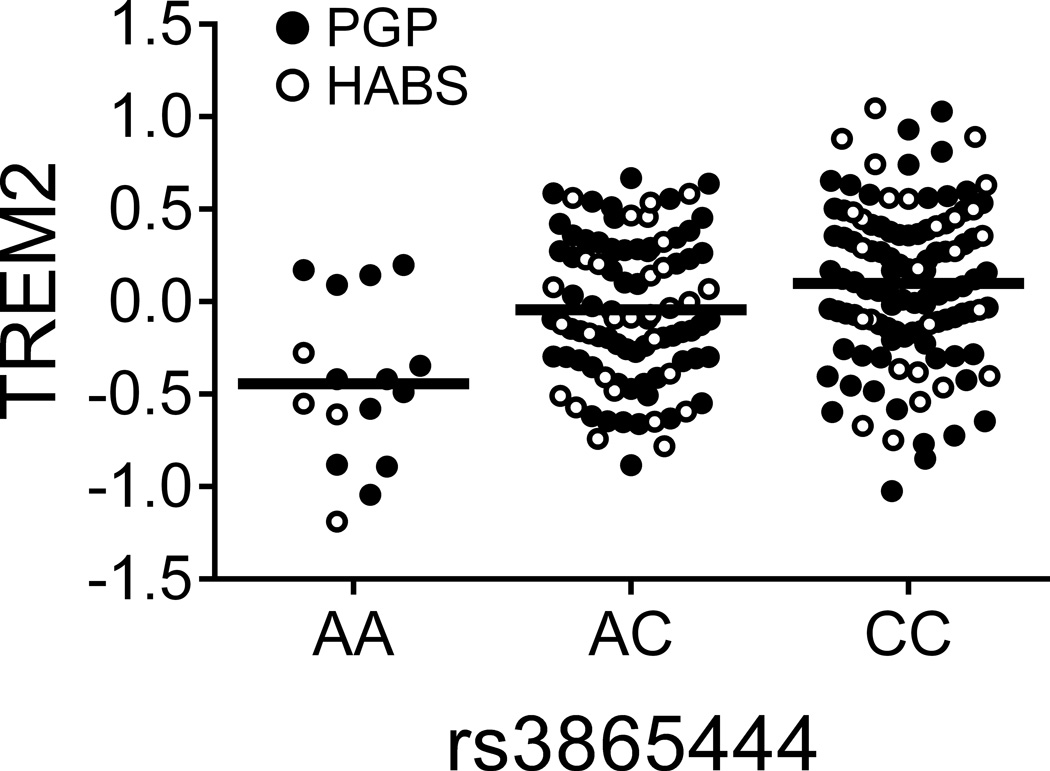
We then turned to our principal goal of identifying AD-associated trans-pQTLs. In the discovery phase, four loci displayed suggestive evidence of association in trans (p<0.01, Supplementary Table 3). We limited the validation effort to these four SNP:protein pairs, of which two validated after Bonferroni correction (Table 1). First, rs2718058A, an AD susceptibility allele in the NME8 locus, was associated with increased PTK2B expression (zdisc_meta=2.73, pdisc_meta=6.39×10⁻³), which was subsequently validated ((zval=2.60, pval=9.26×10⁻³), (zjoint=3.59, pjoint=3.27×10⁻⁴)). The direction of effect in relation to AD risk is consistent with that of the PTK2B cis-pQTL above, where the risk allele rs28834970C is also associated with greater PTK2B. Second, the primary CD33 risk allele rs3865444C was associated with greater TREM2 surface expression in both the discovery (zdisc_meta=3.16, pdisc_meta=1.6×10⁻³) and validation phases ((zval=2.55, pval=0.011), (zmeta=3.99, pjoint=6.69×10⁻⁵); Table 1 and Fig. 2a). Adjusting for CD33 surface expression in this model reduced the association of rs3865444 with TREM2 expression by 80% in PGP and 75% in HABS suggesting that the SNP’s relationship to TREM2 is mediated by the surface expression of CD33. Interestingly, the NME8 and CD33 trans-pQTLs were not observed at the mRNA level12 (although it is possible that the 211 European American subjects of the ImmVar Project were insufficient to detect these associations). This suggests that their effects on PTK2B and TREM2, respectively, are not mediated by altering transcription, thus highlighting the importance of protein-level characterization in QTL studies. While the validation p-values are modest because of our sample size, the effect of these SNPs on protein expression is tangible: in the validation data, the NME8 variant explains 15% of the variance in PTK2B expression while the CD33 variant explains 14% of the variance in TREM2 surface expression.
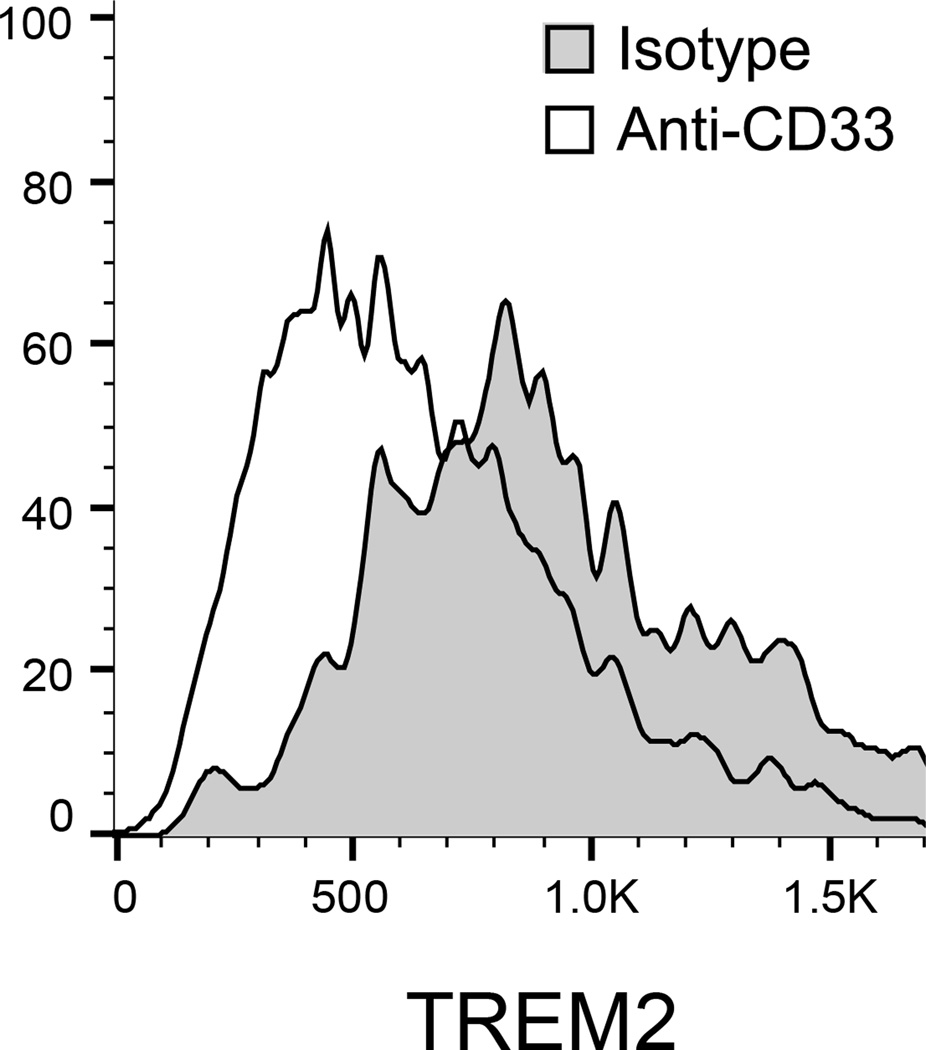
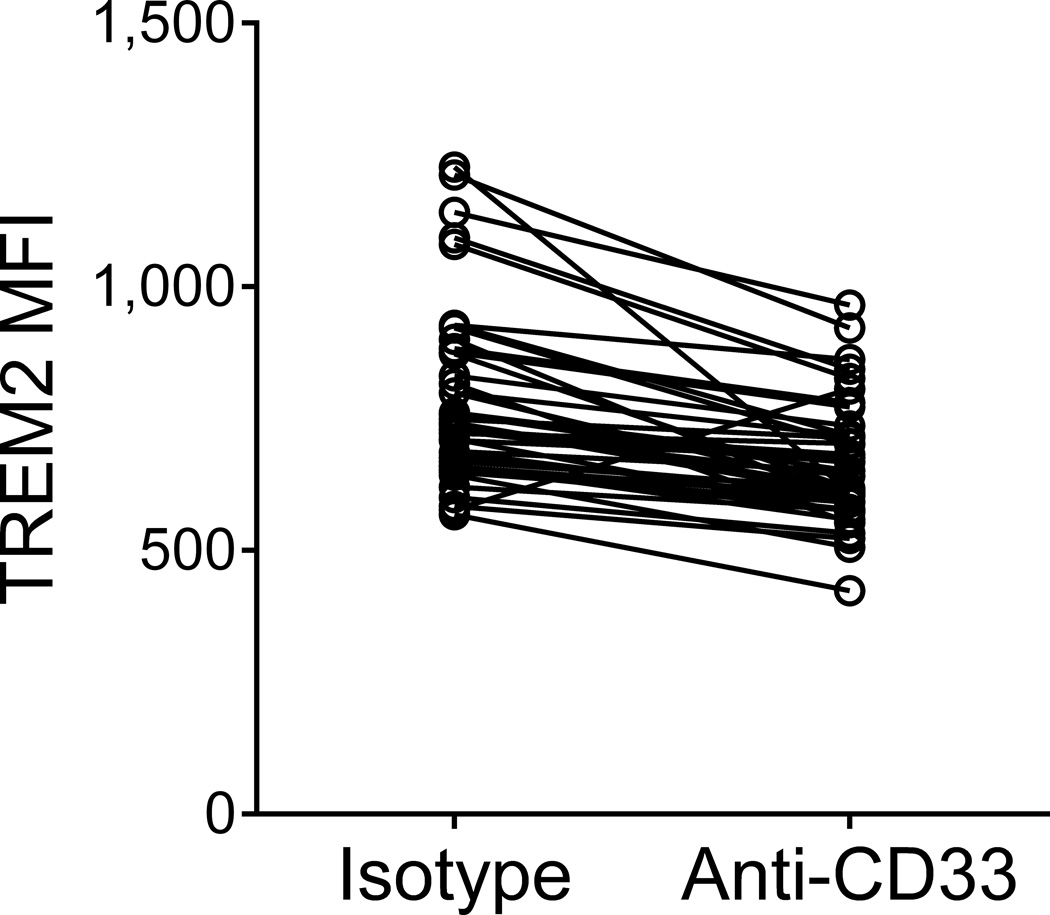
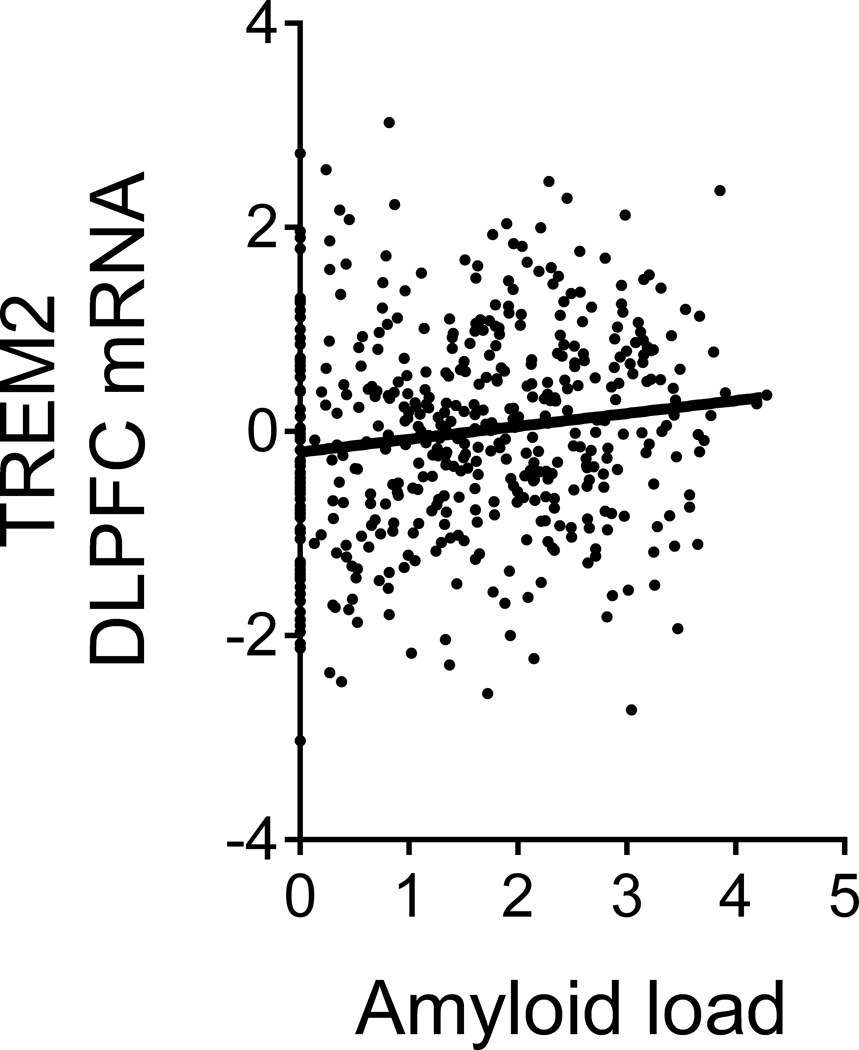
Figure 2. CD33 modulates TREM2 surface expression.
(a) The CD33 risk allele rs3865444C, which is associated with increased CD33 expression, was also associated with increased TREM2 surface expression on monocytes. TREM2 was quantified via flow cytometry; the y-axis represents normalized MFI and the horizontal line denotes mean MFI. (b) Representative histogram of TREM2 expression on monocytes from one subject; in the presence of the anti-CD33 antibody (Ab), the distribution of TREM2 staining shifts left when compared to monocytes treated with non-specific isotype control Ab. (c) TREM2 MFI of monocytes treated with anti-CD33 Ab decreases compared to monocytes treated with isotype control Ab. Lines connect paired samples for each individual. (d) TREM2 mRNA expression in dorsolateral prefrontal cortex tissue in relation to amyloid load. The y-axis represents mRNA expression values log2 transformed and normalized. Each data point represents one individual.
To further validate and probe the effect of CD33 on TREM2 expression, we suppressed CD33 signaling with an anti-CD33 antibody in primary monocytes from 24 PGP subjects and observed a decrease in TREM2 surface expression compared to the isotype control (t23=−11.0, p=1.23×10⁻¹⁰). This result was replicated in an additional 19 subjects ((t18=−4.66, prep=1.93×10⁻⁴), (zmeta=−7.29, pjoint=3.20×10⁻¹³); Fig. 2b and 2c), supporting our pQTL analysis and demonstrating that the protein levels of CD33 and TREM2 are linked and that TREM2 may lie downstream of CD33.
Given the positive association of CD33 expression level with amyloid burden10 and TREM2, we examined the relationship between TREM2 and AD pathology in ROS-MAP data and found that increased TREM2 mRNA expression in the dorsolateral prefrontal cortex of ROS-MAP subjects was associated with greater amyloid load (t487=3.08, p=2.23×10⁻³; Fig. 2d) as well as a pathologic diagnosis of AD (z=2.58, p=9.86×10⁻³). Conditioning on amyloid burden abolished the association of TREM2 mRNA with an AD diagnosis (z=0.38, p=0.70), suggesting that the association of TREM2 expression with AD may be mediated by accumulation of amyloid pathology, as is the case for CD3310.
Our study measuring cis- and trans-pQTLs in primary human monocytes begins to map the effects of AD susceptibility variants as they converge at the protein level to alter innate immune function and affect disease susceptibility. To test the robustness of the joint meta-analysis, we also derived empirical p-values by permuting genotypes 10,000 times (p̂=1.3×10⁻³ for NME8:PTK2B and p̂=9×10⁻⁴ for CD33:TREM2). Even when we account for all 156 SNP:protein combinations tested in the discovery study using a False Discovery Rate approach, we find that NME8:PTK2B (q-value=0.039) and CD33:TREM2 (q-value=0.033) are likely to be true positive results. Additionally, although our sample size was limited due to practical difficulties in accumulating viable frozen cells from large numbers of genotyped human subjects, we were still able to detect and validate the reported effects. Larger sample sizes would increase our power to validate additional cis-eQTLs at the protein level and to detect more modest SNP:protein associations in our dataset that could not be detected with our current sample size. We illustrate our most interesting findings in Supplementary Fig. 4.
Although the rare TREM2 R47H mutation is known to confer high risk for AD3,17, TREM2’s exact role in the disease is still unclear. Several murine studies suggest a beneficial role for TREM2 in reactive microgliosis18, suppressing inflammation18,19, and promoting phagocytosis of amyloid beta and apoptotic neurons17,19. However, a recent study demonstrated that TREM2 loss-of-function in an AD mouse model reduced brain inflammation and pathology, which was coincident with a significant reduction of monocyte-derived macrophages in the brain20. Consistent with this latter study, our results reporting an association of the CD33 AD risk allele with increased TREM2, as well as higher cortical TREM2 RNA expression with increasing amyloid pathology, support a pathogenic role for increased TREM2 expression by peripherally-derived myeloid cells in AD susceptibility. Overall, our results (1) lay the groundwork for future mechanistic studies determining the molecular/signaling mechanisms underlying the CD33:TREM2 and NME8:PTK2B trans associations as well as the functional relevance of these relationships in human macrophages and microglia present at the site of pathology, (2) guide modeling of AD susceptibility networks, (3) identify potential blood-derived biomarkers, and (4) inform the future design of therapeutic strategies (such as those targeting CD33 and TREM2) to modulate the immune system to prevent AD.
Online Methods
Study subjects
Informed consent was obtained from all human subjects. All blood draws, brain autopsies, experiments and data analysis were done in compliance with protocols approved by the Partners Human Research Committee and the Rush University Institutional Review Board.
PhenoGenetic Project (PGP)
Our study takes advantage of data and peripheral blood samples from healthy subjects in the PhenoGenetic Project at Brigham and Women’s Hospital. The PGP was launched as a living biobank that provides a source of fresh and frozen biological samples derived from peripheral blood, urine and saliva of genotyped human subjects. 1,753 healthy subjects >18 years old have been recruited from the general population of Boston. The subjects are of diverse ethnicities (29% are non-Caucasian) and are 62.7% women. All subjects used for pQTL analyses were of European ancestry (n=165), as determined from principal components derived from genome-wide genotype data using EIGENSTRAT.
Harvard Aging Brain Study (HABS)
The HABS is a prospective study on cognitively non-impaired older subjects where the overall goal is to determine whether healthy individuals with increases in brain amyloid are in the prodromal stages of AD. For the study, participants, aged 65–90, come in for routine clinical and neuroimaging phenotyping as well as blood sampling; a detailed description of the study has been previously reported10. In total, 276 subjects are enrolled in the study and 161 are genotyped. The subjects are of diverse ethnicities (19% are non-Caucasian) and are 59.4% women. All subjects used for pQTL analyses were of European ancestry (n=61), as determined from principal components derived from genome-wide genotype data using EIGENSTRAT.
Religious Orders Study (ROS) and Memory and Aging Project (MAP)
ROS and MAP are prospective studies of aging where study participants are cognitively normal at enrollment, agree to annual clinical evaluations and have signed an Anatomic Gift Act donating their brains at the time of death. Each subject undergoes a detailed quantitative neuropathological examination, detailed ante-mortem clinical and neuropsychological profiling, and banking of peripheral blood mononuclear cells. The follow-up rate of survivors exceeds 90% and the autopsy rate exceeds 80%. A further description of ROS and MAP can be found elsewhere21–23. All subjects used for CD33 surface expression analysis (n=151) and TREM2 RNA analysis from the dorsolateral prefrontal cortex (n=489) were of European ancestry, as determined from principal components derived from genome-wide genotype data using EIGENSTRAT.
Genotyping
PGP and HABS subjects were genotyped from whole blood DNA using the Illumina Infinium HumanOmniExpressExome BeadChip Kit (San Diego, CA) and the Affymetrix Axiom Biobank Genotyping Array (Santa Clara, CA), respectively. In short, EIGENSTRAT v3.0 was used to identify population outliers, which were discarded. The BEAGLE software (version: 3.3.2) was used to impute the post-QC genotyped markers using reference Haplotype panels from the 1000 Genomes Project Consortium Phase I Integrated Release Version 3 (for PGP) or Version 1 (for HABS). These methods are described in detail elsewhere12.
In ROS-MAP, DNA was extracted from whole blood or frozen post-mortem brain tissue. Genotype data was generated using the Affymetrix Genechip 6.0 platform at the Broad Institute’s Genetic Analysis Platform or the Translational Genomics Research Institute, as previously described24. In short, data underwent quality control analyses using the PLINK toolkit (http://pngu.mgh.harvard.edu/~purcell/ plink/) and quality controlled genotypes were pooled. The quality control process included a principal components analysis using default parameters in EIGENSTRAT to identify and remove population outliers. Imputation in ROS-MAP was performed using MACH software (version 1.0.16a) and HapMap release 22 CEU (build 36).
Flow Cytometry
For staining, frozen peripheral blood mononuclear cells (PBMCs) from each subject were thawed, washed, counted using the Cellometer Auto 2000 Cell Viability Counter (Nexcelom Bioscience, Lawrence, MA), pre-treated with Fc receptor block (BioLegend, San Diego, CA) and double-stained according to the manufacturer’s recommendations in the following combinations: (1) FITC-CD33 antibody (clone AC104.3E3) (Miltenyi Biotec, Auburn, CA) with either APC-TREM1 antibody (clone TREM-26) (BioLegend), APC-TREM2 antibody (clone 237920) (R&D, Minneapolis, MN (for specificity see http://www.rndsystems.com/Products/FAB17291A and Jay et al.20)) or PE-TREML2 antibody (MIH61) (BioLegend) and (2) PE-CD33 antibody (clone AC104.3E3) (Miltenyi Biotec) with unconjugated PTK2B antibody (clone 9H12L1) (Life Technologies, Carlsbad, CA) followed by Alexa Fluor 647 goat anti-rabbit secondary antibody (Life Technologies). Cells were also single-stained with unconjugated TYROBP antibody (clone 406288) (R&D) followed by APC goat anti-mouse secondary (R&D). For intracellular staining (PTK2B and TYROBP), PBMCs were permeabilized with 0.1% saponin (Sigma, St. Louis, MO). Following staining with antibodies, cells were subsequently washed, fixed in 4% paraformaldehyde (Electron Microscopy Sciences, Hatfield, PA) and analyzed within 24 hours. Data was collected on a FACS Calibur flow cytometer (BD Biosciences, San Jose, CA) or MACSQuant Analyzer (Miltenyi Biotec) and compensated and analyzed using FlowJo software (TreeStar Inc., Ashland, OR). Staining was performed in batches of 11–12 subjects and monocytes were gated based on forward-side scatter analysis or CD33-postive staining.
RNA-sequencing
RNA was isolated from frozen dorsolateral prefrontal cortex tissue of ROS-MAP subjects using the miRNeasy Mini Kit and RNase-Free DNase Set (Qiagen, Germantown, MD). RNA concentration and quality were determined using a Nanodrop (Thermo Fisher Scientific, Wilmington, DE) and Bioanalyzer (Agilent Technologies, Santa Clara, CA), respectively. Only samples with a RIN score >5 were used for library construction, which was assembled using the strand-specific dUTP method. The library was read using Illumina HiSeq with 101 base pair paired-end reads and a goal coverage of >85 million paired-end reads.
CD33 suppression studies
Monocytes were negatively isolated from PBMCs using the Monocyte Isolation Kit II (Miltenyi Biotec) and plated at 100,000 cells/well in 96-well round-bottom polypropylene plates with RPMI 1640-GlutaMax™ (Life Technologies), containing 10% FBS (Corning), 100 units/ml penicillin (Lonza), 100 µg/ml streptomycin (Lonza), 2.5 µg/ml fungizone (Life Technologies) and either 10 µg/ml LEAF purified anti-CD33 antibody (clone WM53) (BioLegend) or isotype control (BioLegend). Control media without antibody was also used as a negative control. Clone WM53 was chosen because it has been previously shown to suppress CD33 inhibition of inflammatory cytokine secretion25. Monocytes were cultured for 48 hours after which they were washed and stained with Violet LIVE/DEAD Fixable Stain (Life Technologies), FITC-CD33 antibody (clone AC104.3E3) (Miltenyi Biotec) and APC-TREM2 antibody (clone 237920) (R&D). Cells were fixed in 4% paraformaldehyde and analyzed by flow cytometry. Subjects used for these studies were of European (n=22), African American (n=10), East Asian (n=9) and mixed Asian/European ancestry (n=2).
Statistical analysis
In summary, 26 SNPs were selected for the study (see Supplementary Table 2 for the complete list and associated references); these SNPs were (1) previously identified and/or validated in a meta-analysis of AD GWAS published by Lambert et al., (2) found to have significant association with AD-related phenotypes (meeting genome-wide/Bonferroni significance), or (3) identified to have a significant cis-eQTL in monocytes (meeting Bonferroni significance). For the discovery phase, we limited our analysis to the 156 SNP:protein pairs (26 SNPs × 6 proteins) and created a p≤0.01 cut-off to identify suggestive trans-pQTL results. Four SNP:protein pairs met this threshold and were followed up in the validation phase leaving a Bonferroni significance threshold of p≤0.013 (p=0.05/4) to identify statistically-significant trans associations. A threshold of genome-wide significance, while critical in the gene discovery phase conducted by consortia of investigators to identify robust AD susceptibility loci to account for the millions of tested SNPs, is overly conservative and not appropriate in the type of follow-on functional study presented here, in which we take selected, validated susceptibility variants and conduct experiments to understand their functional consequences. Instead, we correct for the number of hypotheses being tested in the study.
Protein expression data was gathered in a series of five experiments, each consisting of 3–6 batches of 7–12 subjects/batch. European subjects were chosen randomly from available samples. The discovery dataset consisted of 176 unique subjects assayed over four experiments. Two of the experiments assayed samples from the PGP cohort (n=49, n=66) and the other two experiments assayed samples from the HABS cohort (n=31, n=30). An additional 50 unique subjects from the PGP cohort comprised the validation data set and were assayed in a single experiment. Each experiment was analyzed separately prior to being combined into a meta-analysis. In order to reduce undue influence of outliers and approximate a normal distribution within each experiment, expression levels were rank-based inverse normalized using Equation 1. rijk is the rank, Njk is the sample size, and Yijk is the expression level, where i indexes the subject, j indexes the experiment and k indexes the protein.
| Equation 1 |
After normalizing expression data, we performed linear regression for each SNP-protein pair, after first adjusting for batch using an Empirical Bayes priors distribution estimation framework (Combat version 2.0) available in the sva R package26. Within this regression, we set expression as the dependent variable and SNP as the independent variable, controlling for possible confounders such as age, sex, and cell viability. The t-statistics of each SNP-protein pair from the linear regressions of the discovery experiments were then meta-analyzed using the weighted-Z method as written in Equation 2, which is commonly used in meta-analysis in the GWAS setting27, to produce discovery stage p-values. The validation experiment was similarly analyzed, producing validation stage p-values for those SNP:protein pairs selected at the end of the discovery analysis. The final joint analysis p-value (discovery plus validation) was the result of a meta-analysis of all five experiments - four discovery and one validation. Additionally, to derive empirical p-values for the joint meta-analysis, we permuted genotypes 10,000 times. Conditional SNP analyses were performed in a similar manner, where the linear regression was also adjusted for the conditional SNP. To calculate the effect of anti-CD33 antibody on TREM2 expression, a paired t-test on raw median fluorescence intensity (MFI) values based on live cell gating was applied to compare isotype and anti-CD33 conditions. To object a joint p-value combining the primary experiment and its replication, the weighted-Z meta-analysis method was used (Equation 2).
In secondary analyses (e.g. analysis of co-expression, regressions conditional on expression, or reported effect estimates) the effects of batch and cell viability were removed from protein levels prior to analysis. To accomplish this, data from all experiments were collapsed into a single data set, expression levels were rank-based inverse normalized, and then adjusted for batch (23 in total) with Combat. Finally, expression levels were regressed against cell viability to produce analysis-ready residuals. For visual representation of the data in Figures 1 and 2 and Supplementary Figure 3, batch adjusted residuals for PGP and HAB were created independently prior to plotting.
In the ROSMAP RNA-seq analysis, expression levels were obtained after applying a series of QC measures. FPKM (Fragments per Kilobase of Exon Per Million Fragments Mapped) were first quantile normalized with Combat correcting for batch. Then, to obtain analysis ready residuals, log2(Combat adjusted FPKM) values were then regressed against RIN score, log2(total aligned reads), post-mortem interval, age, sex, cohort (ROS/MAP), genotyped PCs, and genotyping platform. Finally, residuals were rank-based inverse normalized. Amyloid and TREM2 were analyzed with linear regression, while pathological AD and TREM2 were analyzed with logistic regression. All analyses were conducted in R (version 3.0.2) and graphed in GraphPad Prism 6. A supplementary methods checklist is available.
| Equation 2 |
Supplementary Material
Acknowledgements
The authors are grateful to the participants of PGP, HABS, ROS and MAP for the time and specimens that they contributed. This work was supported by the US National Institutes of Health grants R01 AG036836, R01 AG048015, R01 AG043617, P01 AG036694, P30 AG10161, R01 AG15819, R01 AG17917, and U01 AG46152.
Glossary
- Prot.
Protective
- pdisc
discovery p-value
- pval
validation p-value
- pjoint
joint p-value (meta-analysis of discovery and validation data)
- R2val
proportion of variance in the target protein’s expression explained by the selected SNP in the validation data.
Footnotes
Author Contributions
G.C, P.L.D. and E.M.B. designed and implemented the study and wrote the manuscript. G.C. planned and conducted the experiments with technical assistance from P.A.W., M.C. and K.J.R. C.C.W., J.M.R., L.B.C. and G.C. performed statistical analyses and assisted with the interpretation of results. P.L.D., L.R.G. and N.E.C. coordinated the collection of blood from PGP. R.A.S. and K.A.J. provided blood samples and genetic data from HABS. J.A.S. and D.A.B. contributed clinical, genetic and post-mortem data from ROS-MAP. P.L.D. coordinated access to all of the cohorts. All authors contributed to the review of the manuscript.
References
- 1.Hollingworth P, et al. Nat. Genet. 2011;43:429–435. doi: 10.1038/ng.803. [DOI] [PMC free article] [PubMed] [Google Scholar]
- 2.Cruchaga C, et al. Neuron. 2013;78:256–268. doi: 10.1016/j.neuron.2013.02.026. [DOI] [PMC free article] [PubMed] [Google Scholar]
- 3.Guerreiro R, et al. New Engl. J. Med. 2013;368:117–127. doi: 10.1056/NEJMoa1211851. [DOI] [PMC free article] [PubMed] [Google Scholar]
- 4.Lambert JC, et al. Nat. Genet. 2013;45:1452–1458. doi: 10.1038/ng.2802. [DOI] [PMC free article] [PubMed] [Google Scholar]
- 5.Benitez BA, et al. Neurobiol. Aging. 2014;35:1510.e19–1510.e26. doi: 10.1016/j.neurobiolaging.2013.12.010. [DOI] [PMC free article] [PubMed] [Google Scholar]
- 6.Naj AC, et al. Nat. Genet. 2011;43:436–441. doi: 10.1038/ng.801. [DOI] [PMC free article] [PubMed] [Google Scholar]
- 7.Replogle JM, et al. Ann. Neurol. 2015;77:469–477. doi: 10.1002/ana.24337. [DOI] [PMC free article] [PubMed] [Google Scholar]
- 8.Lee CYD, Landreth GE. J. Neural Transm. 2010;117:949–960. doi: 10.1007/s00702-010-0433-4. [DOI] [PMC free article] [PubMed] [Google Scholar]
- 9.Mildner A, et al. J. Neurosci. 2011;31:11159–11171. doi: 10.1523/JNEUROSCI.6209-10.2011. [DOI] [PMC free article] [PubMed] [Google Scholar]
- 10.Bradshaw EM, et al. Nat. Neurosci. 2013;16:848–850. doi: 10.1038/nn.3435. [DOI] [PMC free article] [PubMed] [Google Scholar]
- 11.Zhang B, et al. Cell. 2013;153:707–720. doi: 10.1016/j.cell.2013.03.030. [DOI] [PMC free article] [PubMed] [Google Scholar]
- 12.Raj T, et al. Science. 2014;344:519–523. doi: 10.1126/science.1249547. [DOI] [PMC free article] [PubMed] [Google Scholar]
- 13.Klesney-Tait J, Turnbull IR, Colonna M. Nat. Immunol. 2006;7:1266–1273. doi: 10.1038/ni1411. [DOI] [PubMed] [Google Scholar]
- 14.Bertram L, et al. Am. J. Hum. Genet. 2008;83:623–632. doi: 10.1016/j.ajhg.2008.10.008. [DOI] [PMC free article] [PubMed] [Google Scholar]
- 15.Yuan Q, Chu C, Jia J. Neurol. Sci. 2012;33:1021–1028. doi: 10.1007/s10072-011-0881-0. [DOI] [PubMed] [Google Scholar]
- 16.Raj T, et al. Hum. Mol. Genet. 2014;23:2729–2736. doi: 10.1093/hmg/ddt666. [DOI] [PMC free article] [PubMed] [Google Scholar]
- 17.Kleinberger G, et al. Sci. Transl. Med. 2014;6:243ra86. doi: 10.1126/scitranslmed.3009093. [DOI] [PubMed] [Google Scholar]
- 18.Wang Y, et al. Cell. 2015;160:1061–1071. doi: 10.1016/j.cell.2015.01.049. [DOI] [PMC free article] [PubMed] [Google Scholar]
- 19.Jiang T, et al. Neuropsychopharmacology. 2014;39:2949–2962. doi: 10.1038/npp.2014.164. [DOI] [PMC free article] [PubMed] [Google Scholar]
- 20.Jay TR, et al. J. Exp. Med. 2015;212:287–295. doi: 10.1084/jem.20142322. [DOI] [PMC free article] [PubMed] [Google Scholar]
- 21.Bennett DA, et al. Neuroepidemiology. 2005;25:163–175. doi: 10.1159/000087446. [DOI] [PubMed] [Google Scholar]
- 22.Bennett DA, et al. Curr. Alzheimer Res. 2012;9:646–663. doi: 10.2174/156720512801322663. [DOI] [PMC free article] [PubMed] [Google Scholar]
- 23.Bennett DA, Schneider JA, Arvanitakis Z, Wilson RS. Curr. Alzheimer Res. 2012;9:628–645. doi: 10.2174/156720512801322573. [DOI] [PMC free article] [PubMed] [Google Scholar]
- 24.De Jager PL, et al. Neurobiol. Aging. 2012;33:1017.e1–1017.e15. doi: 10.1016/j.neurobiolaging.2011.09.033. [DOI] [PMC free article] [PubMed] [Google Scholar]
- 25.Lajaunias F, Dayer J-M, Chizzolini C. Eur. J. Immunol. 2005;35:243–251. doi: 10.1002/eji.200425273. [DOI] [PubMed] [Google Scholar]
- 26.Leek JT, Johnson WE, Parker HS, Jaffe AE, Storey JD. Bioinformatics. 2012;28:882–883. doi: 10.1093/bioinformatics/bts034. [DOI] [PMC free article] [PubMed] [Google Scholar]
- 27.Willer CJ, Li Y, Abecasis GR. Bioinformatics. 2010;26:2190–2191. doi: 10.1093/bioinformatics/btq340. [DOI] [PMC free article] [PubMed] [Google Scholar]
Associated Data
This section collects any data citations, data availability statements, or supplementary materials included in this article.


