Abstract
Background and study aims: No studies have looked at the quality of cecal images versus the outcomes of colonoscopic procedures. Here, we tested our hypothesis that endoscopists who provide better image documentation of the cecum during their procedures have a higher polyp detection rate (PDR).
Patients and methods: In this retrospective study, planned colonoscopies performed by 16 experienced colonoscopists were included. We formulated a new scoring system, the cecal image documentation score (CIDS), for quantifying the quality of the cecal images obtained at colonoscopy. Cecal image documentation was graded as follows: no image, 0; unclear image, 1; clear image, 2; clear image with a label, 3. We assessed the correlation between image quality and the PDR.
Results: A total of 651 procedures performed by 16 colonoscopists were analyzed retrospectively. The mean CIDS for the 16 endoscopists was 2.13. The mean PDR was 23.5 %, and the mean polyps per procedure value (PPP) was 0.42. The 10 colonoscopists with a mean CIDS > 2.0 (n = 429 procedures) had a PDR of 27.8 % and a PPP of 0.51. On the other hand, the 6 colonoscopists (n = 222 procedures) with a mean CIDS < 2.0 had a PDR of 15.2 % and a PPP of 0.23. A mean CIDS > 2.0 was associated with a higher PDR (odds ratio [OR] 2.1, 95 % confidence interval [CI] 1.4 – 3.2, P = 0.001). A mean CIDS > 2.0 was found to be an independent predictor of a higher PDR (OR 2.53, 95 %CI 1.45 – 3.59, P = 0.001). A mean CIDS > 2.0 was also associated with a higher right-sided PDR (OR 3.67, 95 %CI 1.91 – 7.02, P < 0.001).
Conclusions: Colonoscopists who are more meticulous in cecal image documentation detect more polyps per procedure and have higher PDRs. Better cecal image documentation is also associated with better right-sided colonic polyp detection.
Introduction
Adenoma detection is now accepted as an important indicator of the quality of colonoscopy. There is a significant variation in polyp detection rates (PDRs) among colonoscopists 1 2. The rates of image documentation of the cecum in colonoscopy can also be variable, between 81 % and 98 % in large studies 3 4. The European Society of Gastrointestinal Endoscopy (ESGE) has made recommendations regarding the quality and number of images, including cecal images, taken during endoscopy 5; however, no studies have looked at the quality of cecal images versus outcomes of the procedures. The primary objective of this study was to test our hypothesis that colonoscopists who are more meticulous about image documentation of the cecum during their procedures detect more polyps.
Methods
This retrospective study was performed at a teaching hospital. We collected data from our endoscopy database. Planned unselected colonoscopies performed by 16 experienced colonoscopists were included. The 16 endoscopists included 8 consultant gastroenterologists, 5 consultant surgeons, 2 nurse endoscopists, and 1 senior medical trainee. All endoscopists who participated in the study were fully independent in their colonoscopy skills. All of them had completed or nearly completed 1000 colonoscopies in their lifetime. A total of 50 procedures done by each colonoscopist between June 2011 and May 2012 were randomly selected. Our exclusion criteria included the following: inadequate bowel preparation, planned therapeutic procedure, procedure for a patient whose radiological imaging suggested the presence of polyps, inflammatory bowel disease surveillance/activity assessment indication, procedure during which image capture failed, previous hemicolectomy, incomplete procedure, bowel cancer screening programme (BCSP) colonoscopy, and procedure for a high risk patient with a genetic disease such as familial adenomatous polyposis (FAP) or hereditary nonpolyposis colorectal cancer (HNPCC).
After some of the procedures had been excluded according to our exclusion criteria (Fig. 1), 651 procedures were included in the study (average of 40 procedures per endoscopist). Exclusions were due to inadequate bowel cleansing (n = 50), incomplete procedure (n = 40), image capture failure (n = 35), inflammatory bowel disease indication (n = 13), and previous hemicolectomy (n = 11).
Fig. 1.
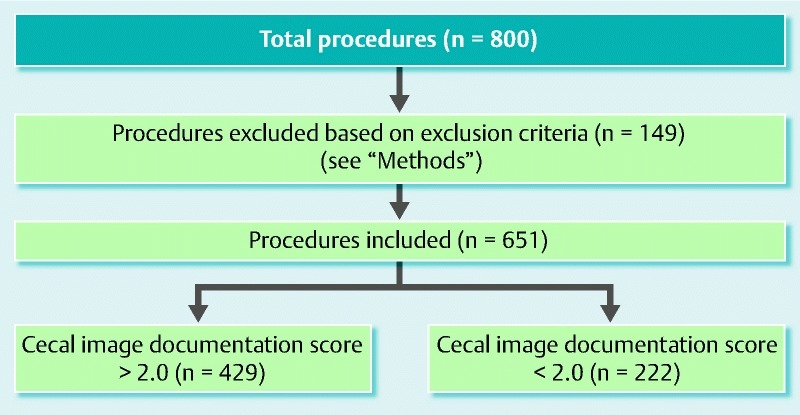
Flow chart of study correlating the quality of cecal image documentation at colonoscopy with the polyp detection rate.
The preprocedural data collected were age and gender of the patients and indications for the procedures. The intraprocedural data collected were duration of the procedure, number of images stored in the endoscopy database, quality of the cecal images taken, and number of polyps detected (excluding rectal hyperplastic polyps). We cross-checked our pathology database to confirm the histology of the polyps (data not included). Only procedures for patients who had adequate bowel preparation were included. Procedures for patients with poor or inadequate bowel preparation were excluded.
We formulated a new scoring system to quantify the quality of the cecal images captured electronically – the cecal image documentation score (CIDS). Scoring with the CIDS was as follows: no image taken, 0; unclear image, 1; clear image, 2; clear image with a label, 3 (Table 1). Examples of images with scores of 1 through 3 are included (Figs. 2 – 4). A clear image labeled “cecum” was given a CIDS of 3. Images with a CIDS of either 2 or 3 were clear images of the cecum; however, we gave a higher score of 3 to an image when the endoscopist had clearly labeled it as representative of the cecum. We felt that this label would be a “surrogate marker” indicating that the endoscopist was meticulous.
Table 1. Cecal image documentation score.
| 0, no image |
| 1, unclear image |
| 2, clear image |
| 3, clear image with a label |
Fig. 2.
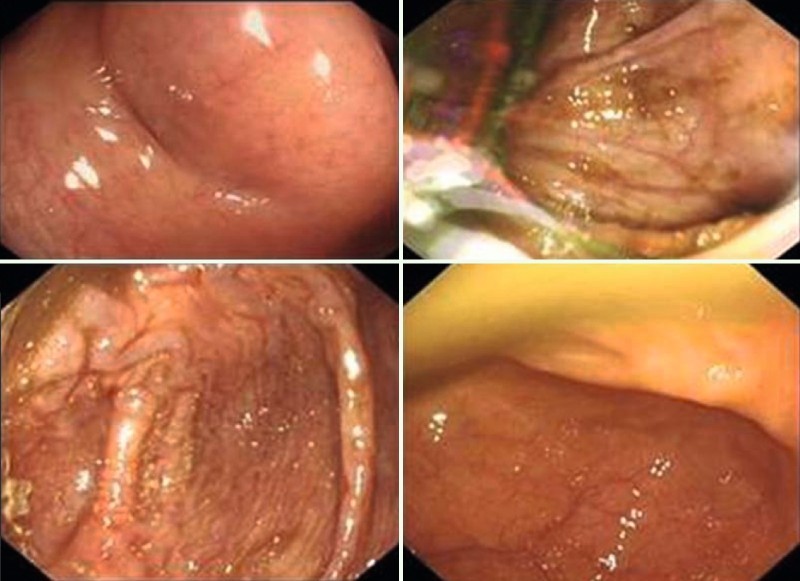
Examples of procedures in which the cecal image documentation score was 1.
Fig. 3.
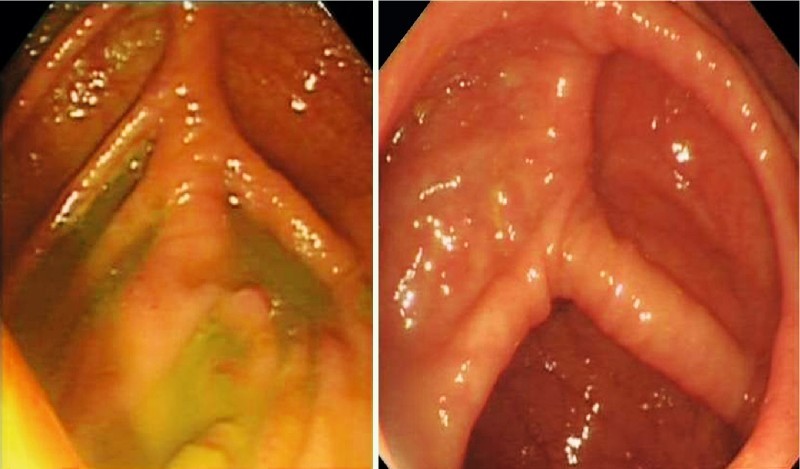
Examples of procedures in which the cecal image documentation score was 2.
Fig. 4.
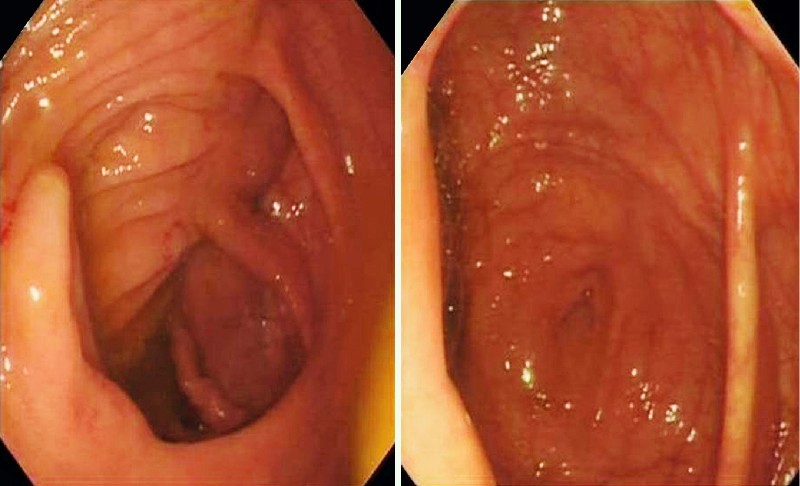
Examples of procedures in which the cecal image documentation score was 3.
We assigned scores based on the quality of the cecal images taken that were stored in the software-generated endoscopy reports in our database. We did not provide a score based on the quality of the images on paper reports because the quality of an image on a report can depend on the printer.
Quantitative data were summarized with means and standard deviations, and categorical data were summarized with numbers and percentages. Comparisons between patients of colonoscopists with a mean CIDS > 2.0 and patients of colonoscopists with a mean CIDS < 2.0 were performed with respect to age by using the Wilcoxon rank sum test, and with respect to age categories, gender, and indications by using the chi-squared test or Fisher’s exact test. For analyses of colonoscopy characteristics and outcomes, generalized estimating equations (GEE) were used to account for potential correlations within colonoscopists. The GEE analyses included Poisson regression models to compare the mean CIDS groups with respect to counts of polyps or images, linear regression models for log-transformed procedure duration, and logistic regression models for the frequency of rectal retroflexed images and frequency of polyp detection. Analyses were performed with R version 3.0.1 (www.r-project.org).
Results
A total of 651 procedures performed by 16 colonoscopists were analyzed. The mean number of procedures performed by each colonoscopist was 41. The mean age of the patients was 60.7 years, and 53.8 % of the patients were female. The patient demographics are summarized in Table 2. We had information about the indication for 97 % of the procedures (n = 632). The mean CIDS for the 16 endoscopists was 2.13. The mean PDR was 23.5 %, and the mean polyps per procedure value (PPP) was 0.42. Most of the polyps included were adenomas; 5 right-sided hyperplastic polyps were also included.
Table 2. Patient demographics and analysis.
| CIDS ≥ 2.0 (n = 429) | CIDS < 2.0 (n = 222) | P value, analysis | |
| Age, mean ± SD, y | 59.54 ± 14.64 | 61.77 ± 13.61 | 0.13, W |
| Age ≤ 75 y, n (%) | 355 (82.8) | 182 (82.0) | 0.81, C |
| Age ≥ 75 y, n (%) | 74 (17.2) | 40 (18.0) | |
| Male, n (%) | 210 (49.0) | 91 (41.0) | 0.054, C |
| Female, n (%) | 219 (51.0) | 131 (59.0) | |
| Indication1 | |||
| Change in bowel habit | 70 (11) | 51 (8) | |
| Loose stools | 123 (19.4) | 49 (7.7) | |
| Constipation | 17 (2.6) | 4 (0.63) | |
| Rectal bleeding | 68 (10.7) | 26 (4.1) | 0.08, F |
| Anemia | 68 (10.7) | 43 (6.8) | |
| Polyp surveillance | 39 (6.1) | 23 (3.6) | |
| Abnormal imaging | 3 (0.4) | 1 (0.1) | |
| Other | 35 (5.5) | 12 (1.8) |
CIDS, cecal image documentation score; SD, standard deviation; W, Wilcoxon rank-sum test; C, chi-squared test;. F, Fisher’s exact test.
Indication was available for 632 (97 %) of the procedures.
The 10 colonoscopists who had a mean CIDS score ≥ 2 (n = 429 procedures) were deemed “meticulous” with respect to cecal image documentation. They had a PDR of 27.8 % and a mean PPP of 0.51. On the other hand, the 6 colonoscopists with a mean CIDS < 2.0 (222 procedures) had a PDR of 15.2 % and a mean PPP of 0.23. Scatter plots for the colonoscopists and their PDRs and right-sided PDRs are shown in Fig. 5 and Fig. 6, respectively. The senior medical trainee endoscopist had a favorable CIDS of 2.57 and a PDR of 21.4 %. Multivariable analyses were carried out with polyp detection (Table 3) and right-sided polyp detection (Table 4) as the outcome. These show that a CIDS > 2.0 is an independent predictor of both polyp detection and right-sided polyp detection.
Fig. 5.
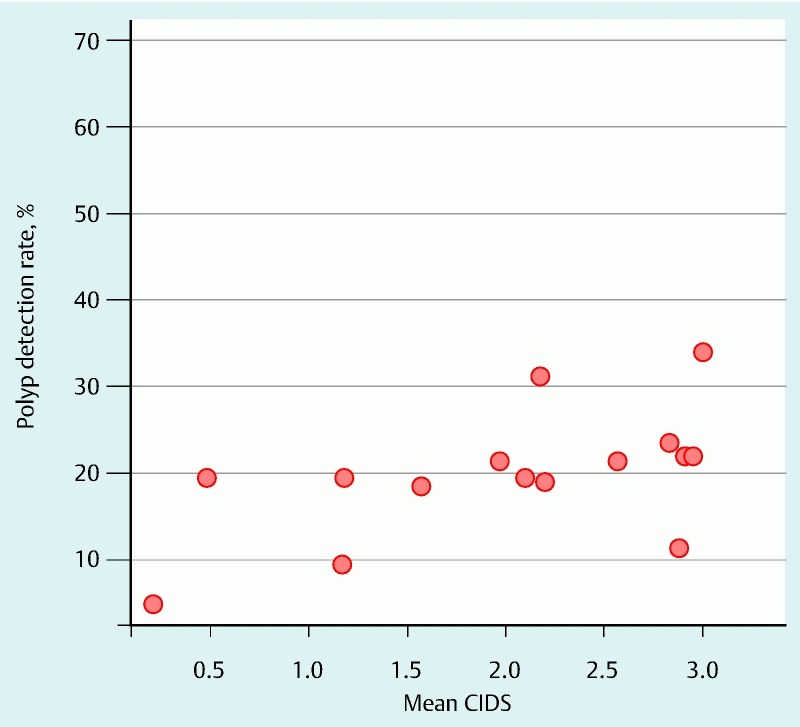
Scatter plot comparing the cecal image documentation scores (CIDSs) of colonoscopists with their polyp detection rates.
Fig. 6.
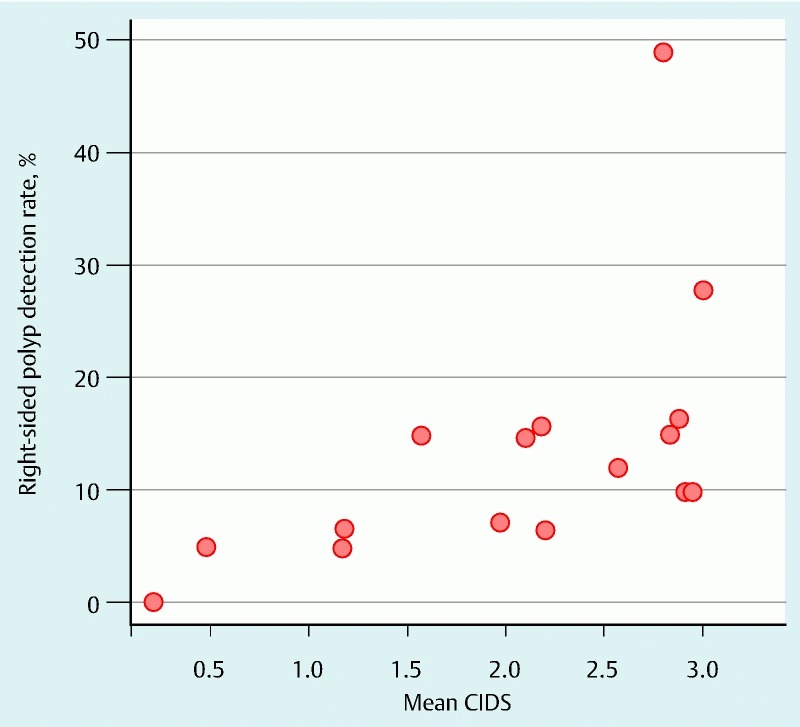
Scatter plot comparing the cecal image documentation scores (CIDSs) of colonoscopists with their right-sided polyp detection rates.
Table 3. Odds ratios (95 %CI) derived from a multivariable logistic regression model for the detection of polyps.
| Variable | Odds ratio (95 %CI) | P value1 |
| Age > 75 y | 1.88 (1.22 – 2.92) | 0.004 |
| Female gender | 0.71 (0.53 – 0.94) | 0.016 |
| Indication Change in bowel habits Loose stools Constipation Rectal bleeding Anemia Polyp follow-up Abnormal imaging Other |
1.0 0.75 (0.48 – 1.17) 0.46 (0.11 – 1.90) 0.88 (0.46 – 1.69) 0.62 (0.42 – 0.90) 2.24 (1.19 – 4.22) 0.53 (0.08 – 3.36) 0.55 (0.26 – 1.15) |
0.005 |
| Colonoscopist with mean CIDS > 2.0 | 2.53 (1.45 – 3.59)2 | 0.001 |
CI, confidence interval; CIDS, cecal image documentation score.
Wald P values are reported with generalized estimating equations to account for correlation within colonoscopists.
The univariable odds ratio (95 %CI) for colonoscopists with a mean CIDS of > 2.0 was 2.14 (1.40 – 3.26).
Table 4. Odds ratios (95 %CI) derived from a multivariable logistic regression model for the detection of right-sided polyps.
| Variable | Odds ratio (95 %CI) | P value1 |
| Age > 75 y | 2.30 (1.30 – 4.06) | 0.004 |
| Female gender | 0.67 (0.42 – 1.09) | 0.11 |
| Indication | 0.007 | |
| Change in bowel habits Loose stools Constipation Rectal bleeding Anemia Polyp follow-up Abnormal imaging Other |
1.0 0.95 (0.47 – 1.90) 0.30 (0.04 – 2.44) 0.64 (0.27 – 1.51) 0.45 (0.18 – 1.10) 2.71 (1.23 – 5.99) 1.41 (0.12 – 15.8) 0.83 (0.30 – 2.31) |
|
| Colonoscopist with mean CIDS > 2.0 | 3.67 (1.91 – 7.02)2 | < 0.001 |
CI, confidence interval; CIDS, cecal image documentation score.
Wald P values are reported with generalized estimating equations to account for correlation within colonoscopists.
The univariable odds ratio (95 %CI) for colonoscopists with a mean CIDS of > 2.0 was 3.43 (1.86 – 6.34).
The CIDS was a good predictor of the PDR for an individual procedure (P = 0.001). Procedures associated with higher CIDSs (2 and 3) were associated with higher PDRs (24.2 % and 26.4 %). On the other hand, procedures associated with lower CIDSs (0 and 1) were associated with lower PDRs (16.1 % and 17.6 %)
Because a CIDS of 2 involves taking a clear picture of the cecum, we used a CIDS of 2 as the cutoff between meticulous and nonmeticulous colonoscopists. Meticulous endoscopists took on average 5 more images at colonoscopy than did nonmeticulous endoscopists (P = 0.002). The meticulous endoscopists also took retroflexed rectal images more frequently (80.6 % of the time) than did the nonmeticulous endoscopists (38.6 % of the time, P = 0.016) (Table 5).
Table 5. Correlation of meticulous and nonmeticulous colonoscopists with polyp detection rates, polyps per procedure, and number of images taken.
| Overall | CIDS < 2.0 | CIDS > 2.0 | P value | Method | |
| Polyps per procedure, mean ± SD | 0.42 ± 0.98 | 0.23 ± 00.65 | 0.51 ± 1.10 | 0.009 | Poisson regression models |
| Polyp detection rate, n (%) | 153 (23.5) | 34 (15.2) | 119 (27.8) | 0.010 | Poisson regression models |
| Total images per procedure, mean ± SD | 8.63 ± 5.93 | 4.41 ± 4.55 | 10.77 ± 5.38 | 0.002 | Poisson regression models |
| Rectal retroflexed images taken, n (%) | 431 (66.2) | 86 (38.6) | 345 (80.6) | 0.016 | Logistic regression models |
| Duration of procedure, mean ± SD, min | 31.68 ± 14.27 | 29.70 ± 14.67 | 32.47 ± 14.05 | 0.13 | Linear regression models |
CIDS, cecal image documentation score; SD, standard deviation.
We had data related to the duration of 91 % of the procedures (n = 592). The data regarding duration were for the total duration of each procedure and were not specifically limited to insertion or withdrawal times. There was no statistically significant difference in procedure duration between the two groups (P = 0.13) (Table 5).
Discussion
Our study shows that colonoscopists who are more meticulous in cecal image documentation detect more polyps per procedure and have higher PDRs. The cecum is the definitive landmark of colonoscopy; we believe that a meticulous and enthusiastic endoscopist will take extra effort to obtain a convincing and clear image of the cecum and that the same endoscopist will be meticulous and especially vigilant in polyp detection.
The ileocecal valve is considered to be the most reliable landmark of the cecum because of its unique appearance 6 7. Images of the ileocecal valve along with the triradiate fold and appendicular orifice provide convincing evidence of a completed colonoscopy. Terminal ileal images alone without cecal images may not be reliable evidence of the completion of colonoscopy 8. Therefore, we chose cecal image documentation over terminal ileal image documentation as a marker of completion of the procedure. Furthermore, terminal ileal intubation is not always performed and may not always be possible 9.
Endoscopy reporting has evolved over the years, particularly with the advent of minimal standard terminology 10. Perhaps it is time to include meticulous cecal image documentation as part of minimal standard terminology. The American Society for Gastrointestinal Endoscopy (ASGE) recommends good-quality cecal images as an indicator of the quality of colonoscopy 11. The primary purpose of image documentation of the cecum is to demonstrate that a complete procedure has been carried out. The quality of cecal images determines the level of confidence that the cecum has been reached. The European Society of Gastrointestinal Endoscopy (ESGE) recommends that convincing images of the cecum be taken at colonoscopy to document completion of the procedure 5 12. This can be helpful for endoscopy units during audits for cecal intubation rates.
Colonic lesions and cancers may be missed at colonoscopy for various reasons, including the endoscopist’s erroneous belief that the cecum was reached 13. It has been suggested that routinely obtaining good-quality and reliable cecal image documentation can be helpful when medicolegal issues arise that are related to missed pathology during colonoscopy 14.
Our study has some limitations. This was a retrospective, nonrandomized study. We did not have data regarding withdrawal times and withdrawal techniques. The outcome used was polyp detection rather than adenoma detection. This was because a few right-sided hyperplastic polyps (n = 5) were analyzed. As a consequence of the robust exclusion process, only about 40 cases per endoscopist were randomly chosen. We felt that an average of 40 images of the cecum per colonoscopist should be sufficient. We compared the CIDSs of the current study period with our endoscopy unit’s previous-year audit of individual endoscopists’ PDRs. Endoscopists with a CIDS > 2.0 had a mean PDR of 31 % in the previous year’s audit, and endoscopists with a CIDS < 2.0 had a PDR of 17 % in the previous year’s audit. Because this was a nonrandomized and retrospective study, we could not ensure an equal distribution of genders across the two groups. As a result, there was a marginal difference in the gender distribution between the two groups (P = 0.054). There was a slightly higher percentage of female patients (59 %) in the group examined by the colonoscopists with a CIDS of < 2.0 than in the group examined by the colonoscopists with a CIDS > 2.0 (51 %). This probably reflects the higher percentage of female patients overall in the study (53.7 %).
Our study emphasizes the importance of taking good-quality images of the cecum because this is likely to be associated with higher PDRs. Cecal image quality may be useful as a surrogate marker of the PDR and may serve an indicator of colonoscopy quality.
Footnotes
Competing interests: None
References
- 1.Fracchia M, Senore C, Armaroli P. et al. Assessment of the multiple components of the variability in the adenoma detection rate in sigmoidoscopy screening, and lessons for training. Endoscopy. 2010;42:448–455. doi: 10.1055/s-0029-1244131. [DOI] [PubMed] [Google Scholar]
- 2.Thomas-Gibson S, Rogers P A, Suzuki N. et al. Development of a video assessment scoring method to determine the accuracy of endoscopist performance at screening flexible sigmoidoscopy. Endoscopy. 2006;38:218–225. doi: 10.1055/s-2005-870445. [DOI] [PubMed] [Google Scholar]
- 3.Goncalves A R, Ferreira C, Marques A. et al. Assessment of quality in screening colonoscopy for colorectal cancer. Clin Exp Gastroenterol. 2011;4:277–281. doi: 10.2147/CEG.S25596. [DOI] [PMC free article] [PubMed] [Google Scholar]
- 4.Crispin A, Birkner B, Munte A. et al. Process quality and incidence of acute complications in a series of more than 230,000 outpatient colonoscopies. Endoscopy. 2009;41:1018–1025. doi: 10.1055/s-0029-1215214. [DOI] [PubMed] [Google Scholar]
- 5.Rey J F, Lambert R. ESGE recommendations for quality control in gastrointestinal endoscopy: guidelines for image documentation in upper and lower GI endoscopy. Endoscopy. 2001;33:901–903. doi: 10.1055/s-2001-42537. [DOI] [PubMed] [Google Scholar]
- 6.Cirocco W C, Rusin L C. Confirmation of cecal intubation during colonoscopy. Dis Colon Rectum. 1995;38:402–406. doi: 10.1007/BF02054230. [DOI] [PubMed] [Google Scholar]
- 7.Rex D K. Still photography versus videotaping for documentation of cecal intubation: a prospective study. Gastrointest Endosc. 2000;51:451–459. doi: 10.1016/s0016-5107(00)70447-0. [DOI] [PubMed] [Google Scholar]
- 8.Baraza W, Brown S, Shorthouse A J. et al. Direct photographic documentation of ileal mucosa in routine colonoscopy is not an independent valid or reliable proof of completion: quality assurance issues for the national colorectal cancer-screening programme. Colorectal Dis. 2009;11:89–93. doi: 10.1111/j.1463-1318.2008.01511.x. [DOI] [PubMed] [Google Scholar]
- 9.Iacopini G, Frontespezi S, Vitale M A. et al. Routine ileoscopy at colonoscopy: a prospective evaluation of learning curve and skill-keeping line. Gastrointest Endosc. 2006;63:250–256. doi: 10.1016/j.gie.2005.09.029. [DOI] [PubMed] [Google Scholar]
- 10.Aabakken L 1, Rembacken B, LeMoine O. et al. Minimal standard terminology for gastrointestinal endoscopy - MST 3.0. Endoscopy. 2009;41:727–728. doi: 10.1055/s-0029-1214949. [DOI] [PubMed] [Google Scholar]
- 11.Rex D K, Schoenfeld P S, Cohen J. et al. Quality indicators for colonoscopy. Gastrointest Endosc. 2015;81:31–53. doi: 10.1016/j.gie.2014.07.058. [DOI] [PubMed] [Google Scholar]
- 12.Rembacken B, Hassan C, Riemann J F. et al. Quality in screening colonoscopy: position statement of the European Society of Gastrointestinal Endoscopy (ESGE) Endoscopy. 2012;44:957–968. doi: 10.1055/s-0032-1325686. [DOI] [PubMed] [Google Scholar]
- 13.Bressler B, Paszat L F, Vinden C. et al. Colonoscopic miss rates for right-sided colon cancer: a population-based analysis. Gastroenterology. 2004;127:452–456. doi: 10.1053/j.gastro.2004.05.032. [DOI] [PubMed] [Google Scholar]
- 14.Rex D K, Bond J H, Feld A D. Medical-legal risks of incident cancers after clearing colonoscopy. Am J Gastroenterol. 2001;96:952–957. doi: 10.1111/j.1572-0241.2001.03677.x. [DOI] [PubMed] [Google Scholar]


