

Background: Lecithin:cholesterol acyltransferase-deficient (LCAT-D)/LDL receptor-null mice spontaneously develop ectopic brown adipose tissue (ectBAT) in skeletal muscle.
Results: ectBAT, of classical lineage, develops in utero and from adult satellite cells (SC), regulated by LCAT-D and reduced cellular cholesterol.
Conclusion: LCAT-D synergizes with low cellular cholesterol to promote SC-to-ectBAT differentiation.
Significance: We present a novel lipid-based mechanism to recruit functional BAT.
Keywords: animal model, cholesterol, differentiation, metabolic regulation, obesity, LCAT, brown adipose tissue, satellite cells, uncoupling protein 1
Abstract
Our laboratory previously reported that lecithin:cholesterol acyltransferase (LCAT) and LDL receptor double knock-out mice (Ldlr−/−xLcat−/− or DKO) spontaneously develop functioning ectopic brown adipose tissue (BAT) in skeletal muscle, putatively contributing to protection from the diet-induced obesity phenotype. Here we further investigated their developmental origin and the mechanistic role of LCAT deficiency. Gene profiling of skeletal muscle in DKO newborns and adults revealed a classical lineage. Primary quiescent satellite cells (SC) from chow-fed DKO mice, not in Ldlr−/−xLcat+/+ single-knock-out (SKO) or C57BL/6 wild type, were found to (i) express exclusively classical BAT-selective genes, (ii) be primed to express key functional BAT genes, and (iii) exhibit markedly increased ex vivo adipogenic differentiation into brown adipocytes. This gene priming effect was abrogated upon feeding the mice a 2% high cholesterol diet in association with accumulation of excess intracellular cholesterol. Ex vivo cholesterol loading of chow-fed DKO SC recapitulated the effect, indicating that cellular cholesterol is a key regulator of SC-to-BAT differentiation. Comparing adipogenicity of Ldlr+/+xLcat−/− (LCAT-KO) SC with DKO SC identified a role for LCAT deficiency in priming SC to express BAT genes. Additionally, we found that reduced cellular cholesterol is important for adipogenic differentiation, evidenced by increased induction of adipogenesis in cholesterol-depleted SC from both LCAT-KO and SKO mice. Taken together, we conclude that ectopic BAT in DKO mice is classical in origin, and its development begins in utero. We further showed complementary roles of LCAT deficiency and cellular cholesterol reduction in the SC-to-BAT adipogenesis.
Introduction
Brown adipose tissue (BAT)2 is a thermogenically active fat tissue found most abundantly in newborn mammals. The expression of PRDM16, a transcription factor originally identified as a bidirectional switch involved in cell fate determination of myf5+ myoblasts (1), has recently been found to be sufficient to induce both (i) classical BAT differentiation and (ii) beiging of the white fat (2, 3) from their respective preadipocytes, distinguished by distinct panels of molecular signatures (4). Recently, the identification of functional BAT in adult humans (5–7) has sparked intense interest in research regarding either expansion of the existing BAT or the stimulation and increased differentiation of BAT as a method to combat obesity and related cardiometabolic complications, including type 2 diabetes and other risk factors for metabolic syndrome. Functional BAT in adult humans has been characterized as predominantly, but not exclusively, beige fat, which has led to more intense focus in strategies to activate this lineage to harvest functional BAT (8–10). To date, although many hormonal and non-hormonal factors have been identified and explored, finding a safe and effective means of recruiting functional BAT continues to be elusive, and alternate strategies warrant exploration (8). Recently, Yin et al. (11) reported success in differentiating adult skeletal muscle satellite cells into functioning brown adipocytes in vivo by combining injury-like activation and inhibition of miR133 to induce PRDM16 expressions. These observations have opened up opportunities to target adult SC as a potential source of functional BAT.
Recently, our laboratory has reported spontaneous expression of UCP1 in skeletal muscle of LCAT-deficient mice with the phenotype being dramatically accentuated in the background of LDL receptor knock-out. We detected ectopic BAT islands located in the interfiber regions of the skeletal muscle of adult Ldlr−/−xLcat−/− (DKO) mice (12) in association with a metabolically protected phenotype showing resistance to diet-induced obesity and glucose intolerance as well as increased energy expenditure, the latter finding being based on indirect calorimetry, when compared with their Ldlr−/−xLcat+/+ (SKO) controls (12, 13). LCAT is the enzyme that hydrolyzes phosphatidylcholine at the sn-2 position and transfers the fatty acid to convert free cholesterol into esterified cholesterol in circulating lipoproteins. The complete absence of LCAT, a rare genetic syndrome described in humans, has widespread effects on both circulating and tissue lipid metabolisms, in part accounting for the deleterious clinical phenotypes (14, 15). LCAT-deficient mice develop selective alterations in tissue lipids, including lowered cholesterol and lipid composition in the adrenals and the liver (12, 16, 17). Some of these changes are linked to protective phenotypes because our laboratory has shown recently that DKO mice protected from hepatic ER cholesterol accumulation are also protected from hepatic ER stress and insulin resistance (13).
In this study, we look to examine the ectopic BAT found in our DKO model to identify its ontogenic pathway and characterize what changes to the lipid milieu are contributing to the unique phenotype. Given the presence of ectopic BAT islands in and among skeletal muscle fibers (12) and the recent identification of adult muscle SC as putative BAT progenitors (11), we hypothesize that the BAT islands found in DKO skeletal muscle are of classical lineage and may, at least in part, derive from adult muscle SC. Also, we hypothesize that this process may be regulated by alterations in SC cholesterol metabolism, modulated by LCAT deficiency. We use both in vivo and ex vivo approaches to characterize cultured SC in their quiescent state and after adipogenic differentiation as well as modulating cholesterol content by high cholesterol diet and alternatively by ex vivo direct modulation via modified cyclodextrin complexes. In total, we provide intriguing evidence for novel, independent roles of LCAT deficiency and SC cholesterol in regulating the SC-to-BAT differentiation process, presenting a promising therapeutic target for treatment of metabolic diseases.
Experimental Procedures
Antibodies and Reagents
Rabbit anti-UCP1 (Calbiochem) (1:200 dilution) was as validated and described previously (12). Mouse anti-PAX7 (Santa Cruz Biotechnology, Inc.) (1:50 dilution) was as validated and described previously (18). Additional antibodies in this study: rabbit anti-ABCA1 (Novus Biochemicals) (1:200 dilution) (19); chicken anti-laminin (Abcam) (1:200 dilution); Alexa Fluor-coupled goat anti-mouse IgG (Life Technologies, Inc.) (1:2000 dilution); biotinylated goat anti-rabbit IgG (Vector Laboratories) (1:1000 dilution); Alexa Fluor 350-coupled goat anti-chicken IgG (Life Technologies, Inc.) (1:2000 dilution); and methyl-β-cyclodextrin (MCD), cholesterol, and hydroxypropyl-β-cyclodextrin (HPCD) from Sigma. Texas Red fluorophore and Vectamount mounting medium were purchased from Vector Laboratories.
Animals
Ldlr−/−xLcat−/− (DKO), Ldlr−/−xLcat+/+ (SKO),and Lcat−/− (LCAT-KO) mice in C57Bl/6 background were generated as described previously (13, 17). C57BL/6 wild type (WT) mice were used as controls. Only age-matched female animals were used in all experiments to minimize previously reported gender-dependent effects (13). Animals were bred and monitored at the Li Ka Shing Knowledge Institute Research Vivarium, and all experimental procedures used were according to protocols approved by the Animal Care Committee.
Tissue and Primary Satellite Cell Isolation
For characterization of adult skeletal muscle gene and protein expression, mice were fasted overnight for 12 h and then sacrificed via cervical dislocation. The quadriceps was isolated and cleaned of fat and surrounding connective tissue before being flash-frozen in TRIzol reagent or fixed in 4% paraformaldehyde in PBS. For characterization of newborn skeletal muscle, newborns were sacrificed at <24 h old, the limbs were dissected, and skin and bone were removed prior to freezing in TRIzol reagent. Satellite cells were isolated via published protocols using the same reagents (20). Briefly, mice were fasted overnight for 12 h and then sacrificed via cervical dislocation. The quadriceps, gastrocnemius, and the biceps femoris muscles were removed and placed in warm DMEM with 1% penicillin-streptomycin (DMEM+). The tissue was washed and transferred to fresh medium, and connective tissue was manually removed with fine forceps, followed by 1 h of Pronase digestion in fresh DMEM+. Tissue was transferred to new DMEM+ with 10% horse serum added and underwent three successive rounds of manual trituration using a 10-ml serological pipette, a wide bore borosilicate Pasteur pipette, and a narrow bore Pasteur pipette. After the first trituration, the supernatant was collected after being passed through a 45-μm cell strainer. Fresh medium was added to cells. After the third trituration, medium and cells were strained, collected, and pelleted by centrifugation (10 min at 1000 × g). Cells were resuspended in growth medium (DMEM+, 30% fetal bovine serum, 10% horse serum, 1% chicken embryo extract) and counted via a hemocytometer before either being plated for culturing or immunofluorescence or flash-frozen for isolation of RNA or lipids.
RNA Isolation and Quantification
Prior to RNA isolation, cells in growth medium were centrifuged as before (10 min at 1000 × g) and washed with phosphate-buffered saline twice before being flash-frozen in TRIzol reagent. RNA isolation was performed with a modified version of the RNeasy minikit protocol (Qiagen). Briefly, 250 μl of chloroform was added to thawed, sonicated cells and incubated for 10 min at room temperature. This mixture was then separated by centrifugation (15 min at 12,000 × g and 4 °C). The organic phase was added to equal volumes of 70% ethanol and transferred to RNeasy columns for wash steps and elution according to the kit protocols. First-strand cDNA synthesis and quantitative PCR analysis were performed as described previously (13). Expression of mRNA was quantified using the ΔΔCT method (21) with Gapdh as the housekeeping gene for all measurements. Primer pairs were as follows: Abca1, 5′-ccggcaaggccgcaccatta-3′ (forward) and 5′-gcccacacaacacagcttccca-3′ (reverse); Ebf3, 5′-cgaaaggaccgcttttgtgg-3′ (forward) and 5′-agtgaatgccgttgttggttt-3′(reverse); Gapdh, 5′-acccagaagactgtggatgg-3′ (forward) and 5′-ggatgcagggatgatgttct-3′ (reverse); Hmgr, 5′-tctggcagtcagtgggaactatt-3′ (forward) and 5′-cctcgtccttcgatccaattt-3′ (reverse); Hspb7, 5′-gagcatgttttcagacgactttg-3′ (forward) and 5′-ccgagggtcttgatgtttcctt-3′ (reverse); Klhl13, 5′-agaattggttgctgcaatactcc-3′ (forward) and 5′- aaggcacagtttcaagtgctg-3′ (reverse); Mpzl2, 5′-ataaagccgaggggacaaaa-3′ (forward) and 5′-gatttcaaggggtgctgatg-3′ (reverse); Pparγ, 5′-gatggaagaccactcgcatt-3′ (forward) and 5′- aaccattgggtcagctcttg-3′ (reverse); Prdm16, 5′-cagcacggtgaagccattc-3′ (forward) and 5′-gcgtgcatccgcttgtg-3′ (reverse); Sqs, 5′-taagcctgctgcgtatgttg-3′ (forward) and 5′-cccagtaatccagcaaggaa-3′ (reverse); Tmem26, 5′-agacagaacggcatagcaca-3′ (forward) and 5′- cgtagtccagccagtcaaaag-3′ (reverse); Ucp1, 5′-actgccacacctccagtcatt-3′ (forward) and 5′-ggttaggactcactccgtttc-3′ (reverse).
Adipogenic and Myogenic Culturing of Primary Satellite Cells
Isolated satellite cells were plated on Matrigel (Corning Life Sciences)-coated coverslips and subjected to a culturing protocol to induce adipogenesis (or myogenesis as a control) to assess the inducibility of these cells to form brown adipocytes according to published methods (1). Briefly, cells were maintained in growth medium (see above) for 48 h postplating, and then switched to either early adipogenic medium (DMEM+, 20% fetal bovine serum, 850 nm insulin, 1 nm T3, 1 μm rosiglitazone, 1 μm isobutylmethylxanthine) or myogenic medium (DMEM+, 20% fetal bovine serum). For adipogenesis, after 48 h in early adipogenic medium, cells were switched to late adipogenic medium (DMEM+, 20% fetal bovine serum, 850 nm insulin). These cells were then allowed to grow at 37 °C for 8 days before being fixed for assessment of neutral lipids by ORO staining and UCP1 protein by immunofluorescence.
Lipid Extraction and Cholesterol Quantification
Lipids were extracted from satellite cells (both differentiated and undifferentiated) using a modified Folch extraction protocol as performed previously in liver tissue (13). Total cholesterol was measured using a commercially available colorimetric assay (Beckman Coulter) with previously calibrated serum cholesterol as a standard for a serially diluted standard curve. Free cholesterol was measured using a colorimetric commercial assay (Wako Diagnostics) with kit standards used to create a serially diluted standard curve. Both assays were performed according to the manufacturer's protocols.
Cell Staining; Oil Red O and Immunofluorescence
Cultured satellite cells were fixed and stained for ORO to test for the presence of neutral lipids as a measure of adipogenesis. Cells were fixed in 3% neutral buffered formalin (45 min), washed with distilled H2O, and placed in 60% isopropyl alcohol for 10 min. A stock solution (0.5 g of ORO in 100 ml of isopropyl alcohol), diluted 3:2 in distilled H2O, was applied to cells at room temperature for 15 min. Cells were counterstained with hematoxylin and mounted on slides with glycerol. Slides were bright field-imaged with an Eclipse e800 microscope and DS-Fi1c camera. Image processing was done with NIS-Elements software. Immunofluorescence was performed on postdifferentiation cells to qualitatively assess the presence of UCP1 protein. Cells were fixed in a 1:1 mixture of DMEM+ and 4% paraformaldehyde in PBS and washed three times in TBS, followed by a 10-min incubation with TBS + 0.05% Triton X-100. Cells were blocked in TBS + 1% normal goat serum (1 h). Primary (rabbit anti-UCP1) and secondary antibodies (biotinylated goat anti-rabbit) were applied (75 min each) and washed. Texas Red was then applied for 20 min (6 μl in 375 ml of TBS), followed by 10 min of DAPI (1:1000) stain for all samples. All incubations were at room temperature, and cells were washed three times in TBS + 0.5% Tween 20 after each incubation. Slides were mounted in Vectamount medium (Vector Laboratories) and imaged using an Olympus BX50 microscope, DP72 camera, and U-RFL-T fluorescence unit, with Cell Sens software. For counting, five low magnification fields (×100 total magnification) were systematically imaged at the four corners and center of each slide. FIJI image processing software was then used to tag and count ORO+ cells or UCP1+ cells and nuclei in each image.
Skeletal muscle from chow-fed DKO mice was fixed and paraffin-embedded by a TP1020 Benchtop Tissue Processor from Leica Biosystems, sectioned into 7-μm sheets with a Leica RM2265 microtome and cured onto Superfrost Plus slides (Fisher). Sections were deparaffinized prior to antibody staining. The procedure for staining of sections was similar to UCP1 immunofluorescent staining (see above) but was preceded by incubation with mouse anti-PAX7 (overnight, 4 °C), Alexa Fluor 488-coupled goat anti-mouse IgG (75 min, room temperature), 1 h of blocking, chicken anti-laminin (75 min, room temperature), and Alexa Fluor 350-coupled goat anti-chicken IgG (75 min, room temperature).
Cellular Respiration Assay
Cells were detached from culture medium using a 30-min dispase (Corning Life Sciences) treatment at 37 ºC and transferred into new medium in a 96-well plate at ∼106 cells/ml (150 μl/well). The MitoXpress Xtra oxygen consumption assay (HS method, Luxcell Biosciences) was used to assess cellular respiration by indirect measurement of an oxygen-quenched fluorophore over a 90-min period, as per the manufacturer's protocols. Briefly, 10 μl of fluorophore reagent was added to each well, and ∼100 μl of mineral oil was overlaid on top of the medium to prevent any external oxygen mixing. Time-resolved fluorescence was measured once per minute using a Biotek Synergy Neo reader, which had been validated for use with the kit by the manufacturer and using the recommended settings. Analysis was performed by measuring the rate of oxygen consumption in the linear portion of the assay by linear regression to calculate the slope of the line of best fit.
Subexperiment 1; Undifferentiated SC Characterization
This subexperiment was designed to characterize primary satellite cells in their quiescent state from the four mouse strains to assess their BAT inducibility. Satellite cells were isolated from skeletal muscle of 12–15-week-old mice and either plated overnight on Matrigel-coated coverslips for immediate immunofluorescent staining the following day or flash-frozen immediately in PBS for lipid analysis or TRIzol reagent for RNA quantification.
Subexperiment 2; High Cholesterol Diet Feeding
Study mice were fed either chow (Harlan Teklad 2918) or a 2% high cholesterol diet (HCD; Harlan Teklad 0391) for 10 weeks beginning at ∼12 weeks old as described previously (13). After 10 weeks of feeding, mice were sacrificed by cervical dislocation. Skeletal muscle tissue samples were then harvested and either fixed for immunohistological staining or frozen for gene expression analysis. Satellite cells were isolated for analysis of quiescent or postdifferentiated gene and protein expression, adipogenicity by culturing, and lipid quantification.
Subexperiment 3; Ex Vivo Cholesterol Loading of Primary Satellite Cells
To determine whether the effect of high cholesterol diet feeding on satellite cell brown fat gene expression and adipogenicity can be recapitulated in cultured SC, independent of the in vivo SC niche, we used an MCD complex coupled to cholesterol to exogenously elevate the intracellular cholesterol of these cells ex vivo during the course of the adipogenic program. Primary SC isolated from chow-fed DKO mice were treated with 5% MCD + 40 μg/μl cholesterol, as described previously (13), or 5% MCD alone as a control (both via a 20-μl dose in 2 ml of medium) at the first addition of early adipogenic medium. Dosing was repeated every 48 h as medium was refreshed. After 10 days in adipogenic medium, cells were either subjected to ORO staining for neutral lipids, subjected to immunofluorescent staining for UCP1 protein expression, or scraped and flash-frozen immediately in PBS for lipid analysis or TRIzol reagent for RNA quantification.
Subexperiment 4; Ex Vivo Cholesterol Depletion of Primary Satellite Cells
To assess the direct effect of reduced cellular cholesterol on adipogenic potential of SC independent of the DKO in vivo SC niche, we used an ex vivo cholesterol depletion approach via HPCD to lower the cellular cholesterol content in satellite cells isolated from chow-fed SKO and LCAT-KO mice. Cells were treated with 20 μg/μl HPCD (with a 20-μl dose in 2 ml of medium) or with vehicle control every 48 h over the course of the 10-day adipogenic culturing protocol. Cells were then scraped and flash-frozen for quantitative PCR or lipid analysis or fixed for ORO and immunofluorescent staining as mentioned above.
Subexperiment 5; Characterization of Undifferentiated LCAT-KO SC and Their Inducibility to BAT by Cholesterol Depletion
To identify the specific role of LCAT deletion in the priming and inducibility of SC to convert to functional BAT, we examined both undifferentiated and differentiated SC from chow-fed LCAT-KO mice. We measured total and free cholesterol and mRNA of key BAT and lipid genes (Ucp1, Prdm16, and Pparγ) in undifferentiated quiescent LCAT-KO SC as well as their inducibility to BAT by exposure to the 10-day adipogenic culturing. Furthermore, we then subjected LCAT SC to cholesterol depletion by HPCD treatment, as noted above for SKO SC.
Statistical Analysis
All data presented are means ± S.E. Statistical analysis was completed using GraphPad Prism version 6.0 (GraphPad Software, La Jolla, CA). The Mann-Whitney non-parametric test was used for comparison of skeletal muscle BAT gene expression. Unpaired Student's t test was used for all other comparisons between two treatments only and comparisons where only significance within a genotype or time point was desired. One-way ANOVA with Bonferroni post hoc test was done for comparisons of multiple samples. Two-way ANOVA with Tukey post hoc test was done for comparisons of tissue BAT gene expression among multiple genotypes. For all tests, p < 0.05 was considered statistically significant.
Results
Ectopic Brown Fat in Ldlr−/−xLcat−/− DKO Mice Is Classical in Origin
DKO Skeletal Muscle Exclusively Expresses Classical BAT-selective Genes in Neonates and Adults
To explore the developmental origin of the ectopic BAT in skeletal muscle of DKO mice, we measured the expression levels of established gene signatures for classical BAT- and beige-selective genes (4). Adult DKO skeletal muscle showed very low expression of the beige fat marker Tmem26 but significant mRNA expression of the classical BAT marker Mpzl2 (Fig. 1a, 8.1-fold, p = 0.03). Because classical BAT adipogenesis begins in utero, we tested the presence of BAT genes in hind limb skeletal muscle of newborn mice. Skeletal muscle isolated from newborn DKO mice also showed a marked 10-fold increase in Ucp1 mRNA expression relative to that of WT newborns, which was nearly undetectable (Fig. 1b, p = 0.001), a finding similar to those in the adult mice (12). Additionally, we examined a panel of genes previously identified (4) as selective for either classically derived BAT (Mpzl2, Ebf3, and Hspb7) or beige fat (Tmem26 and Klhl13). Beige fat markers were nearly undetectable in neonatal (Fig. 1c) and adult skeletal muscle (Fig. 1d) from both WT and DKO mice. Classical BAT markers were undetectable in WT mice, as expected. Two of the three classical BAT-selective genes, namely Mpzl2 (p < 0.006) and Hspb7 (p < 0.03) were markedly up-regulated in DKO newborn muscle, whereas the third gene Ebf3 showed a trend (Fig. 1b).
FIGURE 1.

a–d, mRNA expressions of BAT genes in hind limb skeletal muscle (adult and newborn mice) and primary satellite cells (adult mice). Data are mean ± S.E. (error bars). a, expression of Mpzl2 versus Tmem26 in skeletal muscle from adult female DKO mice, each normalized to Gapdh (n = 5), p = 0.03; b, expression of Ucp1 in hind limb skeletal muscles from newborn (<2 days postpartum) female DKO versus WT mice (n = 4 in each group), p = 0.001 by unpaired Student's t test; c and d, expression of BAT-selective (Mpzl2, Ebf3, and Hspb7) and beige-selective (Tmem26 and Klhl13) genes in skeletal muscle of newborn (c) and primary satellite cells from adult (d) DKO versus WT mice. p values were obtained by unpaired Student's t test of WT versus DKO expressions (n = 4). N.D., not detectable. e, representative images of triple immunofluorescent staining of primary satellite cells from DKO mice against laminin (blue), PAX7 (green), and UCP1 (red) illustrating co-localization (yellow) of UCP1 and PAX7 cells (white arrows) in sublaminar space. Both panels are from the same image at ×400 magnification. N.S., not statistically significant.
Adult DKO Mouse Primary Satellite Cells Exclusively Express Classical BAT-selective Genes
Considering that the lineage of Pax7+ satellite cells overlaps with that of myf5+ myoblasts (22), we also investigated the involvement of satellite cells in the adipogenesis of ectopic BAT. Over 99% of isolated SC from all three genotypes were identified as PAX7+ by immunohistological staining, indicating that our isolation procedure yields a highly pure population of quiescent satellite cells (data not shown). Satellite cells isolated from adult chow-fed WT and DKO mice (Fig. 1d) each showed Mpzl2 expression over 1000-fold greater than that of Tmem26 and Klhl13, which were barely detectable by quantitative PCR in both genotypes. In these same groups, DKO SC also exhibited >100-fold greater expression of Ebf3 and Hspb7 compared with the beige fat markers. All three BAT markers were significantly higher in quiescent SC from DKO relative to WT (Fig. 1d, p < 0.05). Altogether, our data indicate that Mpzl2 is expressed constitutively in quiescent satellite cells with a modest further increase in DKO mice, independent of brown fat development. On the other hand, the induction of Ebf3 and Hspb7 expressions in the DKO are more specific because their levels of expression were extremely low in WT mice. Finally, immunohistochemical staining of adult skeletal muscle sections show co-localization of PAX7 and UCP1 in the sublaminar spaces (Fig. 1e, arrows), a location where quiescent SC reside, raising the possibility that quiescent PAX7-marked SC in DKO mice also co-express UCP1.
Quiescent Satellite Cells from DKO Mice Are Primed to Express BAT Genes and Are BAT-inducible ex Vivo
BAT Genes Are Induced in Quiescent DKO Satellite Cells
Undifferentiated, quiescent satellite cells isolated from hind limb skeletal muscle of chow-fed adult DKO mice expressed significantly higher mRNA levels of Prdm16 (Fig. 2c, CHOW) relative to WT (5.6-fold, p < 0.05) and SKO (8.5-fold, p < 0.05) mice, both of which expressed Prdm16 at very low levels. Similarly, DKO mice also expressed higher Ucp1 mRNA (Fig. 2d, CHOW) than WT (3.1-fold, p < 0.05) and SKO mice (7.4-fold, p < 0.05). These findings correlate well with immunofluorescent staining evidence of UCP1 protein being abundantly present in SC isolated from chow-fed DKO mice but not in WT or SKO mice (Fig. 3, top row). Intriguingly, undifferentiated SC from chow-fed DKO mice expressed significantly higher Pparγ mRNA (Fig. 2e, CHOW) than chow-fed WT (1.9-fold, p < 0.05) and SKO mice (2.6-fold, p < 0.05), albeit only moderately, indicating a possible predisposition toward adipocyte differentiation.
FIGURE 2.

a and b, mRNA expressions of Prdm16 and Ucp1 in skeletal muscle from adult DKO mice, comparing HCD (open bars) versus chow (filled bars) feeding. Data are mean ± S.E. (error bars). HCD feeding resulted in marked reduction in both Prdm16 (3.8-fold, p = 0.03, n = 4–7) and Ucp1 (455-fold, p = 0.002, n = 4–5) expressions. Shown is mRNA expression of Prdm16 (c), Ucp1 (d), and Pparγ (e) (n = 3–5) in primary SC from HCD-fed (open bars) versus chow-fed (closed bars) DKO, SKO, and WT mice. *, significantly different gene expression between SC from the same genotype with differing diets; #, significantly different gene expression from all other genotypes, p < 0.05, two-way ANOVA with Tukey post hoc analysis. N.S., not statistically significant.
FIGURE 3.

UCP1 immunofluorescence staining in primary undifferentiated satellites cells isolated from chow-fed (top row) and HCD-fed (bottom row), age-matched female DKO (right), SKO (center), and WT (left) mice. Representative images are shown at ×1000 magnification; red, UCP1; blue, DAPI.
Expression of BAT Genes in DKO Mouse Whole Muscle and Undifferentiated Satellite Cells Is Suppressible by Dietary Cholesterol
To test the hypothesis that cellular cholesterol metabolism contributes to the observed selective high expression of Prdm16 and Ucp1 in DKO skeletal muscle (11), we fed all three mouse strains an HCD for 10 days. This HCD treatment significantly reduced expression of Prdm16 (3.2-fold reduction, p = 0.03; Fig. 2a) and Ucp1 (>400-fold reduction, p = 0.002; Fig. 2b) in whole skeletal muscle in DKO mice compared with chow-fed controls. Similarly, DKO satellite cells with increased cellular cholesterol from diet feeding showed a nearly complete suppression of Prdm16 (29.0-fold lower, p < 0.05; Fig. 2c), Ucp1 (5.8-fold lower, p < 0.05; Fig. 2d), and Pparγ (3.5-fold lower, p < 0.05; Fig. 2e) mRNA relative to chow-fed DKO SC, reducing them to levels seen in SC from chow- or HCD-fed, WT or SKO mice, none of which displayed a significant amount of any BAT genes. Meanwhile, no lowering of Prdm16, Ucp1, or Pparγ in response to HCD feeding was observed in either WT or SKO SC relative to chow-fed controls. Additionally, the observable UCP1 protein expression in immunofluorescence-stained chow-fed DKO satellite cells was markedly reduced after HCD feeding (Fig. 3, bottom row).
DKO Satellite Cells Are Primed to Brown Adipogenic Differentiation
When subjected to a 10-day adipogenic differentiation protocol, chow-fed DKO SC showed a significant increase in adipocyte formation as measured by the number of ORO+ cells (Fig. 4a; representative images of chow-fed animals shown in Fig. 4c (top row)) compared with WT (5.2-fold, p < 0.05) and SKO SC (2.3-fold, p < 0.05). As with undifferentiated SC, postadipogenic cultured DKO cells showed significantly more UCP1+ cells observed through immunofluorescent staining relative to WT (4.0-fold, p < 0.05) and SKO (2.6-fold, p < 0.05) postadipogenic SC (Fig. 4b; representative images shown in Fig. 4d (left column)). Neither the ORO+ counts nor UCP1+ cells from SKO and WT mice are significantly different from each other, supporting the hypothesis that LDLR deficiency in mice creates a metabolic milieu to potentiate the effect of LCAT deficiency in promoting SC-to-BAT differentiation and generation of ectopic BAT adipogenesis. By comparison, SC cultured in myogenic medium resulted in extremely low incidence of ORO+ (<0.23 cells/100 nuclei; representative images shown in Fig. 4c (bottom row)) and UCP1+ (<0.18 cells/100 nuclei; representative images shown in Fig. 4d (right column)) regardless of genotype or dietary treatment. Additionally, we measured the expression of BAT-selective (Mpzl2, Ebf3, and Hspb7) and beige-selective (Tmem26 and Klhl13) genes in DKO SC during the adipogenic culturing protocol, specifically at days 0, 4, 7, and 10 of culturing. At all time points, the expression of BAT-selective genes markedly elevated and expression of beige-selective genes largely undetectable (Fig. 4e, p < 0.05). By day 10, expressions of Mpzl2 and Ebf3 were significantly higher than at any other earlier time point (p < 0.05).
FIGURE 4.

Adipogenic culturing of primary undifferentiated satellite cells isolated from age-matched female DKO, SKO, and WT mice after fed either HCD (open bars) or chow (filled bars) mice. Adipogenicities are measured by neutral lipid ORO staining-positive cells/100 nuclei (a) or UCP1+ cells by immunofluorescence/100 nuclei (b). Each is the sum of five low magnification fields of cultured cells from a single animal. Data are mean ± S.E. (error bars). *, significantly different gene expression between SC from the same genotype with differing diets; #, significantly different gene expression from all other genotypes, p < 0.05, two-way ANOVA with Tukey post hoc analysis. Shown are representative images of ORO+ cells (red) co-stained with hematoxylin (blue) (c) and UCP1+ cells (red) co-stained with DAPI (blue) (d) after both adipogenic and myogenic culturing. e, expression of BAT-selective (Mpzl2, Ebf3, and Hspb7) and beige-selective (Tmem26 and Klhl13) genes in chow-fed DKO SC during the course of the 10-day adipogenic differentiation; #, significant difference between BAT and beige gene expression within a given time point; *, significantly higher expression of a specific gene at day 10 compared with day 0 and day 4; **, significantly higher expression of a specific gene at day 10 compared with days 0, 4, and 7, p < 0.05, two-way ANOVA with Tukey post hoc analysis. N.S., not statistically significant.
High Cholesterol Feeding Elevates Total and Free Cholesterol in SC of All Genotypes, Correlating with Altered Cholesterol Homeostatic Gene Expression
To address whether HCD feeding affects cellular cholesterol accumulation in SC, we analyzed cellular cholesterol levels in SC from all three strains with and without HCD feeding. On HCD, SC total cholesterol was elevated in WT, SKO, and DKO mice by 1.8-, 1.8-, and 3.1-fold, respectively (Fig. 5a, p < 0.05). Likewise, free cholesterol was elevated by 7.5-fold (p < 0.05), 1.6-fold (non-significant), and 4.8-fold (p < 0.05), respectively (Fig. 5b). High cholesterol diet feeding also led to significantly reduced mRNA expression of Hmgr (Fig. 6a, p < 0.05) and Sqs (Fig. 5c, p < 0.05) in undifferentiated WT and DKO SC relative to their chow-fed controls (Fig. 5d, p < 0.05). However, expression of these same genes in SKO SC, which were already low, did not change further. Semiquantitatively, there was an increase in the staining of ABCA1 protein in undifferentiated SC from WT and DKO mice in response to HCD feeding (Fig. 6), whereas the signal is already high in chow-fed SKO SC and showed little change from the diet. Taken together, these changes indicated the presence of cholesterol homeostatic regulatory mechanisms in satellite cells. This pattern of presumed ABCA1 translocalization to the cell surface correlates with the observed changes in intracellular cholesterol (Fig. 5, a and b). ABCA1 is a cholesterol efflux transporter that is known to migrate from the Golgi to the cell surface with increased cellular cholesterol in other cell types (23, 24). The observed localization pattern indicates active homeostatic regulation of cholesterol content, a heretofore unexplored mechanism in satellite cells.
FIGURE 5.
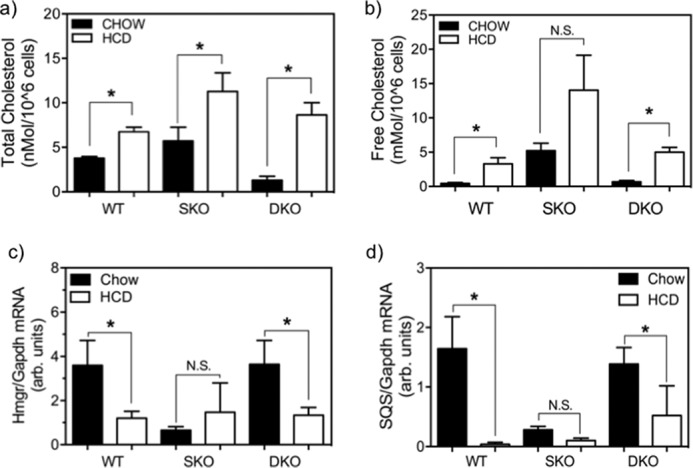
Total and free cholesterol quantification of primary satellite cells from age-matched, female DKO, SKO, and WT mice, comparing effects of HCD versus chow diet feedings. Data are mean ± S.E. (error bars); *, p < 0.05; n = 4–6 animals each by Student's t test. HCD feeding (open bars) elevated total cholesterol in SC from all three genotypes (WT, 1.8-fold; SKO, 2.0-fold; DKO, 6.7-fold) (a), free cholesterol in WT and DKO mice SC compared with chow-fed controls (filled bars) (WT, 7.45-fold; DKO, 7.41-fold) and reduced expression of cholesterol biosynthetic genes (b); Hmgr (WT, 3.0-fold; DKO, 2.7-fold) (c), and Sqs (WT, 43.1-fold; DKO, 2.7-fold) (d) in primary satellite cells from age-matched DKO, SKO, and WT mice versus chow (filled bars) diet-fed controls. N.S., not statistically significant.
FIGURE 6.

ABCA1 immunofluorescence staining in primary undifferentiated satellites cells isolated from chow-fed (top row) and HCD-fed (bottom row), age-matched female DKO (right), SKO (center), and WT (left) mice. Representative images are shown at ×400 magnification; red, ABCA1; blue, DAPI.
Direct ex Vivo Loading of Satellite Cell Cholesterol Suppresses the BAT Gene Program under Adipogenic Stimulation
We proceeded to further investigate whether the inhibition of BAT gene expression by dietary cholesterol in SC is a direct result of cholesterol loading, independent of the SC niche and other organismal factors. Treatment of DKO SC with a MCD-cholesterol complex during adipogenic culturing significantly altered cholesterol metabolism in the cells. Both total and free cholesterol were significantly increased in cells treated with the MCD-cholesterol complex (2.1- and 1.5-fold increase, respectively, p < 0.05; Fig. 7, a and b) relative to the MCD-only control. Cholesterol biosynthetic gene expression was significantly down-regulated relative to control cells, as measured by both Hmgr (Fig. 7c, p < 0.0001) and Sqs (Fig. 7d, p < 0.0001) expression. Upon subjecting the cholesterol-loaded cells to the 10-day adipogenic program, we observed a dramatic reduction in the expressions of both Ucp1 and Prdm16 mRNA (Fig. 8, a and b, p < 0.05) relative to the MCD-only controls as well as a significant reduction in UCP1+ cells (Fig. 8d, p = 0.01). On the other hand, the cholesterol-loaded cells continued to sustain ORO+ fat droplets and no change in Pparγ mRNA expression (Fig. 8e). As further validation, we examined the effect of cholesterol loading on BAT-selective genes Mpzl2, Ebf3, and Hspb7, previously shown to be overexpressed in quiescent DKO SC (Fig. 1d) and throughout the course of the adipogenic program (Fig. 4e), as well as beige fat-selective genes (Tmem26 and Klhl13), which were nearly undetectable in both cases. Expression of beige fat genes remained low and unchanged by cholesterol loading (Fig. 8f), whereas mRNA expression of Mpzl2 and Ebf3 were significantly reduced (both p = 0.04) and Hspb7 showed a strong trend of reduction (p = 0.06) relative to MCD-only controls. Altogether, these data strongly indicate that SC cholesterol content is a potent regulator of BAT gene expression during the adipogenic conversion process.
FIGURE 7.
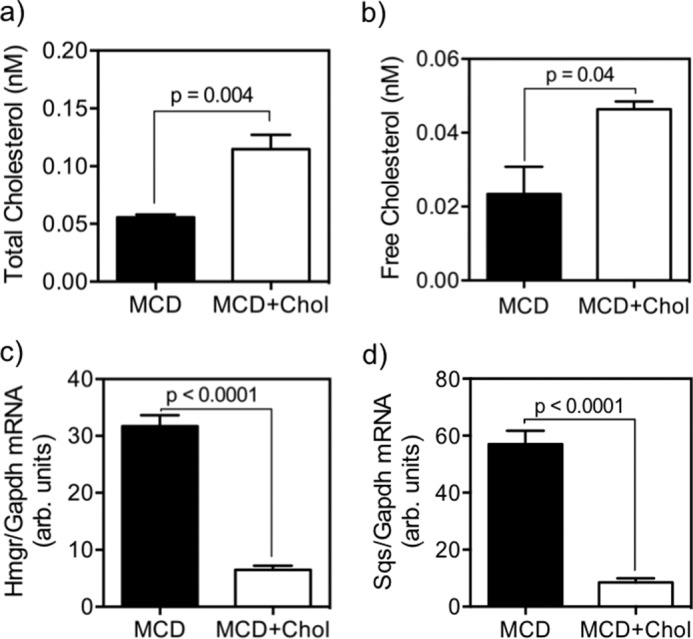
Cellular cholesterol concentrations and expression of cholesterol biosynthetic genes in SC from DKO mice, comparing the effect of ex vivo cholesterol loading with methylcyclodextrin-cholesterol complex (MCD+Chol, open bars) versus methylcyclodextrin-only controls (MCD, filled bars), after a 10-day adipogenic culture. Data are mean ± S.E. (error bars); n = 4–6 and analyses by Student's t test. MCD + cholesterol loading increased cellular levels of total cholesterol (2.1-fold; p = 0.004) (a) and free cholesterol (2.0-fold; p = 0.04) (b) and reduced mRNA levels of Hmgr (4.9-fold, p < 0.0001) (c) and Sqs (8.5-fold, p < 0.0001) (d).
FIGURE 8.

Effect of ex vivo cholesterol loading of chow-fed DKO satellite cells by methylcyclodextrin-cholesterol complex (MCD+Chol, open bars) versus methylcyclodextrin-only controls (MCD, filled bars) on changes in mRNA expressions of BAT genes (a and b) and adipogenicity (c–e). Data are mean ± S.E. (error bars). All analyses were by Student's t test. Each cell count is the sum of five low magnification fields of cultured cells from a single animal, n = 3–4 animals each. Shown are changes in Ucp1 (a), Prdm16 (b), ORO+ cells/100 nuclei (c), UCP1+ cells/100 nuclei (d), Pparγ (e), and BAT-selective (Mpzl2, Ebf3, and Hspb7) and beige-selective (Tmem26 and Klhl13) genes relative to controls (f). N.S., not statistically significant.
Quiescent Satellite Cells Are Inducible to BAT Differentiation ex Vivo in Response to Cholesterol Depletion Independent of LCAT Genotype
Direct ex Vivo Depletion of Cellular Cholesterol Can Increase BAT Gene Expression in SKO Satellite Cells
To test the hypothesis that reduction in cellular cholesterol directly up-regulates BAT gene expression in SC and BAT adipogenicity, as suggested by our in vivo data, we performed experiments to deplete intracellular cholesterol with HPCD in SC isolated from chow-fed SKO mice, a strain shown to have higher baseline cellular cholesterol (Fig. 5, a and b). HPCD treatment significantly reduced both total (Fig. 9a, p = 0.004) and free (Fig. 9b, p = 0.03) cholesterol in SKO SC relative to vehicle controls. Reduction of SC cholesterol resulted in increased brown adipogenesis, as measured by increased ORO+ cells (Fig. 9c, p = 0.06) and UCP1+ cells (Fig. 9d, p = 0.018). Cholesterol depletion also accelerated the rise of Pparγ mRNA expression during adipogenesis, with significantly higher levels observed in HPCD-treated cells at day 4 of adipogenic program, a time when Pparγ expression just begins to rise (Fig 10a). However, this increase is no longer observed by day 10 (Fig. 10a, p < 0.05). Correspondingly, cholesterol-depleted cells exhibited significantly increased Prdm16 expression (Fig. 10b) at day 4 (5.5-fold, p = 0.03) and day 10 (2.5 fold, p = 0.03) and higher Ucp1 mRNA expression after both 4 days and 10 days (Fig. 10c, p < 0.05) of adipogenic culturing. These data on early up-regulation of BAT genes and adipogenic gene indicate accelerated BAT adipogenesis in SKO SC in response to cellular cholesterol depletion. The effects of the HPCD treatment on cholesterol homeostasis were confirmed by significant increases in the expression of key cholesterol biosynthetic genes, such as Hmgr (Fig. 10d, p = 0.007) and Sqs (Fig. 10e, p = 0.005) after 10 days of culturing. As further confirmation that HPCD treatment indeed induces SKO SC to brown adipocytes as opposed to beige-like cells, we quantified key BAT-selective and beige-selective markers, as noted previously with quiescent and differentiated DKO SC. We again observed extremely low levels of beige markers Tmem26 and Klhl13, both of which showed no response to cholesterol depletion versus controls (Fig. 10f). However, the BAT-selective gene Ebf3 showed a significant increase after HPCD treatment (p = 0.046), whereas BAT marker Mpzl2 and Hspb7 showed a trend of increase as well (p = 0.07). In all cases, expression of classical BAT-selective genes is highly abundant, whereas expression of beige-selective genes remains extremely low.
FIGURE 9.
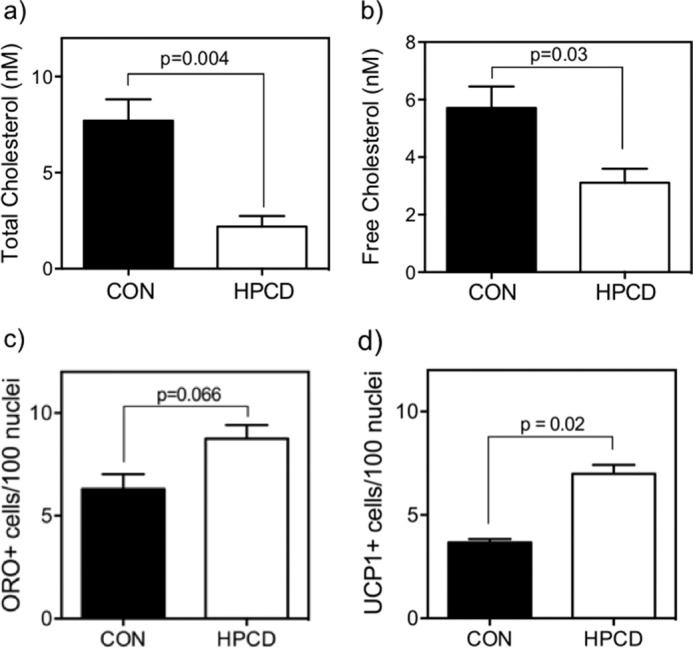
Depletion of cholesterol in chow-fed SKO satellite cells by HPCD treatment during a 10-day adipogenic culturing protocol results in reduced total cholesterol (p = 0.004) (a), free cholesterol (p = 0.03) relative to controls (b), a trend of increase in ORO+ cells/100 nuclei relative to vehicle control (1.3-fold, p = 0.066) (c), and a significant 1.8-fold increase in UCP1+ cells/100 nuclei by immunofluorescence (p = 0.02) (d). All analyses were by Student's t test (n = 4 animals each). Error bars, S.E.
FIGURE 10.

Effect of cell cholesterol depletion of chow-fed SKO primary satellite cells by HPCD treatment on mRNA expression of Pparγ (a), BAT genes Prdm16 and Ucp1 at both days 4 and 10 of a 10-day adipogenic culturing program (b and c), Hmgr (d), Sqs (e), and BAT-selective (Mpzl2, Ebf3, and Hspb7) and beige-selective (Tmem26 and Klhl13) gene expressions (f) at day 10 of the same 10-day adipogenic culturing program. All data are expressed as mean ± S.E. (error bars) versus vehicle controls (CON) at each time point; *, significantly different gene expression between treatments at a given time point by Student's t test (n = 5 animals).
Quiescent SC from LCAT-KO Mice Overexpress BAT Genes and Are More Susceptible to SC-to-BAT Differentiation
We previously reported a gender-dependent protection from diet-induced obesity in LCAT null mice, albeit at a more modest level when compared with the DKO mice (12). We here characterize the role of LCAT deficiency per se in the SC-to-BAT phenotypes observed in DKO mice, both in quiescent SC and in the induction of SC to brown adipocytes in response to cholesterol depletion upon treatment with adipogenic medium.
Compared with their age-matched WT controls, LCAT-KO SC were found to express significantly higher Ucp1 mRNA (Fig 11e) and exhibited a trend toward higher Prdm16 expression (Fig. 11f, p = 0.06) but no significant change in Pparγ mRNA expression (Fig. 11g). Although quiescent SC from LCAT-KO express BAT genes, as seen in DKO, the absence of increased Pparγ expression raises the question of whether these cells display an increase in adipogenicity. After 10 days of treatment with adipogenic medium, quiescent LCAT-KO SC showed higher adipogenicity on the basis of increased ORO+ (Fig. 11a, p = 0.05) and UCP1+ immunofluorescent cells (Fig. 11b, p = 0.05) when compared with their WT controls. Most interestingly, total and free cellular cholesterol levels in LCAT-KO SC were found to be higher than their WT controls (Fig. 11, c (p = 0.05) and d (p = 0.03)), suggesting that LCAT deficiency per se is sufficient to promote BAT gene expression in quiescent SC and promote accelerated adipogenesis, at least upon treatment with adipogenic medium ex vivo.
FIGURE 11.

Characterization of the effect of LCAT deficiency on brown adipogenicity and cellular cholesterol content of quiescent satellite cells. SC from LCAT-KO mice showed increased adipogenicity as measured by ORO+ cells/100 nuclei (a) and UCP1+ cells/100 nuclei by immunofluorescence (b), with higher total cholesterol (c) and free cholesterol (d) and increased mRNA expression of Ucp1 (e) and Prdm16 (f) but not Pparγ (g) in quiescent undifferentiated satellite cells relative to WT controls. All analyses were done by Student's t test (n = 4 animals) relative to chow-fed WT controls. N.S., not statistically significant. Error bars, S.E.
Direct ex Vivo Depletion of LCAT SC Can Up-regulate BAT Gene Expression and Increase the Rate of SC-to-BAT Adipogenesis
Given the apparent role of LCAT deficiency in promoting brown adipogenesis, we looked to investigate whether ex vivo depletion of LCAT-KO SC cholesterol may modulate SC-to-BAT adipogenesis. We treated the SC with HPCD to deplete cellular cholesterol before subjecting them to the 10-day adipogenic medium treatment. We observed that HPCD treatment was sufficient to significantly lower total cholesterol (Fig. 12a, p = 0.0004) and cause a trend of reduction in free cholesterol (Fig. 12b, p = 0.06) relative to vehicle controls. This resulted in further increased brown adipogenicity with significantly higher ORO+ (Fig. 12c, p = 0.04) and UCP1+ immunofluorescent cells (Fig. 12d, p = 0.02). Cholesterol depletion of LCAT-KO SC also resulted in significantly higher mRNA expression of Ucp1 (Fig. 12e, p = 0.02) and Prdm16 (Fig. 12f, p = 0.01) but no change in Pparγ expression (Fig. 12g). We also determined whether cholesterol depletion in LCAT-KO SC activates beige fat genes. Expression of beige-selective genes remained extremely low, with no change resulting from cholesterol depletion. On the other hand, the BAT-selective genes were found to be elevated, but the degrees were highly variable after HPCD treatment (Fig. 12g).
FIGURE 12.

Effect of cholesterol depletion of LCAT-KO satellite cells by HPCD treatment during a 10-day adipogenic culturing protocol. HPCD treatment resulted in significantly lower total cholesterol (p = 0.0004) (a) and a trend of reduced free cholesterol (p = 0.06) (b), coinciding with increased adipogenicity as measured by ORO+ cells/100 nuclei (c) and UCP1+ cells/100 nuclei (d) by immunofluorescence relative to vehicle-treated LCAT-KO SC. HPCD treatment elevated mRNA expression of BAT genes Ucp1 and Prdm16 (e and f) but not Pparγ (g) and also altered expression of BAT-selective gene Ebf3 (h), but the beige-selective genes Tmem26 and Klhl13 remained undetectable. All analyses were by Student's t test (n = 4–5 animals). N.S., not statistically significant. Error bars, S.E.
Brown Adipocytes Derived from Satellite Cells Are Thermogenically Active
Brown Adipocytes Derived from LCAT Null Mouse SC Display Increased Cellular Respiration
To address whether the BAT-like cells derived from SC of both LCAT strains, namely the DKO and LCAT-KO mice, are functional thermogenically, we tested and compared the O2 consumption rates of the post-differentiated cells from the four strains of mice. As seen in Fig. 13, first, the O2 consumption rates of differentiated cells from SKO mice were not significantly different from that of the WT. On the other hand, those derived from LCAT-KO and DKO SC were found to display an elevated respiration rate when compared with their respective controls, and the -fold induction is markedly greater in DKO mouse cells (Fig. 13a) The -fold inductions of respiration rates in each of the LCAT-deficient strains against their respective controls correlate well with the corresponding adipogenicity assays.
FIGURE 13.
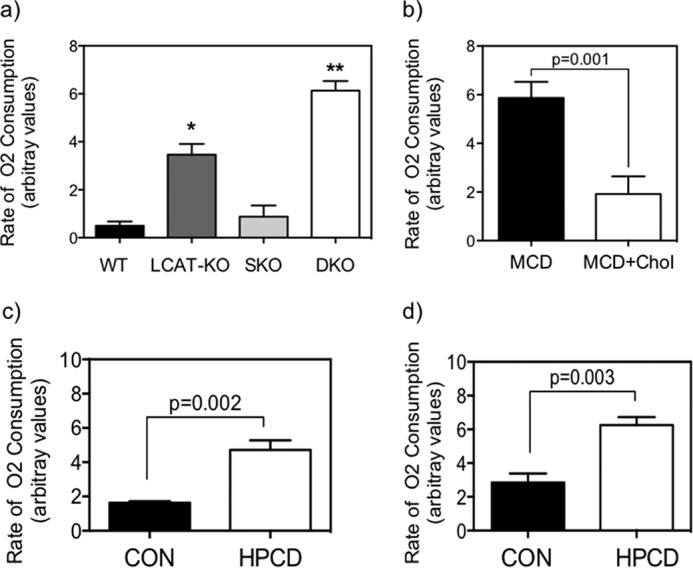
Functional analysis of BAT derived from untreated and treated satellite cells after 10-day adipogenic differentiation. Cellular respiration was significantly increased in BAT derived from LCAT-KO SC (versus WT or SKO) (a) and in BAT derived from DKO SC (versus all three other groups) (b); *, significantly higher than WT and SKO; **, significantly higher than all other genotypes, ANOVA, p < 0.05 (n = 4 animals). b, cholesterol loading of DKO SC suppressed cellular respiration (p = 0.001) relative to MCD-only controls, whereas HPCD-mediated cholesterol depletion increased cellular respiration rates in SKO (p = 0.002) (c) and LCAT-KO (p = 0.003) (d) differentiated SC, as measured by Student's t test (n = 4 animals).
Thermogenic Functions of SC-derived BAT Are Regulated by Cellular Cholesterol of SC
We next tested whether altered adipogenicity in response to cellular cholesterol alterations modulates the thermogenic function of differentiated SC. Cholesterol loading of DKO SC by MCD + cholesterol complex treatment significantly reduced the cellular respiration rate (Fig. 13b, p = 0.01) when compared with MCD-only controls, in keeping with the cholesterol-mediated reduction in ORO+, UCP1+, and key BAT genes (Fig. 8). Conversely, ex vivo cholesterol depletion by HPCD treatment resulted in increased cellular respiration rates for SC from both SKO (Fig. 13c, p = 0.002) and LCAT-KO mice (Fig. 13d, p = 0.003), consistent with the observed effects of cholesterol depletion on increased adipogenicity and BAT gene expression (Figs. 9, 10, and 12). Taken together, our findings reveal that LCAT deficiency per se results primarily in the priming of BAT gene expression in quiescent SC, resulting in an increased propensity to undergo SC-to-BAT adipogenicity. This process is further accentuated upon depletion of cellular cholesterol, either endogenously via deletion of LDL receptors or exogenously through HPCD-induced depletion SC cholesterol. Concurrent deletion of the LDL receptor gene (as in DKO mice) results in the highest induction of SC-to-BAT adipogenicity, in part through priming of the expressions of the BAT genes Prdm16 and Ucp1 and the adipogenic gene Pparγ, resulting in the highest adipocyte differentiation rate in adipogenic medium and postdifferentiated O2 consumption rates.
Discussion
In this study, we have expanded the investigation of our novel observations of ectopic interfiber BAT in the skeletal muscle of chow-fed Ldlr−/−xLcat−/− mice. By focusing on female animals to avoid the confounding gender effect, here for the first time, we have provided experimental evidence that the ectopic BAT is of classical origin, and the differentiation probably begins in utero. We are also the first to report that quiescent satellite cells from adult DKO mice overexpress Ucp1 and Prdm16 and are significantly more inducible to differentiate into brown adipose tissue ex vivo and that this induction is modulated by intracellular cholesterol content. Ex vivo analyses on primary SC from DKO, LCAT-KO strains, and their respective controls revealed that (i) LCAT deficiency per se is sufficient to prime the quiescent SC to express BAT genes and their predisposition to SC-to-BAT differentiation upon adipogenic stimulation, (ii) cell cholesterol depletion in SC from LCAT-KO as well as in SKO is sufficient to promote SC-to-BAT differentiation in response to adipogenic stimulation; (iii) functionality of SC-derived BAT ex vivo correlates with adipogenicity, the latter quantified by ORO-positive and UCP1-positive cells. These findings may provide a novel opportunity for BAT recruitment from adult muscle fiber progenitors via modulation of cellular cholesterol content.
Lineage tracking studies have suggested a shared developmental path between PAX7+ satellite cells and myf5+ myoblasts. However, only PAX7+ cells marked specifically between embryonic days 9.5 and 12.5 develop into mature BAT in adults (22), suggesting the presence of a time window in fetal development during which PAX7+ satellite cells can be induced to spontaneously undergo BAT differentiation. Marked up-regulation of Mpzl2, Ebf3, and Hspb7, each highly selective for classical BAT lineage, and virtually undetectable levels of Tmem26 and Klhl13, two selective markers for beige fat, in the skeletal muscle of newborn and chow-fed adult DKO mice, strongly support a classical lineage of ectopic BAT. This is further complemented by detection of high Ucp1 expression in skeletal muscle of the newborn DKO mice, indicating that ectopic BAT development begins in utero.
In the current study, we have provided several lines of experimental evidence supporting a role of PAX7+ satellite cells as the probable progenitors for ectopic BAT in DKO mice, including (i) co-localization of PAX7 and UCP1 proteins in sublaminar cells and (ii) a marked increase in mRNA expression of key classical BAT-selective signature genes (Mpzl2, Ebf3, and Hspb7) and BAT program genes (Ucp1 and Prdm16) in primary undifferentiated SC. Based on the recent report that SC in C57Bl/6 mice treated with anti-miR133 upon injury-induced activation undergo differentiation into functioning BAT in the adipogenic medium (11), we hypothesized that the adult satellite cells from chow-fed DKO mice are also primed to be BAT-inducible. By employing the same 10-day adipogenic medium treatment protocol (1, 11), we found that primary SC from DKO mice indeed displayed increased adipogenicity, encompassing the features of (i) increased Pparγ expression in both quiescent and differentiated SC; (ii) marked elevation in fat droplets and higher abundance of UCP1-expressing cells, both of which are key markers of brown adipocytes (11, 25); and (iii) increased cellular respiration, strongly suggesting that the brown adipoctyes are functional and thermogenically active. Importantly, the SC-to-BAT differentiation occurs independently of injury-mediated SC activation. We posit that the spontaneous up-regulation of BAT genes in DKO satellite cells results from the altered metabolic milieu caused by combined deletion of Ldlr and Lcat genes.
LCAT deficiency has been shown to modulate multiple lipid species in tissues (12, 13, 26, 27). Recently, our laboratory reported that, under chow-fed conditions, concomitant deletion of Lcat and Ldlr results in a reversal of the excess dietary cholesterol uptake and hepatic tissue and hepatic ER cholesterol accumulation seen in LDL receptor-deficient mice (13). This reversal of cholesterol dysregulation was further linked to the resolution of hepatic ER stress and insulin resistance (13). This tissue cholesterol-lowering effect led us to hypothesize that cellular cholesterol levels in the satellite cells, a putative progenitor for the ectopic BAT, might also be altered and play an important modulatory role in the priming and activation of BAT gene expressions. Quantification of cellular cholesterol from primary SC revealed elevated cellular cholesterol in chow-fed SKO mice relative to WT control and a markedly reduced level in DKO mice, a pattern of changes remarkably similar to those seen in the liver (13). The increase in SC cholesterol in high cholesterol diet-fed mice and their corresponding changes in Hmgr and Sqs gene expression suggest that SC cholesterol is strongly modulated by exogenous cholesterol and is independent of LDL receptor. By immunofluorescence analyses, we observed changes in cellular abundance and localization of satellite cell ABCA1 in response to increased cholesterol from HCD feeding, indicating a built-in efflux mechanism as part of the satellite cell cholesterol homeostatic system. Physiologically, the increase in SC cholesterol in HCD-fed DKO mice was associated with a dramatic loss of Ucp1 and Prdm16 expression, a response also observed in HCD-fed DKO whole hind limb skeletal muscle. Taken together, our in vivo and ex vivo studies strongly indicate that altered SC cholesterol is sufficient to modulate the BAT gene program in DKO SC and possibly the inducibility of SC to differentiate into BAT.
To elucidate the relative role of LCAT deficiency per se in the SC-to-BAT differentiation phenotypes seen in the DKO mice, we find that LCAT-KO mice display a phenotype that is similar to but more modest than that of DKO mice in the priming of BAT gene expressions. Undifferentiated LCAT-KO SC overexpress key classical BAT genes and markers despite a modest increase in cellular cholesterol. Therefore, our findings suggest that LCAT deficiency plays a role in the activation of BAT genes spontaneously in quiescent SC, independent of its cellular cholesterol status. The observed modest degree of protection of female LCAT null mice from diet-induced obesity (12) suggests that the primed SC in LCAT-KO mice may also be inducible to form ectopic BAT, as supported by the increased cellular respiration rate of adipogenically differentiated SC from LCAT-KO.
Given the suppression of DKO BAT gene expression by HCD feeding, we investigated whether SC-to-BAT differentiation can be modulated directly by satellite cell cholesterol content, independent of its in vivo stem cell niche. In the case of DKO mouse SC, which exhibit a reduced cholesterol level in the quiescent state, the ex vivo increase of cellular cholesterol by methylcyclodextrin loading recapitulated the effects of diet feeding on satellite cell cholesterol content and resulted in loss of Prdm16 and Ucp1 expression as well as strongly reduced cellular respiration. This clearly supports the specific role of intracellular cholesterol in regulating the brown fat gene program. We further hypothesize that cellular cholesterol lowering is sufficient to activate BAT gene expression, independent of the presence or absence of LCAT. Ex vivo depletion of cholesterol in SC from SKO and its effect on BAT gene expression and adipogenicity appear to support this hypothesis, although the mechanistic relevance of LDL receptor deletion remains to be fully elucidated. Cholesterol depletion up-regulated cholesterol biosynthetic genes as expected and, most importantly, increased expression of Ucp1 and Prdm16 and induced a marked increase in cellular respiration rate. To address whether the effect of cholesterol depletion synergizes with the BAT-activating phenotype of LCAT deficiency, we subjected primary SC from LCAT-KO mice to the same exogenous cholesterol depletion protocol. We observed accentuated SC-to-BAT adipogenicity with increased abundance of ORO+ and UCP1+ cells and an associated increase in respiration rate.
Taken together, our ex vivo manipulations further reinforce what was observed after HCD feeding; cellular cholesterol regulates satellite cell expression of BAT program genes. Reduced cellular cholesterol, either endogenously, as in DKO SC, or exogenously, as in our HPCD-treated SKO SC and LCAT-KO, promotes Prdm16 expression and brown adipogenesis, as observed by accelerated Pparγ up-regulation as well as increased fat droplet content. On the other hand, excess cellular cholesterol from exogenous sources selectively suppresses BAT program gene expression without diminishing markers of adipogenesis. This phenotype of dissociation between BAT gene expression and adipogenesis is remarkably similar to a recent report of selective BAT gene program suppression in brown adipogenesis in the absence of EBF2 (28, 29), although the physiological significance of this observation requires further exploration. Our combined in vivo and ex vivo data strongly suggest an important role for cellular cholesterol metabolism in the regulation of BAT gene Prdm16 and Ucp1 expressions and the differentiation of adult satellite cells into functional BAT.
The precise mechanism by which cellular cholesterol regulates the conversion of satellite cells to brown adipocytes is currently unknown. The key axis of BAT gene activation occurs via the suppression of miR133, which regulates Prdm16, the primary transcriptional activator of Ucp1 expression (11, 30), and cholesterol may regulate miR133 via PKA-mediated Mef2C up-regulation (30). Alternatively, because EBF2 and PRDM16 have both been shown to be sufficient to induce BAT differentiation and the “beiging” of white fat, and Pparγ is crucial for adipogenesis, further studies to address the role of this transcriptional network (31) and its interaction with cellular cholesterol metabolism in the modulation of SC-to-BAT differentiation is warranted. Additionally, gender-specific expression of cholesterol metabolism via estrogen-sensitive regulation of SRBI and other cholesterol homeostatic proteins has been reported in the literature (32–36), providing a possible mechanism for the exaggerated phenotype that we have reported previously in our female DKO model (12, 13); however, this requires further exploration to identify a causal linkage.
In summary, this study provides the first evidence that spontaneous ectopic BAT in Lcat/Ldlr double-null mice is classical in lineage. We are also the first to show that mature satellite cells in this strain are primed to undergo transdifferentiation into BAT and that this process is strongly modulated by cellular cholesterol. We also demonstrated that depletion of cellular cholesterol in SC, at least in LDLR null mice, is sufficient to recapitulate the effect of LCAT deficiency on BAT gene program induction and enhanced adipogenicity as seen in DKO SC. Likewise, LCAT deficiency per se is sufficient to prime the SC to overexpress BAT genes and become BAT-inducible, whereas cellular cholesterol depletion synergistically accentuates the adipogenicity. Together, our data provide the basis for the development of a model of BAT induction through modulation of the lipid milieu of SC. Given the therapeutic applicability of increased brown adipogenesis and the relative lack of knowledge regarding BAT differentiation from myodermal precursors compared with beige fat conversion, this study yields an important avenue of study for potential treatment of obesity and numerous other metabolic disease states.
Author Contributions
D. N. co-designed the study, performed the experiments, and analyzed the data displayed in all figures and co-wrote the manuscript. G. T. established preliminary studies and methods, provided technical support, and contributed to experiments displayed in Figs. 1b and 2–6. D. K. contributed to experiments displayed in Figs. 3 and 7. A. B. contributed to experiments in Figs. 6–8. R. A. performed preliminary studies and performed the experiments and analyzed the data presented in Fig. 1 (a, d, and e). D. S. N. conceived the project, co-designed the study, analyzed the data in all figures, and co-wrote the manuscript. All authors reviewed the results and approved the final version of the manuscript.
This work was supported by a Banting & Best Diabetes Centre Fellowship in Diabetes Care (funded by Eli Lilly and Boehringer Ingelheim) (to D. N.) and Canadian Institutes of Health Research Operating Grant MOP 275369 (to D. S. N.). The authors declare that they have no conflicts of interest with the contents of this article.
- BAT
- brown adipose tissue
- DKO
- double knock-out
- SKO
- single knock-out
- LCAT
- lecithin:cholesterol acyltransferase
- MCD
- methyl-β-cyclodextrin
- HPCD
- hydroxypropyl-β-cyclodextrin
- ORO
- Oil Red O
- HCD
- high cholesterol diet
- SC
- satellite cell(s)
- ANOVA
- analysis of variance.
References
- 1.Seale P., Bjork B., Yang W., Kajimura S., Chin S., Kuang S., Scimè A., Devarakonda S., Conroe H. M., Erdjument-Bromage H., Tempst P., Rudnicki M. A., Beier D. R., and Spiegelman B. M. (2008) PRDM16 controls a brown fat/skeletal muscle switch. Nature 454, 961–967 [DOI] [PMC free article] [PubMed] [Google Scholar]
- 2.Seale P., Conroe H. M., Estall J., Kajimura S., Frontini A., Ishibashi J., Cohen P., Cinti S., and Spiegelman B. M. (2011) Prdm16 determines the thermogenic program of subcutaneous white adipose tissue in mice. J. Clin. Invest. 121, 96–105 [DOI] [PMC free article] [PubMed] [Google Scholar]
- 3.Wu J., Cohen P., and Spiegelman B. M. (2013) Adaptive thermogenesis in adipocytes: is beige the new brown? Genes Dev. 27, 234–250 [DOI] [PMC free article] [PubMed] [Google Scholar]
- 4.Wu J., Boström P., Sparks L. M., Ye L., Choi J. H., Giang A.-H., Khandekar M., Virtanen K. A., Nuutila P., Schaart G., Huang K., Tu H., van Marken Lichtenbelt W. D., Hoeks J., Enerbäck S., Schrauwen P., and Spiegelman B. M. (2012) Beige adipocytes are a distinct type of thermogenic fat cell in mouse and human. Cell 150, 366–376 [DOI] [PMC free article] [PubMed] [Google Scholar]
- 5.Cypess A. M., Lehman S., Williams G., Tal I., Rodman D., Goldfine A. B., Kuo F. C., Palmer E. L., Tseng Y.-H., Doria A., Kolodny G. M., and Kahn C. R. (2009) Identification and importance of brown adipose tissue in adult humans. N. Engl. J. Med. 360, 1509–1517 [DOI] [PMC free article] [PubMed] [Google Scholar]
- 6.Virtanen K. A., Lidell M. E., Orava J., Heglind M., Westergren R., Niemi T., Taittonen M., Laine J., Savisto N.-J., Enerbäck S., and Nuutila P. (2009) Functional brown adipose tissue in healthy adults. N. Engl. J. Med. 360, 1518–1525 [DOI] [PubMed] [Google Scholar]
- 7.van Marken Lichtenbelt W. D., Vanhommerig J. W., Smulders N. M., Drossaerts J. M. A. F. L., Kemerink G. J., Bouvy N. D., Schrauwen P., and Teule G. J. J. (2009) Cold-activated brown adipose tissue in healthy men. N. Engl. J. Med. 360, 1500–1508 [DOI] [PubMed] [Google Scholar]
- 8.Yoneshiro T., and Saito M. (2015) Activation and recruitment of brown adipose tissue as anti-obesity regimens in humans. Ann. Med. 47, 133–141 [DOI] [PubMed] [Google Scholar]
- 9.Elattar S., and Satyanarayana A. (2015) Can brown fat win the battle against white fat? J. Cell. Physiol., 230, 2311–2317 [DOI] [PMC free article] [PubMed] [Google Scholar]
- 10.Cereijo R., Giralt M., and Villarroya F. (2015) Thermogenic brown and beige/brite adipogenesis in humans. Ann. Med. 47, 169–177 [DOI] [PubMed] [Google Scholar]
- 11.Yin H., Pasut A., Soleimani V. D., Bentzinger C. F., Antoun G., Thorn S., Seale P., Fernando P., van Ijcken W., Grosveld F., Dekemp R. A., Boushel R., Harper M.-E., and Rudnicki M. A. (2013) MicroRNA-133 controls brown adipose determination in skeletal muscle satellite cells by targeting Prdm16. Cell Metab. 17, 210–224 [DOI] [PMC free article] [PubMed] [Google Scholar]
- 12.Li L., Hossain M. A., Sadat S., Hager L., Liu L., Tam L., Schroer S., Huogen L., Fantus I. G., Connelly P. W., Woo M., and Ng D. S. (2011) Lecithin cholesterol acyltransferase null mice are protected from diet-induced obesity and insulin resistance in a gender-specific manner through multiple pathways. J. Biol. Chem. 286, 17809–17820 [DOI] [PMC free article] [PubMed] [Google Scholar]
- 13.Hager L., Li L., Pun H., Liu L., Hossain M. A., Maguire G. F., Naples M., Baker C., Magomedova L., Tam J., Adeli K., Cummins C. L., Connelly P. W., and Ng D. S. (2012) Lecithin:cholesterol acyltransferase deficiency protects against cholesterol-induced hepatic endoplasmic reticulum stress in mice. J. Biol. Chem. 287, 20755–20768 [DOI] [PMC free article] [PubMed] [Google Scholar]
- 14.Kuivenhoven J. A., Pritchard H., Hill J., Frohlich J., Assmann G., and Kastelein J. (1997) The molecular pathology of lecithin:cholesterol acyltransferase (LCAT) deficiency syndromes. J. Lipid Res. 38, 191–205 [PubMed] [Google Scholar]
- 15.Ng D. S. (2012) The role of lecithin:cholesterol acyltransferase in the modulation of cardiometabolic risks: a clinical update and emerging insights from animal models. Biochim. Biophys. Acta 1821, 654–659 [DOI] [PubMed] [Google Scholar]
- 16.Song H., Zhu L., Picardo C. M., Maguire G., Leung V., Connelly P. W., and Ng D. S. (2006) Coordinated alteration of hepatic gene expression in fatty acid and triglyceride synthesis in LCAT-null mice is associated with altered PUFA metabolism. Am. J. Physiol. Endocrinol. Metab. 290, E17–E25 [DOI] [PubMed] [Google Scholar]
- 17.Ng D. S., Francone O. L., Forte T. M., Zhang J., Haghpassand M., and Rubin E. M. (1997) Disruption of the murine lecithin: cholesterol acyltransferase gene causes impairment of adrenal lipid delivery and up-regulation of scavenger receptor class B type I. J. Biol. Chem. 272, 15777–15781 [DOI] [PubMed] [Google Scholar]
- 18.Nikolaou S., Peterson E., Kim A., Wylie C., and Cornwall R. (2011) Impaired growth of denervated muscle contributes to contracture formation following neonatal brachial plexus injury. J. Bone Joint Surg. Am. 93, 461–470 [DOI] [PubMed] [Google Scholar]
- 19.Machado R. M., Nakandakare E. R., Quintao E. C. R., Cazita P. M., Koike M. K., Nunes V. S., Ferreira F. D., Afonso M. S., Bombo R. P. A., Machado-Lima A., Soriano F. G., Catanozi S., and Lottenberg A. M. (2012) ω-6 polyunsaturated fatty acids prevent atherosclerosis development in LDLr-KO mice, in spite of displaying a pro-inflammatory profile similar to trans fatty acids. Atherosclerosis 224, 66–74 [DOI] [PubMed] [Google Scholar]
- 20.Danoviz M. E., and Yablonka-Reuveni Z. (2012) Skeletal muscle satellite cells: background and methods for isolation and analysis in a primary culture system. Methods Mol. Biol. 798, 21–52 [DOI] [PMC free article] [PubMed] [Google Scholar]
- 21.Livak K. J., and Schmittgen T. D. (2001) Analysis of relative gene expression data using real-time quantitative PCR and the 2-ΔΔCT method. Methods 25, 402–408 [DOI] [PubMed] [Google Scholar]
- 22.Lepper C., and Fan C.-M. (2010) Inducible lineage tracing of Pax7-descendant cells reveals embryonic origin of adult satellite cells. Genesis 48, 424–436 [DOI] [PMC free article] [PubMed] [Google Scholar]
- 23.Neufeld E. B., Remaley A. T., Demosky S. J., Stonik J. A., Cooney A. M., Comly M., Dwyer N. K., Zhang M., Blanchette-Mackie J., Santamarina-Fojo S., and Brewer H. B. (2001) Cellular localization and trafficking of the human ABCA1 transporter. J. Biol. Chem. 276, 27584–27590 [DOI] [PubMed] [Google Scholar]
- 24.Kang M. H., Zhang L.-H., Wijesekara N., de Haan W., Butland S., Bhattacharjee A., and Hayden M. R. (2013) Regulation of ABCA1 protein expression and function in hepatic and pancreatic islet cells by miR-145. Arterioscler. Thromb. Vasc. Biol. 33, 2724–2732 [DOI] [PubMed] [Google Scholar]
- 25.Kajimura S., and Saito M. (2014) A new era in brown adipose tissue biology: molecular control of brown fat development and energy homeostasis. Annu. Rev. Physiol. 76, 225–249 [DOI] [PMC free article] [PubMed] [Google Scholar]
- 26.Aoki J. (2004) Mechanisms of lysophosphatidic acid production. Semin. Cell Dev. Biol. 15, 477–489 [DOI] [PubMed] [Google Scholar]
- 27.Subramanian V. S., Goyal J., Miwa M., Sugatami J., Akiyama M., Liu M., and Subbaiah P. V. (1999) Role of lecithin-cholesterol acyltransferase in the metabolism of oxidized phospholipids in plasma: studies with platelet-activating factor-acetyl hydrolase-deficient plasma. Biochim. Biophys. Acta 1439, 95–109 [DOI] [PubMed] [Google Scholar]
- 28.Rajakumari S., Wu J., Ishibashi J., Lim H.-W., Giang A.-H., Won K.-J., Reed R. R., and Seale P. (2013) EBF2 determines and maintains brown adipocyte identity. Cell Metab. 17, 562–574 [DOI] [PMC free article] [PubMed] [Google Scholar]
- 29.Wang W., Kissig M., Rajakumari S., Huang L., Lim H.-W., Won K.-J., and Seale P. (2014) Ebf2 is a selective marker of brown and beige adipogenic precursor cells. Proc. Natl. Acad. Sci. U.S.A. 111, 14466–14471 [DOI] [PMC free article] [PubMed] [Google Scholar]
- 30.Trajkovski M., Ahmed K., Esau C. C., and Stoffel M. (2012) MyomiR-133 regulates brown fat differentiation through Prdm16. Nat. Cell Biol. 14, 1330–1335 [DOI] [PubMed] [Google Scholar]
- 31.Lynes M. D., and Tseng Y.-H. (2014) Unwiring the transcriptional heat circuit. Proc. Natl. Acad. Sci. U.S.A. 111, 14318–14319 [DOI] [PMC free article] [PubMed] [Google Scholar]
- 32.Catalano G., Duchene E., Julia Z., Le Goff W., Bruckert E., Chapman M. J., and Guerin M. (2008) Cellular SR-BI and ABCA1-mediated cholesterol efflux are gender-specific in healthy subjects. J. Lipid Res. 49, 635–643 [DOI] [PubMed] [Google Scholar]
- 33.Oosthuyse T., and Bosch A. N. (2012) Oestrogen's regulation of fat metabolism during exercise and gender specific effects. Curr. Opin. Pharmacol. 12, 363–371 [DOI] [PubMed] [Google Scholar]
- 34.Lopez D., Sanchez M. D., Shea-Eaton W., and McLean M. P. (2002) Estrogen activates the high-density lipoprotein receptor gene via binding to estrogen response elements and interaction with sterol regulatory element binding protein-1A. Endocrinology 143, 2155–2168 [DOI] [PubMed] [Google Scholar]
- 35.Kavanagh K., Davis M. A., Zhang L., Wilson M. D., Register T. C., Adams M. R., Rudel L. L., and Wagner J. D. (2009) Estrogen decreases atherosclerosis in part by reducing hepatic acyl-CoA:cholesterol acyltransferase 2 (ACAT2) in monkeys. Arterioscler. Thromb. Vasc. Biol. 29, 1471–1477 [DOI] [PMC free article] [PubMed] [Google Scholar]
- 36.De Marinis E., Martini C., Trentalance A., and Pallottini V. (2008) Sex differences in hepatic regulation of cholesterol homeostasis. J. Endocrinol. 198, 635–643 [DOI] [PubMed] [Google Scholar]