

Abstract
Mesothelioma is a form of cancer generally caused from previous exposure to asbestos. Although it was considered a rare neoplasm in the past, its incidence is increasing worldwide due to extensive use of asbestos. In the current practice of medicine, the gold standard for diagnosing mesothelioma is through a pleural biopsy with subsequent histologic examination of the tissue. The diagnostic tissue should demonstrate the invasion by the tumor and is obtained through thoracoscopy or open thoracotomy, both being highly invasive surgical operations. On the other hand, thoracocentesis, which is removal of effusion fluid from the pleural space, is a far less invasive procedure that can provide material for cytological examination. In this study, we aim at detecting and classifying malignant mesothelioma based on the nuclear chromatin distribution from digital images of mesothelial cells in effusion cytology specimens. Accordingly, a computerized method is developed to determine whether a set of nuclei belonging to a patient is benign or malignant. The quantification of chromatin distribution is performed by using the optimal transport-based linear embedding for segmented nuclei in combination with the modified Fisher discriminant analysis. Classification is then performed through a k-nearest neighborhood approach and a basic voting strategy. Our experiments on 34 different human cases result in 100% accurate predictions computed with blind cross validation. Experimental comparisons also show that the new method can significantly outperform standard numerical feature-type methods in terms of agreement with the clinical diagnosis gold standard. According to our results, we conclude that nuclear structure of mesothelial cells alone may contain enough information to separate malignant mesothelioma from benign mesothelial proliferations.
Keywords: mesothelioma, chromatin distribution, cancer detection, nuclear structure, cytology, optimal transport
Malignant mesothelioma, a type of cancer in the lung, is a universally fatal disease with an increasing incidence worldwide (1). Mesothelioma is generally caused by previous exposure to asbestos. Millions of people are exposed to asbestos every year and more than one hundred thousand people die each year across the globe from asbestos-related diseases, with approximately three thousand new mesothelioma cases each year in the United States alone (2). Although the incidence in the U.S. peaked in 2010, predicted peak years for European and Eastern countries are still to come (3,4). These predictions are based on historical statistics and the clinical nature of mesothelioma, that is, mesothelioma usually develops 20–50 years after asbestos exposure. Moreover, the risk for developing mesothelioma varies with the type of asbestos exposure. For example, crocidolite, which is no longer mined in the U.S., is 500 times more toxic than chrysotile (5). Malignant mesothelioma can also occur due to less common causes such as radiation, viruses (e.g., Simian virus 40) and germline mutations in BAP-1 (6–8).
Mesothelioma cancer cells originate from mesothelium, which is a membrane that forms the outer lining of the lung. In mesothelioma, these cells become abnormal and divide without control or order. Histologically, mesothelioma can be categorized in to three major types: epithelioid type, sarcomatoid type, and biphasic type and the incidence of each is approximately 60, 20, and 20%, respectively (9). Regardless of the histological type, they invade nearby tissues and organs, which lead to a high mortality rate with a short survival period (10). Various studies reported the median survival of a patient diagnosed with mesothelioma between 6 and 18 months (11,12). These grim statistics reflect the fact that, mesothelioma is difficult to diagnose due to the similarity of its symptoms to other lung diseases (13,14) and these symptoms do not become apparent until late stages of disease. On the other hand, early diagnosis of mesothelioma is important for clinical management of the patient; for example, treatment at an early stage of disease significantly improves patient survival (15). Moreover, early diagnosis is important because of the issues of compensation and lawsuits, especially if the jurisdiction will only accept cases brought on behalf of a living victim (16,17).
The current gold standard for malignant mesothelioma diagnosis is through a pleural biopsy with subsequent histologic examination of the tissue (18), which is often complemented by immunohistochemistry examination. The extraction of diagnostic tissue is performed through a thoracoscopy or open thoracotomy. Both of these procedures are invasive and costly. On the other hand, thoracocentesis, which is removal of effusion fluid from the pleural space, is a far less invasive procedure that can provide material for cytological examination. Though crucial for the diagnosis (19), tissue invasion cannot be determined from cytological examination and therefore such an examination, by itself, is usually not sufficient for a definitive diagnosis. In this study, we describe a computational method to detect malignant mesothelioma based on the nuclear chromatin distribution from digital images of mesothelial cells in effusion cytology specimens. Examination of nuclear chromatin distribution of the mesothelial cells to determine the presence of mesothelioma is a challenging task for cytopathologists, because benign and malignant nuclei look similar to human eye. This nuclear similarity can be clearly seen Figure 1.
Figure 1.
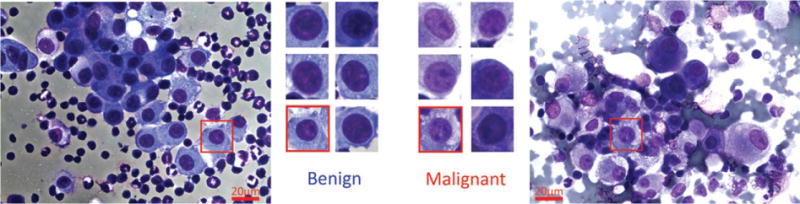
Sample mesothelial nuclei are show in this figure. The left-most image is taken from a benign effusion, and the rightmost image is taken from a mesothelioma patient. Sample selected nuclei from each type are given in the center, showing the similarity of different types of nuclei. [Color figure can be viewed in the online issue, which is available at wileyonlinelibrary.com.]
In the past few years, computational methods became more popular than before especially for cell and nuclear segmentation and quantitative analysis on segmented structures (20–23). In this particular study, we aim to predict the diagnosis of a patient by analyzing digital images of cells from pleural effusion fluid of patients with both malignant mesothelioma and benign effusions. If successful, the new technique will have the potential to eliminate or reduce the need for tissue biopsy.
This article is organized as follows. The next section describes in detail our sample procurement, preparation, imaging, and image analysis pipeline. After acquisition of light microscopy images of stained effusion fluid, we first manually select nuclei from relevant mesothelial cells under supervision of a cytopathologist. The selected nuclei are then semi-automatically segmented using a level set-based method (24). After segmentation, the chromatin content of each segmented nucleus is processed to obtain its linear optimal transport (LOT) embedding, as described in detail in Wang et al. (25) and in Basu et al. (26). Classification is performed by using a linear discriminant analysis-based k-nearest neighbor classifier on LOT space. Finally, we show that this method can outperform traditional numerical feature-based approaches for comparing nuclei, and can achieve high accuracy in a cohort of 34 patients. In addition, we show the approach can be used to visualize interesting differences in nuclear morphology between different nuclei types.
MATERIALS AND METHODS
Sample Procurement, Staining, and Image Acquisition
Cytology slides are obtained from the archives of the departments of pathology of Allegheny General Hospital and the West Penn Hospital (Institutional Review Board approval RC-5713). Selected slides include patients with both malignant mesothelioma and benign pleural effusions. All patients selected for our study had a cytological examination of pleural effusion and a concurrent or subsequent pleural biopsy, which served as the gold standard for our evaluation procedure. Effusion cytology specimens were stained with the Diff-Quik (27) stain. Digital images of mesothelial cells were acquired using an Olympus BX50 microscope equipped with a Plan CN 60X objective (Olympus America, Central Valley, PA) and IN1820 spot insight firewire two megapixel camera (Spot Imaging Solutions, Sterling Heights, MI). Images of at least 30 mesothelial cells per case were obtained. Patient cases were anonymized to prevent any bias and cases with insufficient numbers of mesothelial cells were excluded from the study. A total of 34 patients were used for this study, including 16 cases of malignant mesothelioma and 18 cases of benign pleural effusions.
Nuclear Segmentation
We used a semi-automatic procedure for segmenting the relevant nuclei from the images acquired as described above. Mesothelial cells were first manually identified from digital images under the supervision of a cytopathologist (O.Y.). Rough initial borders for each nucleus were manually selected as input for a level-set method (24), which was applied to automatically achieve the final contours of the segmented nuclei. Figure 2 contains a few examples of segmented nuclei (second row) with their final contours in white, and the corresponding nuclei after our normalization (third row), which is described in more detail below. A total of 1,080 nuclei segmented from digital images in this study, where 590 nuclei for benign cases and 490 nuclei malignant cases.
Figure 2.
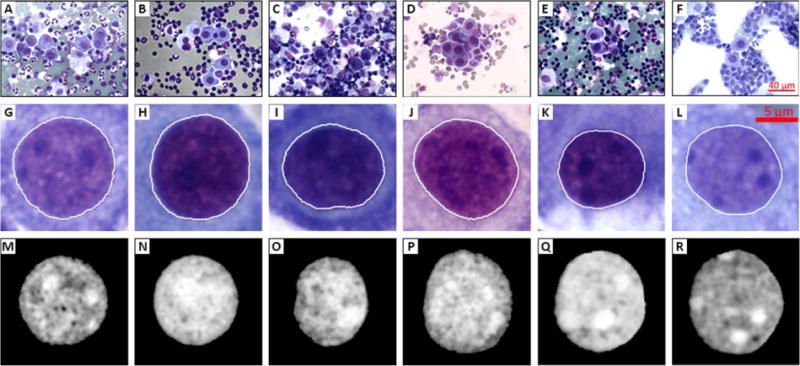
Example images showing segmentation process. First row (A–F) shows the initial digital images acquired each having a field of view, second row (G–L) shows sample segmented nuclei from digital images of the first row, and third row (M–R) shows the final images after normalization process. [Color figure can be viewed in the online issue, which is available at wileyonlinelibrary.com.]
Comparing Nuclear Chromatin Using Transport-Based Morphometry
Our approach for classifying nuclear chromatin images relies on the idea of computing the optimal transport plan between two images. In this work, however, we use the linearized version (explained in detail below) of the optimal transport metric we have recently described in Refs. 25 and 26. Before the application of the transport-based morphometry pipeline, the segmented nuclear images (one nucleus per image) were pre-processed as follows. The luminance component of segmented RGB nuclei images was extracted and intensities were normalized so that the pixel brightness indicates the amount of locally concentrated chromatin (the brighter the pixel, the more chromatin). The sum of intensities in each segmented nuclear image is set to one and single nucleus images are normalized to remove relative translations and rotations, using the procedure proposed in Rohde et al. (28), where the images are centered to eliminate the translation factor and rotated such that the major axis is aligned vertically. Example segmented and normalized nuclear images are shown in Figure 2 (third row).
After normalization, the chromatin content of each segmented nucleus was processed to obtain its LOT embedding (25) using 800 particles for approximating each image. The particle approximation process is performed by using Lloyd’s weighted K-means algorithm (29) to adjust the position and weights of a set of N particles, where N<<M and M is the number of pixels in the image. The details and intuition behind this procedure can be found in Supporting Information. An illustrated result of the particle approximation step can be seen in Step 1 of Figure 3.
Figure 3.
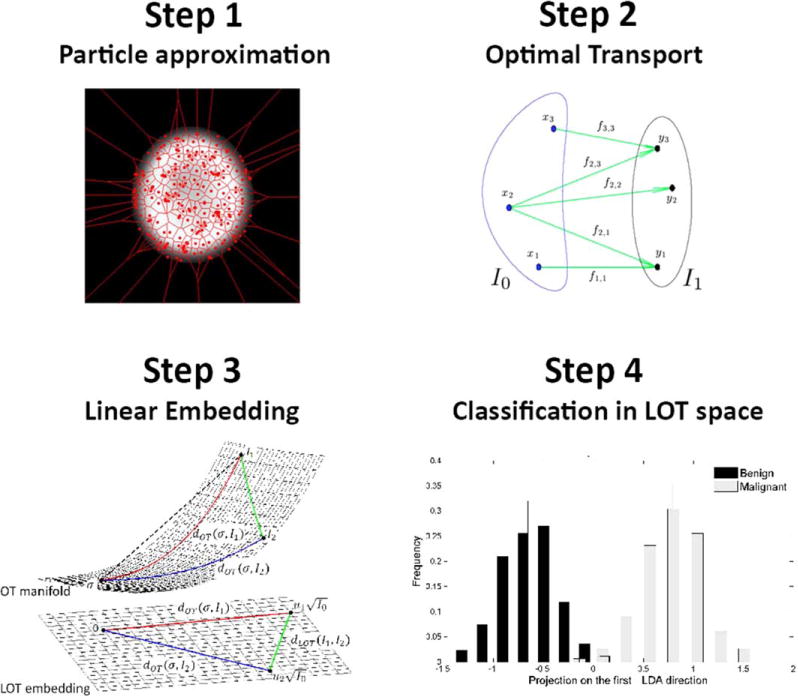
Transport-based morphometry framework is summarized. Step 1 illustrates the particle approximation on a single nucleus image. Step 2 shows an example optimal transport solution over particles of two sets of particles. In Step 3, a demonstration of LOT embedding from OT manifold is given. Finally, in Step 4 the projection of data in LOT space on to first LDA direction is depicted for the purpose of classification. [Color figure can be viewed in the online issue, which is available at wileyonlinelibrary.com.]
The optimal transport plan between each nucleus image and a reference image is computed using the ‘mass’ of the particle approximation, where ‘mass’ is the collection of pixel intensity values and reference image is the Euclidean average of intensities across the entire image dataset (after translation and rotation effects have been removed). One of the major benefits of this technique is a dramatic reduction in computational complexity when computing pairwise transport distances between images in a dataset.
Although a detailed explanation of the LOT approach is available in the Supporting Information, for completeness, in this study, we offer the following summary. In brief, we use aforementioned reference image (Euclidean average of intensities across the entire image dataset) as a template. That is, let the dataset be composed of K images I1; I2; …; Ik. The reference image is computed as . We then compute a particle representation for each image (and the template image) as described before. This approximation is meant to decrease the computational complexity of the overall method by selecting the “most important” pixel locations based on a weighted K-means approach. Note that, we have chosen N = 800 particles to be used for approximating each image. The output for each image is the position of each particle, and the weight (mass which corresponds to intensity values) of each particle in approximating the corresponding image. For example, the approximation for the reference image can be written as where corresponds to a discrete delta function placed at position xk in that image, whereas qk corresponds to the ‘mass’ at that position. Likewise, let , be the particle approximation of another image in the database. To obtain the linear embedding of image I1 we solve for the optimal transport between the particle approximations of I0 and I1.
More precisely, we use the optimal transportation (Kantorovich–Wasserstein) framework to quantify how mass in an image, in relative terms, is redistributed to morph that image into the template image. Note that mass in this study corresponds to pixel intensities, which in this case correspond to chromatin density within the nuclei. Hence, the meaning of transport distance between two nuclei becomes the transport distance between localization of chromatin distribution of two nuclei. We describe the mathematics of the traditional optimal transport (OT) framework, and in particular the geometry behind it, in the Supporting Information. As a summary, the optimal transportation distance, also known as the Kantorovich–Wasserstein distance, between two measures (images) P1 and P2 on domain π is defined as:
| (1) |
where μ is a coupling within the set of all couplings between P1 and P2. Note that, the set of all couplings (∏(P1, P2)) is the set of all probability measures on with the first marginal is P1 and the second marginal is P2. Each coupling describes a transportation plan μ(A0×A1), which tells the amount of “mass” that is originally in set A0 transported into set A1. In Eq. (1), the space of probability measures is endowed with a Riemannian manifold, which is visualized in Step 3 of Figure 3 (OT manifold). This Riemannian manifold structure is needed to be able to consider paths and in particular the shortest path (i.e., geodesics) connecting any two probability measures, or in our case, two nucleus images in the image space.
In, Wang et al. (25) used Eq. (1) for a finite number of particles described here as particle approximation step. Recalling the particle-based definitions of images as and optimal transportation distance between these two images can be found by minimizing
| (2) |
subject to constraints for i=1, … N, and for j=1, …, N. In Figure 3, Step 2 illustrates a sample transportation map between two images. The minimization is performed using the linear programming approach described in Wang et al. (25). The linear embedding of I1 is obtained by applying the discrete transportation map between the reference I0 and I1 to the coordinates yj via
| (3) |
where ak is the centroid of the particle computed via
| (4) |
We denote t1 to be the LOT embedding of I1. This embedding has dimensions t1 ∈ ℝN×2 for two dimensional (2D) images.
Classification
To perform the classification task we compute a one dimensional linear discriminant subspace that can be used for classifying sets of nuclei. To that end, we computed a linear classification function to distinguish individual nuclei from the two classes (benign and malignant) by using the standard Fisher linear discriminant analysis (LDA) technique (30) on the LOT embedding of each nucleus in the training set. The outcome of this procedure is a projection vector, denoted as , of the same size as each LOT embedding.
Given a set of LOT embeddings x1;…; xN from a given class, the projection of each nucleus was computed via and stored as training data, where is the projection line. Given a set of LOT embeddings from nuclei from an unlabeled patient y1;…; yM, the projection of each nucleus was computed. Figure 3 Step 4 shows the histograms of the projected data onto first LDA direction. The class of an unknown set of nuclei is computed by classifying each y1 via a K-nearest neighbor algorithm [see Bishop and Nasrabadi (30) for details], and taking the majority ‘vote’ (the most common class assignment of the nuclei of the particular patient). The appropriate number of nearest neighbors K is computed with a blind cross validation procedure with-in the training set (double cross-validation).
Visualization of Discriminating Information
The transport-based morphometry pipeline described above, and in more detail in the Supporting Information, can also be used to visualize discriminating information between two classes (in this case, benign vs. mesothelial cells). This is possible because the LOT embedding procedure described above can also be viewed as an invertible transform. That is, after transforming image to LOT space one can transform back to image space using particles and their weights in LOT space. Note that, t1 is the LOT embedding of I1 with dimensions t1 ∈ ℝN×2 for 2D images. Hence, the embedding is interpretable in the sense that any point in this space can be visualized by simply plotting the vector coordinates (each in ℝ2) in the image space π, which makes LOT an invertible transform. This inversion operation is described in detail in Refs. 25 and 26, but in short, any point xk in LOT space contains within it a transport map [f in Eq. (4)], which can be used to visualize the template masses in image domain, and in this way an image corresponding to point xk can be visualized. To visualize the most discriminant differences between benign and malignant cells, it is therefore possible to simply plot the LDA line computed as described above, via this inversion operation. As we have described in Ref. 31, however, simply plotting can lead to misleading interpretations given that nothing constrains the LDA procedure to visualize the data in image domain. Meaning that the direction may not have any phenotypes ‘nearby’ and hence may not be representative of any trend in the data. In Ref. 31, we have described a penalized version of the method, denoted in this study as , that helps enforce the direction for visualization of the data (images of cells) by combining the cost functions of the standard LDA and the principal component analysis method.
Figure 4 shown below contains a result of applying the penalized linear discriminant analysis (pLDA) method to this dataset. In this figure, histogram bins represent the distribution of nuclei in LOT space, such that their LOT embeddings are projected onto the first (most discriminant) direction of pLDA. The nuclei images below these histogram bins are the images of nuclei along the pLDA direction, which is generated by simply plotting the vector coordinates of each particle of the average image. We note that in this computation, we have used the pLDA method modified as described in Ref. 31. Finally, we mention that it is not possible to perform this operation using the standard numerical feature-based approach described above, as the operation of extracting features from an image is not invertible. That is, although it is possible to extract features from an image of a cell, generally speaking, it is not possible to reconstruct an image from the extracted features.
Figure 4.
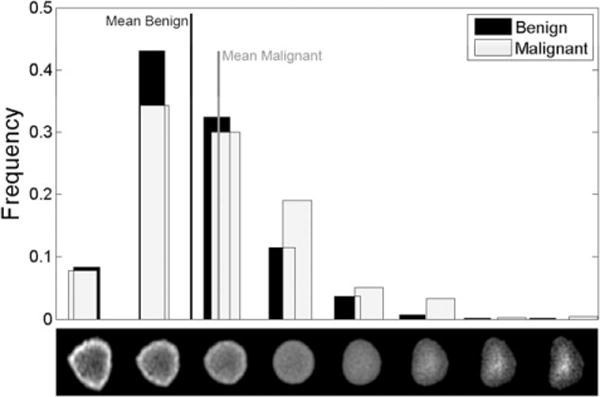
Nuclei distribution histograms for benign and malignant mesothelioma comparison. The row of nuclei images beneath the histogram bins are the normalized grayscale (upper row) visual representations of nuclei along the optimal transportation pathway (geodesic) that best discriminate between these two groups of nuclei.
Comparison
To show the effectiveness of proposed method, we have also included results obtained using a numerical feature-based approach for comparison. This feature-based approach is similar to the approach described earlier in Wang et al. (31). A total of 256 numerical features were extracted per nucleus. These features include ‘morphological features’ (such as area, convexity, circularity, perimeter, eccentricity, and equivalent diameter), which are widely used in image analysis in digital pathology. In addition, the feature set also includes ‘texture features’, which in our case consisted of Haralick and Gabor features as described in Refs. 32 and 33. Finally, the feature set also included wavelet-based features, which can capture multi resolution information from images as described in Wang et al. (20). Features were normalized after extraction, so that the variance of each feature was set to one. A ‘leave one patient out’ cross validation strategy was applied to train the classification procedure. The training process also consisted of applying the stepwise discriminant analysis (34) technique for feature selection, and subsequently applying the same LDA-based classification procedure described above to obtain the final predictions for each patient. In the comparisons below, the training and testing procedures used identical data for both LOT and numerical feature-based approaches.
RESULTS
To evaluate the performance of proposed method, we used the standard “leave one patient out” cross validation strategy. In this study, we test the ability of our method to classify patients whose nuclei were not used in the training process. Therefore, to classify a given patient, the nuclei belonging to that patient are removed from the training dataset and kept separated as testing data. A classifier is then trained using training data only and then used to compute the projection score of the separated patient’s nuclei. In all classification confusion matrices shown in Table 1, each patient was diagnosed by using the LDA-based K-nearest neighbor voting classifier (computed as described above) trained without using nuclei from that patient. In summary, no testing data is used in the training process, whereas the LOT embedding procedure above is the same for every image, and does not use class labels. Because the error between the average image calculated over the entire set and the average images calculated over just the training sets (one-patient-out) are negligible, we take the reference image to be the empirical mean of the entire dataset and calculate LOT just once. Because the averaging operation does not use class labels, we note that this procedure does not violate the common assumptions related to supervised learning, that is, the same operation can be performed for classifying a patient whose class is unknown.
Table 1.
Quantitative results for malignant versus benign patient classifications
| CONFUSION MATRIX AND ACCURACY FOR LOT-BASED APPROACH | CONFUSION MATRIX AND ACCURACY FOR NUMERICAL FEATURE-BASED APPROACH | ||||||
|---|---|---|---|---|---|---|---|
|
| |||||||
| Patient based Benign vs. Malignant | Predicted diagnosis
|
Patient based Benign vs. Malignant | Predicted diagnosis
|
||||
| Benign | Malignant | Benign | Malignant | ||||
| Actual diagnosis | Benign | 18 | 0 | Actual diagnosis | Benign | 16 | 2 |
| Malignant | 0 | 16 | Malignant | 5 | 11 | ||
| Accuracy | 100% | Accuracy | 79% | ||||
Table 1 contains a summary of the classification results obtained for our diagnostic challenges. Results using the LOT-based approach are shown in Table 1a. For comparison purposes, in this study, we have also included results obtained using a numerical feature-based approach described earlier, which are given in Table 1b. Results computed using the transport-based approach are clearly superior in accuracy to those computed using the standard numerical feature-based approach.
In our diagnostic challenge, we also sought to display and learn what discriminative nuclear properties exist between nuclei of benign and malignant classes. Figure 4 contains a visualization of the most discriminant direction between benign and malignant cells. In this figure, the height of each bar corresponds to the number of nuclei (within each class), which were most closely associated (in the sense of the transport metric described above) to the nuclear configuration directly beneath it. Hence, it is a projection of the data onto the pLDA direction computed as described above. We note that this computation is also performed using held out data. That is, the pLDA direction was computed using training data, whereas the histograms shown are computed using separate test data using 10% of the data. Student’s t-test is calculated between two populations of patients (benign vs. malignant) on the most discriminant direction of pLDA, and the P-value associated with the t-test for differences of means in this computation was P = 0.0004 (computed using test data only), which corresponds to significance between set of nuclei belonging to benign patients and set of nuclei belonging to malignant patients. The figure therefore conveys that, in traversing from benign to malignant nuclei, the chromatin distribution is changing. On average, malignant cells tend to have more of their chromatin distributed toward the center of the nuclear envelope, whereas benign cells, relatively speaking, tend to have their chromatin more concentrated toward the border of the nucleus.
DISCUSSION
In this study, we presented a computer-aided diagnosis approach for classification of malignant mesothelioma based on nuclear structure of mesothelial cells in the effusion cytology specimens. The procedure we described combines a transport-based linear embedding for each image together with simple LDA-based K-nearest neighbor voting classifier. The proposed approach was able to achieve 100% predictive accuracy (perfect specificity and sensitivity) from effusion cytology of 34 patients, whose clinical diagnosis is known. The quantitative results are promising and therefore the proposed approach has a potential to eliminate the need for an invasive procedures for diagnosis. In addition, this method is capable of showing nuclear morphology differences between benign and malignant mesothelial nuclei. Such differences are difficult to visualize from the raw, unprocessed, data.
Our future directions include, expanding the dataset for better analysis of the methodology in terms of robustness and reliability. With the increase of data size, an automated nuclei segmentation algorithm will be beneficial in terms of time management. We also plan to include additional diagnostic challenges, such as differentiating malignant mesothelioma from adenocarcinoma involving the pleura, which is also a well-known problem in surgical pathology and effusion cytology (35). There are also an increasing number of studies in immunohistochemistry especially focused on mesothelioma detection. However, there is still no standard test that perfectly discriminates mesothelioma from carcinoma. We also mention there is significant room for improvement in automating the nuclear segmentation procedure. In this work, we have used guidance from a trained pathologist for selecting mesothelial cells from the image field of view, and initializing the segmentation procedure. Potentially, these procedures could be automated using a variety of nuclear segmentation methods (36), whereas the selection of nuclei pertinent to mesothelial cells can be performed using classification approaches.
In addition, we have shown that certain standard numerical feature-based methods may not perform and the LOT approach described earlier. We hypothesize that the reason for the improvement in accuracy is related to the fact that the existing numerical feature-based approaches, as detailed above, are not invertible operations, which means it is not possible to regenerate images from feature space. Thus they are likely to ‘discard’ information which, at times, may be relevant to the problem at hand. In contrast, the LOT approach we have used, in theory (if enough approximating particles are used), can be seen as an invertible transformation and thus is more likely to preserve more information relevant to the discrimination task at hand. Moreover, because the process of obtaining LOT embedding constitutes an invertible nonlinear transformation, as explained in (25), this nonlinearity potentially increases the linear separability of the data, thus allowing for higher classification accuracies with relatively simple classifiers. Future work also includes a more theoretical investigation to describe this phenomenon.
Finally, we also note that the voting-based classifier presented above is one option amongst several other possible ones. The strategy consisted of classifying nuclei individually (independently of each other) first, and then aggregating results through a voting procedure. The (testing set classification) accuracy for individual nuclei was 73.3% using the LOT method, and 59.8% using the numerical feature approach. In our work, we have chosen the majority vote, though one could also use a different “threshold” in the voting procedure, at the expense of a decrease in accuracy (data not shown for brevity). In a more general sense, the strategy of classifying nuclei individually (independently of each other) first, and then aggregating results through a voting procedure can be seen as an implementation of the Naïve Bayes method for classification. When dependency exists between samples, alternate strategies already exist and can be used (37). Future work will include expanding our patient database to test the method with a larger cohort, improving the automation of our segmentation method, and testing other set classification strategies for determining the class of each patient.
In conclusion, our results show that the recently developed transport-based morphometry approach can reliably tell apart malignant from benign sets of mesothelial cells, by only looking at effusion cytology specimens. In contrast, feature-based approach fails to get correct classification for seven patients. According to our pathologist reports, five misclassified malignant patients were also misdiagnosed by cytopathologists when they made the diagnosis by only looking at effusion cytology. These cases turned out to be malignant on biopsy. The reason is that cytopathologists may be reluctant to make the diagnosis of malignant mesothelioma based on cytology alone, because no information is available from tissue structure.
Supplementary Material
Acknowledgments
The authors thank Shinjini Kundu for proofreading the manuscript.
Grant sponsor: NIH, Grant number: CA188938; Grant number: P41 GM103712; Grant sponsor: NSF, Grant number: CCF 1421502; Grant sponsor: Pennsylvania State Health Department, Grant number: 4100059192.
Footnotes
Additional Supporting Information may be found in the online version of this article.
LITERATURE CITED
- 1.Delgermaa V, Takahashi K, Park EK, Le GV, Hara T, Sorahan T. Global mesothelioma deaths reported to the World Health Organization between 1994 and 2008. B World Health Organ. 2011;89:716–724. doi: 10.2471/BLT.11.086678. [DOI] [PMC free article] [PubMed] [Google Scholar]
- 2.Jane Henley S, Larson TC, Wu M, Antao VCS, Lewis M, Pinheiro GA, Eheman C. Mesothelioma incidence in 50 states and the District of Columbia, United States, 2003–2008. Int J Occup Env Heal. 2013;19:1–10. doi: 10.1179/2049396712Y.0000000016. [DOI] [PMC free article] [PubMed] [Google Scholar]
- 3.Price B, Ware A. Mesothelioma trends in the United States: An update based on surveillance, epidemiology, and end results program data for 1973 through 2003. Am J Epidemiol. 2004;159:107–112. doi: 10.1093/aje/kwh025. [DOI] [PubMed] [Google Scholar]
- 4.Peto J, Decarli A, La Vecchia C, Levi F, Negri E. The European mesothelioma epidemic. Brit J Cancer. 1999;79:666. doi: 10.1038/sj.bjc.6690105. [DOI] [PMC free article] [PubMed] [Google Scholar]
- 5.Hodgson JT, Darnton A. The quantitative risks of mesothelioma and lung cancer in relation to asbestos exposure. Ann Occup Hyg. 2000;44:565–601. [PubMed] [Google Scholar]
- 6.Testa JR, Cheung M, Pei J, Below JE, Tan Y, Sementino E, Cox NJ, Dogan AU, Pass HI, Trusa S, et al. Germline BAP1 mutations predispose to malignant mesothelioma. Nat Genet. 2011;43:1022–1025. doi: 10.1038/ng.912. [DOI] [PMC free article] [PubMed] [Google Scholar]
- 7.Jasani B, Gibbs A. Mesothelioma not associated with asbestos exposure. Arch Pathol Lab Med. 2012;136:262–267. doi: 10.5858/arpa.2011-0039-RA. [DOI] [PubMed] [Google Scholar]
- 8.Cicala C, Pompetti F, Carbone M. SV40 induces mesotheliomas in hamsters. Am J Pathol. 1993;142:1524–1533. [PMC free article] [PubMed] [Google Scholar]
- 9.Attanoos RL, Gibbs AR. Pathology of malignant mesothelioma. Histopathology. 1997;30:403–418. doi: 10.1046/j.1365-2559.1997.5460776.x. [DOI] [PubMed] [Google Scholar]
- 10.Legha SS, Muggia FM. Pleural mesothelioma: Clinical features and therapeutic implications. Ann Intern Med. 1977;87:613–621. doi: 10.7326/0003-4819-87-5-613. [DOI] [PubMed] [Google Scholar]
- 11.Edwards JG, Abrams KR, Leverment JN, Spyt TJ, Waller DA, O’Byrne KJ. Prognostic factors for malignant mesothelioma in 142 patients: Validation of CALGB and EORTC prognostic scoring systems. Thorax. 2000;55:731–735. doi: 10.1136/thorax.55.9.731. [DOI] [PMC free article] [PubMed] [Google Scholar]
- 12.Marinaccio A, Nesti M. Regional operational centers. Analysis of survival of mesothelioma cases in the Italian register (ReNaM) Eur J Cancer. 2003;39:1290–1295. doi: 10.1016/s0959-8049(03)00233-8. [DOI] [PubMed] [Google Scholar]
- 13.Boutin C, Rey F. Thoracoscopy in pleural malignant mesothelioma: A prospective study of 188 consecutive patients. Part 1: Diagnosis Cancer. 1993;72:389–393. doi: 10.1002/1097-0142(19930715)72:2<389::aid-cncr2820720213>3.0.co;2-v. [DOI] [PubMed] [Google Scholar]
- 14.Churg A, Galateau-Salle F. The separation of benign and malignant mesothelial proliferations. Arch Pathol Lab Med. 2012;136:1217–1226. doi: 10.5858/arpa.2012-0112-RA. [DOI] [PubMed] [Google Scholar]
- 15.Sridhar KS, Doria X, Raub WA, Thurer RJ, Saldana M. New strategies are needed in diffuse malignant mesothelioma. Cancer. 1992;70:2969–2979. doi: 10.1002/1097-0142(19921215)70:12<2969::aid-cncr2820701239>3.0.co;2-a. [DOI] [PubMed] [Google Scholar]
- 16.Robinson BWS, Musk AW, Lake RA. Malignant mesothelioma. Lancet. 2005;366:397–408. doi: 10.1016/S0140-6736(05)67025-0. [DOI] [PubMed] [Google Scholar]
- 17.Kanazawa N, Ioka A, Tsukuma H, Ajiki W, Oshima A. Incidence and survival of mesothelioma in Osaka, Japan. Jpn J Clin Oncol. 2006;36:254–257. doi: 10.1093/jjco/hyl018. [DOI] [PubMed] [Google Scholar]
- 18.Addis B, Heather R. Problems in mesothelioma diagnosis. Histopathology. 2009;54:55–68. doi: 10.1111/j.1365-2559.2008.03178.x. [DOI] [PubMed] [Google Scholar]
- 19.Saad RS, Cho P, Liu YL, Silverman JF. The value of epithelial membrane antigen expression in separating benign mesothelial proliferation from malignant mesothelioma: A comparative study. Diagn Cytopathol. 2005;32:156–159. doi: 10.1002/dc.20208. [DOI] [PubMed] [Google Scholar]
- 20.Wang W, Ozolek JA, Rohde GK. Detection and classification of thyroid follicular lesions based on nuclear structure from histopathology images. Cytometry Part A. 2010;77A:485–494. doi: 10.1002/cyto.a.20853. [DOI] [PMC free article] [PubMed] [Google Scholar]
- 21.Stenkvist B, Sighild WN, Jan H, Bo N, Ewert B, Jan V, Olle E, Cecil F. Computerized nuclear morphometry as an objective method for characterizing human cancer cell populations. Cancer Res. 1978;38:4688–4697. [PubMed] [Google Scholar]
- 22.Chen C, Wang W, Ozolek JA, Rohde GK. A flexible and robust approach for segmenting cell nuclei from 2D microscopy images using supervised learning and template matching. Cytometry Part A. 2013;83A:495–507. doi: 10.1002/cyto.a.22280. [DOI] [PMC free article] [PubMed] [Google Scholar]
- 23.Nagashima T, Masato S, Masaki O, Hideyuki H, Hiroshi Y, Tomotane S, Keiji K, Nobuyuki N. Morphometry in the cytologic evaluation of thyroid follicular lesions. Cancer Cytopathol. 1998;84:115–118. [PubMed] [Google Scholar]
- 24.Li C, Xu C, Gui C, Fox MD. Level set evolution without re-initialization: A new variational formulation. Proceeding of the IEEE Computer Society Conference on Computer Vision and Pattern Recognition (CVPR 2005) 2005;1:430–436. [Google Scholar]
- 25.Wang W, Slepcev D, Ozolek JA, Basu S, Rohde GK. A linear optimal transportation framework for quantifying and visualizing variations in sets of images. Int J Comput Vision. 2013;101:254–269. doi: 10.1007/s11263-012-0566-z. [DOI] [PMC free article] [PubMed] [Google Scholar]
- 26.Basu S, Kolouri S, Rohde GK. Detecting and visualizing cell phenotype differences from microscopy images using transport-based morphometry. Proc Natl Acad Sci USA. 2014;111:3448–3453. doi: 10.1073/pnas.1319779111. [DOI] [PMC free article] [PubMed] [Google Scholar]
- 27.DeMay RM. The Art and Science of Cytopathology. Chicago IL: American Society of Clinical Pathologists Press; 1996. [Google Scholar]
- 28.Rohde GK, Ribeiro AJS, Dahl KN, Murphy RF. Deformation-based nuclear morphometry: Capturing nuclear shape variation in HeLa cells. Cytometry Part A. 2008;73A:341–350. doi: 10.1002/cyto.a.20506. [DOI] [PubMed] [Google Scholar]
- 29.Lloyd S. Least squares quantization in PCM. IEEE T Inform Theory. 1982;28:129–137. [Google Scholar]
- 30.Bishop CM, Nasrabadi NM. Pattern Recognition and Machine Learning. New York: Springer; 2006. [Google Scholar]
- 31.Wang W, Mo Y, Ozolek JA, Rohde GK. Penalized Fisher discriminant analysis and its application to image-based morphometry. Pattern Recogn Lett. 2011;32:2128–2135. doi: 10.1016/j.patrec.2011.08.010. [DOI] [PMC free article] [PubMed] [Google Scholar]
- 32.Haralick R, Shanmugam K, Dinstein I. Textural features for image classification. IEEE T Syst Man Cyb. 1973;3:610–621. [Google Scholar]
- 33.Boland M, Murphy R. A neural network classifier capable of recognizing the patterns of all major subcellular structures in fluorescence microscope images of HeLa cells. Bioinformatics. 2001;17:1213–1223. doi: 10.1093/bioinformatics/17.12.1213. [DOI] [PubMed] [Google Scholar]
- 34.Jennrich RI, Sampson P. Stepwise discriminant analysis. Stat Method Digital Comput. 1977;3:77–95. [Google Scholar]
- 35.Saad RS, Lindner JL, Lin X, Liu YL, Silverman JF. The diagnostic utility of D2–40 for malignant mesothelioma versus pulmonary carcinoma with pleural involvement. Diagn Cytopathol. 2006;34:801–806. doi: 10.1002/dc.20556. [DOI] [PubMed] [Google Scholar]
- 36.Chen C, Wang W, Ozolek JA, Rohde GK. A flexible and robust approach for segmenting cell nuclei from 2D microscopy images using supervised learning and template matching. Cytometry Part A. 2013;83A:495–507. doi: 10.1002/cyto.a.22280. [DOI] [PMC free article] [PubMed] [Google Scholar]
- 37.Huang H, Tosun AB, Guo J, Chen C, Wang W, Ozolek JA, Rohde GK. Cancer diagnosis by nuclear morphometry using spatial information. Pattern Recogn Lett. 2014;42:115–121. doi: 10.1016/j.patrec.2014.02.008. [DOI] [PMC free article] [PubMed] [Google Scholar]
Associated Data
This section collects any data citations, data availability statements, or supplementary materials included in this article.