

Abstract
Objective
To evaluate the trend, impact, severity and risk factors of Clostridium difficile infections in hospitalized children in the United States.
Design
A retrospective cohort study utilizing the triennial Healthcare Cost and Utilization Project Kids’ Inpatient Database years: 1997, 2000, 2003, and 2006.
Setting
Hospitalized children in the United States.
Participants
10,495,728 nationally weighted hospital discharges and 21,274 with Clostridium difficile infection.
Main Exposure
Discharge diagnosis of Clostridium difficile infection.
Outcome measures
Trend in cases; impact and severity was measured by length of stay, hospital charges, colectomy rate and death rate.
Results
There was an increasing trend in cases of Clostridium difficile infection from 3,565 in 1997 to 7,779 in 2006 (p<.001). Clostridium difficile infections had an increased risk of death with an adjusted odds ratio (95% confidence interval); 1.20 (1.01–1.43), colectomy; 1.36 (1.04–1.79), longer length of stay; 4.34 (3.97–4.83) and higher charges; 2.12 (1.98–2.26). There was no trend in death, colectomy, length of stay, or charges over the four time periods. The risk of comorbid diagnoses associated with Clostridium difficile infection included inflammatory bowel disease, with an odds ratio of 11.42 (10.16–12.83), and other comorbid diagnoses associated with immunosuppression, or antibiotic administration.
Conclusions
There is an increasing trend and a significant impact of Clostridium difficile infections on hospitalized children. In contrast to adults, there is no increasing trend in the severity of Clostridium difficile infections in children. Children with medical conditions, including inflammatory bowel disease, immunosuppression, or conditions requiring antibiotic administration are at high risk of Clostridium difficile infection.
Clostridium difficile is a gram-positive, spore-forming, anaerobic bacillus that can colonize the gastrointestinal tract and can lead to Clostridium difficile infection (CDI). CDI has a wide variation in severity, ranging from asymptomatic colonization to severe diarrhea, pseudomembranous colitis, toxic megacolon, bowel perforation and death. In recent years, the incidence, number of hospitalizations, associated deaths and severity of CDI in adults has been increasing.1, 2
The increased rate and severity of CDI have been observed in conjunction with the description of hypervirulent strains of C. difficile that have resistance to antibiotics such as fluoroquinolones and third generation cephalosporins, hypersecrete toxins A and B, and secrete an additional toxin known as binary toxin.3, 4 The hypervirulent strain known as North American Pulsed Field type 1 (NAP1) occurs in 19.4 percent of pediatric patients and is associated with more complications in children.5–8 However, much of the increased frequency and severity of CDI may be due to factors other than the emergence of hypervirulent strains.
In previous nationwide studies, CDI rates have been highest in elderly and urban populations.1, 9 More recent reports describe severe CDI in children and young, previously healthy patients without hospital exposure.10, 11 There have been two studies showing an increasing CDI trend in children over recent years.12, 13 However, little is known about the impact and trend in severity of CDI in children.
There are several known risk factors for the development of CDI, including medication administration, i.e., antibiotics, acid suppression medication, and chemotherapy.14–17 In adults, conditions such as inflammatory bowel disease (IBD) and human stem cell transplantation are associated with CDI.18, 19 Children with solid tumors, organ transplantation, and IBD are also at increased risk.20–22 While these studies have examined the relationship of CDI in subgroups of patients, there have been no broad investigations of clinical and demographic risk factors for CDI in children. Utilizing a large national database, we sought to identify risk factors associated with CDI in hospitalized children and to evaluate the impact and trends on the incidence and severity of the disease.
Methods
Data Source
Data were obtained from the triennial Healthcare Cost and Utilization Project Kids’ Inpatient Database (HCUP-KID), sponsored by the Agency for Healthcare Research and Quality. HCUP-KID is the first nationwide inpatient database devoted to children in the United States (U.S.). It consists of a stratified random sample of 5,754,377 inpatient discharges over four time periods: 1997, 2000, 2003, and 2006. Included are discharge data from 22–38 states (depending on the year) and, for 2006, it represented an estimated 88.8% of all pediatric inpatient visits in the U.S. Each record in the database represents a primary hospital discharge and includes up to 14 other diagnostic-related group (DRG) codes and up to 15 current procedural terminology (CPT) codes, based on the International Statistical Classification of Diseases and Related Health Problems, ninth revision (ICD-9). HCUP-KID assigns an individual-level population weight that allows an estimation of national case rates and trends.23 All children less than one year of age were excluded based on uncertainty about the true morbidity of C. difficile in infants. There is substantial evidence to support C. difficile as both normal commensal flora and non-pathogenic in infants less than one year of age.7, 24–31
Variable Definition
The main predictor was the presence or absence of a diagnosis of CDI on an inpatient discharge record. Case selection was performed by searching the database for the DRG code 008.45. This is the only code devoted to CDI and it has been previously validated as an accurate determinant of actual disease.32, 33 This code includes two descriptions: intestinal infection due to Clostridium difficile and pseudomembranous colitis. Demographic data include race, gender, age, payer type, geographic region, and geographic location (urban vs. rural) of the hospital. HCUP-KID relies on individual states to provide race-specific data; therefore, racial categorization varies from state to state. To simplify the analysis, race was grouped into white, black, Hispanic, and other based on race classification provided in the HCUP-KID database. Payer type was grouped into private insurance/health maintenance organization (HMO), Medicaid/Medicare, and other (no pay, self pay, and any other). The hospital region was designated Northeast, Midwest, South or West. A time variable was included to indicate the year the data was collected to test for trends over time.
The main outcomes studied were death rate, colectomy rate, length of hospital stay (LOS) and inpatient stay charges. Death rate was defined as the number of patients who died per the number of discharges with the diagnostic code for CDI. Colectomy was defined by the following ICD-9 CPT codes: 45.8 - total intra-abdominal colectomy, 45.7 - partial excision of large intestine, 45.71 - multiple segmental resection of large intestine, 45.72 - cecectomy, 45.73 - right hemicolectomy, 45.74 - resection of transverse colon, 45.75 - left hemicolectomy, 45.76 - sigmoidectomy, and 45.79 - other partial excision of large intestine. LOS was evaluated as the number of days hospitalized. Charges were adjusted to 2009 dollars utilizing the consumer price index for inpatient hospital services.34
Comorbid ICD-9 diagnostic codes in patients with the diagnosis of CDI were ranked in order of frequency. The most common 80% were examined which corresponded to any comorbid code that occurred at a frequency of 25 times or greater. It was felt that diagnoses that occurred less frequently were unlikely to be risk factors for disease. A total of 205 codes were then categorized into clinically similar groups, and a logistic regression model was generated to establish the risk associated with other comorbid conditions. These categories were bacterial infections, fungal infections, cystic fibrosis, neoplastic disease, hematologic disorders, solid organ transplant, hematopoietic stem cell transplantation, malnutrition, IBD, appendicitis, renal disease, liver disease, human immunodeficiency virus, cardiac disease, pancreatitis, gastrostomy tube status, lupus erythematosis, gastroesophageal reflux, and asthma.
Data Analysis
Categorical data were summarized as frequencies and percentages; continuous data were summarized as means with standard errors, and, when data was not normally distributed, by median and quartiles. Comparisons between groups were conducted using chi-square and t-tests. Analysis for trend across the four time periods was performed utilizing multivariate logistic regression, Cochrane Armitage test of trend, and ANOVA for trend. All summary descriptive results and logistic regressions modeling CDI incorporated the HCUP-KID-provided population weights to produce national estimates and appropriate standard errors for significance testing. SAS Enterprise Guide 4.2 (SAS Institute, Cary, NC) was used for all statistical analysis.23
To assess the risk factors for CDI among inpatient pediatric patients, a multivariable logistic regression was fit with the presence or absence of CDI as the dichotomous outcome variable. Covariates were chosen on the basis of theoretical association with CDI. These included demographics (age, sex, race, hospital region, urban versus rural location of the hospital, and payer type), the comorbid conditions identified for this study, and the year of data compilation. Model diagnostics for multi-collinearity were assessed using Spearman correlations as well as tolerance and variance inflation factor statistics.
To account for unobservable confounders that were likely to be associated with both CDI and the severity outcomes under study, a high dimensional propensity score analysis was performed. High dimensional propensity scores were generated by regressing CDI on the demographic and comorbid conditions as described above, and also the presence or absence of 91 of the most severe pediatric conditions associated with death.35 The inclusion of these additional 91 covariates will account for specific associations with CDI or collectively serve as proxies for unobserved confounding variables.36 Patients with an indication of CDI (case) were matched by high dimensional propensity score, using a “greedy matching” algorithm, to patients who did not have CDI (controls), with a 1 to 5 matching ratio. 37
We used multiple logistic regression models to assess the effect of CDI on the likelihood of death, colectomy, and greater than median LOS and charges. The models were risk-adjusted for demographic and comorbid condition variables and the high dimensional propensity score. Odds ratios and 95% confidence intervals are presented to identify strength and significance of CDI and other covariates on the likelihood of cost and severity outcomes.
Results
The total weighted number of inpatient pediatric discharges in the four years under study was 10,474,453, of which 21,273 (0.2%) were identified with a diagnosis of CDI. Demographic data by year are summarized in Table 1. The mean age (± standard error of the mean) of those with CDI was 9.50 (± .07) years versus 11.98 (± .01) years for all others (p<.001). There were significant differences in gender (p<.001), race (p<.001), region (p<.02), urban location (p<.001), and payer type (p<.001) between children with CDI and all other children.
Table 1.
Descriptive profile of children 0–17 years of age with and without Clostridium difficile-associated disease (CDI) on KID hospital discharge files for all of 1997, 2000, 2003, and 2006 (N, n, %)
| Indication of CDI on Hospital Discharge File
|
||
|---|---|---|
| CDI | No CDI | |
| Total Number of Discharges | 21,273 | 10,474,454 |
|
| ||
| n (%) | n (%) | |
|
|
||
| Gender* | ||
| Female | 10,216 (48.0) | 6,226,915 (59.8) |
| Male | 11,028 (51.9) | 4,187,937 (40.2) |
|
| ||
| Race/Ethnicity* | ||
| White | 10,150 (63.6) | 4,246,863 (54.4) |
| Black | 1,976 (12.4) | 1,535,425 (19.7) |
| Hispanic | 3,022 (18.9) | 1,628,273 (20.9) |
| Other | 813 (5.1) | 394,523 (5.0) |
|
| ||
| Geographic Region* | ||
| Northeast | 4,239 (19.9) | 1,948,687 (18.6) |
| Midwest | 4,875 (22.9) | 2,337,166 (22.3) |
| South | 6,609 (31.1) | 3,953,548 (37.8) |
| West | 5,550 (26.1) | 2,235,054 (21.3) |
|
| ||
| Metropolitan Statistical Area | ||
| Urban | 19,061 (92.0) | 8,873,573 (85.8) |
| Rural | 1,661 (8.0) | 1,466,955 (14.2) |
|
| ||
| Insurance | ||
| Private | 11,831 (55.8) | 4,779,054 (45.8) |
| Public | 7,705 (36.3) | 4,586,288 (43.9) |
| Uninsured | 1,675 (7.9) | 1,076,524 (10.3) |
| Mean Age ± SE (Years) | 9.50 ± 0.07 | 11.98 ± 0.01 |
Note: Missing values are the reason numbers across categories, within variables do not sum to total number of discharges. Categorical percentages are presented based on the number reporting. There are significant categorical differences for all variables across CDI and No CDI groups, p<0.001.
There was a large and significant increase in the national trend of cases of CDI in hospitalized children (Figure 1). The average annual percent increase of CDI was 14.9% (p<.001). There was not, however, a significant trend in the four variables utilized as surrogates for disease severity (Table 2). The median LOS remained steady for CDI patients over the four time periods, at 5 to 6 days (p=0.09). Hospital charges increased, but not significantly, with an average annual percent increase of 4.4% for children with CDI versus 2.3% for those without CDI (p=0.06). There were also no significant trends in death rate (p=0.17) or colectomy rate (p=0.09) among patients diagnosed with CDI.
Figure 1. Trend in Clostridium difficile infection(CDI) in hospitalized children, 1997–2006.
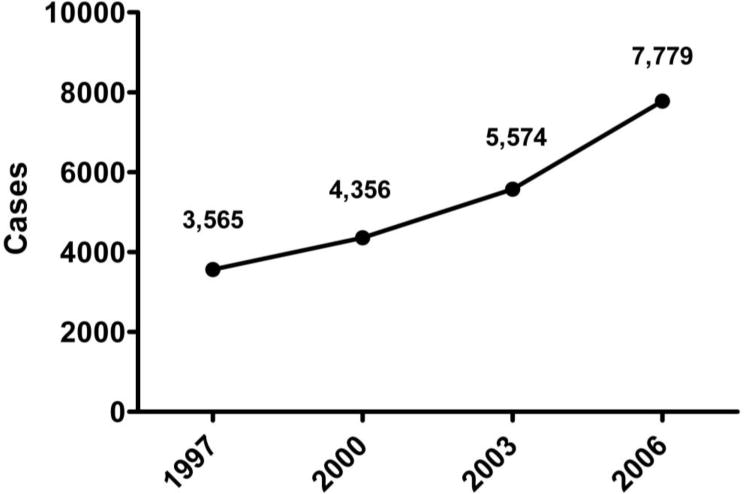
Numbers represent HCUP-KID weighted discharges with the diagnostic ICD-9 code of 008.45 (Clostridium difficile infection). The average annual percent increase was 14.9 % (p<.001).
Table 2.
Descriptive profile of severity outcome measures for discharges in KID 1997, 2000, 2003, and 2006 with and without Clostridium difficile infection(CDI)
| 1997 | 2000 | 2003 | 2006 | |||||
|---|---|---|---|---|---|---|---|---|
|
| ||||||||
| CDI Status | CDI | No CDI | CDI | No CDI | CDI | No CDI | CDI | No CDI |
| Length of Stay (days) | ||||||||
| Median (IQR) | 5* (3–14) | 2 (1–3) | 6* (3–15) | 2 (1–3) | 6* (3–14) | 2 (1–3) | 6* (3–15) | 2 (1–3) |
| Charges | ||||||||
| Median (IQR) | 23,036* (9,542–78,633) | 8,667 (5,175–15,840) | 30,317* (10,232–88,199) | 9,014 (5,404–16,551) | 28,724 (11,765- 87,635) | 10,015 (5,938–18,538) | 31,957* (12,263–99,488) | 10,893* (6,414–20,217) |
| Death Rate per 1000 | 23.6* | 3.* | 19.4* | 3.4 | 16.8 | 3.1 | 19.2* | 2.9 |
| Colectomy Rate per 1000 | 10.0* | 1.1 | 8.6 | 1.2 | 8.0 | 1.3 | 9.5* | 1.4 |
Abbreviations: Interquartile range (IQR)
p<.001 for CDI vs. no CDI by year; Wilcoxon Rank Sum test (Charges, LOS) and Chi-squared test (Death and Colectomy).
Note: Charges are in 2009 consumer price index inflation-adjusted dollars for hospital inpatient services.
Comparing data from all years, CDI discharges versus all other hospital discharges showed a significant impact of the disease (Table 2). In multivariate logistic regression, including all comorbidity risk factors of CDI, demographic risk factors of CDI and the high dimensional propensity scores, children with CDI had an odds ratio for death of 1.20 (1.01–1.43), an odds ratio of 1.36 (1.04–1.79) for colectomy, an odd ratio of 4.34 (3.97–4.83) for LOS higher than the median value, and an odds ratio of 2.12 (1.98–2.26) for charges higher than the median value (Table 3).
Table 3.
Adjusted association between Clostridium difficile infection- (CDI) and Health Severity Indicators (OR, 95% CI)
| Mortality OR (95% CI) | Colectomy OR (95% CI) | Length of Stay OR (95% CI) | Charges* OR (95% CI) | |||
|---|---|---|---|---|---|---|
|
|
||||||
| Main Predictor | Category | Referent | ||||
| CDI | Presence | Absence | 1.20 (1.01–1.43) | 1.36 (1.04–1.79) | 4.34 (3.97–4.83) | 2.12 (1.98–2.26) |
|
| ||||||
| Covariates | ||||||
|
| ||||||
| Age | continuous (0–17) | 1.03 (1.02–1.05) | 1.07 (1.04–1.09) | 1.03 (1.02–1.03) | 1.05 (1.05–1.05) | |
|
| ||||||
| Gender | Female | Male | 0.90 (0.78–1.03) | 0.69 (0.55–0.86) | 1.13 (1.08–1.19) | 0.93 (0.89–0.97) |
|
| ||||||
| Race/Ethnicity | Black | 1.33 (1.08–1.65) | 0.77 (0.53–1.11) | 1.23 (1.13–1.33) | 1.20 (1.12–1.28) | |
| Hispanic | White | 1.07 (0.88–1.29) | 0.76 (0.51–1.11) | 1.18 (1.10–1.29) | 1.35 (1.27–1.44) | |
| Other | 1.23 (0.91–1.67) | 0.83 (0.48–1.42) | 1.15 (1.03–1.29) | 1.36 (1.23–1.50) | ||
|
| ||||||
| Region | Midwest | 1.16 (0.91–1.49) | 1.07 (0.75–1.52) | 1.00 (0.92–1.09) | 0.72 (0.67–0.77) | |
| South | Northeast | 0.94 (0.77–1.15) | 1.24 (0.93–1.64) | 1.08 (1.01–1.16) | 0.89 (0.84–0.94) | |
| West | 1.21 (0.99–1.48) | 1.08 (0.79–1.48) | 0.87 (0.81–0.93) | 1.68 (1.57–1.79) | ||
|
| ||||||
| Insurance | Public | 2.49 (1.39–4.44) | 2.86 (1.39–5.87) | 1.55 (1.42–1.70) | 4.49 (4.11–4.91) | |
| Uninsured | Private | 1.10 (0.94–1.29) | 0.97 (0.73–1.29) | 1.30 (1.23–1.38) | 1.10 (1.05–1.16) | |
|
| ||||||
| c-statistic | 0.81 | 0.90 | 0.75 | 0.77 | ||
Abbreviations: Odds Ratio (OR); Confidence Interval (CI)
Charges are inflation-adjusted to June 2009 dollars utilizing the consumer price index for hospital inpatient services. Note: Results are obtained from fitting separate multivariable logistic regression models on 1:5 case-control matched data. Matching was based on high dimensional propensity scores. Length of stay and charges are modeled as dichotomous with a median cut-point. Models are also adjusted for indication at discharge of being treated for bacterial infections, fungal infections, cystic fibrosis, neoplastic disease, hematologic disorders, solid organ transplant, hematopoietic stem cell transplantation, malnutrition, IBD, appendicitis, renal disease, liver disease, human immunodeficiency virus, cardiac disease, pancreatitis, gastrostomy tube status, lupus erythematosis, gastroesophageal reflux, asthma, as well as the high dimensional propensity score.
Children with CDI had a higher median number of diagnoses than those without - 6 (3–9) versus 3 (2–4), (p<.001). In evaluating these comorbidities and other risk factors, there were nineteen comorbid categories, five demographic variables and time (year) included in the multivariate model. The highest comorbid diagnosis associated with CDI was IBD, with an odds ratio (95% CI) of 11.42 (10.17–12.83). The odds ratios were also high for several other comorbid conditions with primary or secondary immunodeficiency or likely exposure to antibiotics (Table 4). The risk of CDI was lower for blacks, Hispanics and other races when compared to whites. The risk of CDI was highest in the West, lowest in the South, and equal in the Midwest when compared to the Northeast. The risk was higher in urban hospitals versus.rural hospitals. The risk was lower in Medicaid/Medicare patients and other payer type (self pay, no pay) when compared to patients with private insurance/HMO.
Table 4.
Unadjusted and adjusted association of comorbity and demographic variables with Clostridium difficile infection (CDI) (OR, 95% CI)
| Univariate OR (95% CI) | Multivariate OR (95% CI) | |||
|---|---|---|---|---|
|
|
||||
| Comorbid Disease Category (referent is not treated for condition) | ||||
| Inflammatory Bowel Disease | 12.81 (11.75–13.97) | 11.42 (10.16–12.83) | ||
| Solid Organ Transplant | 7.76 (6.91–8.71) | 4.53 (3.92–5.24) | ||
| HIV | 6.16 (4.94–7.69) | 4.09 (3.16–5.30) | ||
| Hematopoietic stem cell transplantation | 19.38 (17.54–21.42) | 3.31 (2.87–3.82) | ||
| Neoplastic Disease | 6.84 (6.53–7.16) | 3.10 (2.89–3.31) | ||
| Fungal Infection | 13.28 (12.13–14.53) | 2.71 (2.39–3.07) | ||
| Cystic Fibrosis | 4.00 (3.47–4.61) | 2.65 (2.22–3.17) | ||
| Pancreatitis | 5.06 (4.44–5.77) | 2.86 (2.41–3.39) | ||
| Hematologic disorders | 5.16 (4.94–5.39) | 2.50 (2.34–2.66) | ||
| Gastrostomy | 6.81 (5.90–7.84) | 2.00 (1.67–2.39) | ||
| Liver Disease | 6.74 (6.11–7.42) | 2.04 (1.80–2.32) | ||
| Malnutrition | 8.50 (7.85–9.22) | 2.39 (2.14–2.67) | ||
| Renal disease | 6.81 (6.45–7.20) | 2.09 (1.99–2.19) | ||
| Systemic lupus erythematosus | 2.95 (2.36–3.70) | 2.06 (1.58–2.68) | ||
| Gastroesophageal reflux | 3.32 (3.04–3.63) | 1.97 (1.76–2.20) | ||
| Bacterial Infection | 2.57 (2.47–2.68) | 1.84 (1.74–1.94) | ||
| Cardiac disease | 2.06 (1.86–2.26) | 1.38 (1.23–1.56) | ||
| Appendicitis | 0.92 (0.82–1.02) | 1.46 (1.28–1.66) | ||
| Asthma | 0.53 (0.49–0.57) | 0.54 (0.49–0.59) | ||
|
| ||||
| Demographic Variables | Category | Referent | ||
|
| ||||
| Gender | Female | Male | 0.62 (0.60–0.65) | 0.83 (0.79–0.96) |
|
| ||||
| Race/Ethnicity | Black | 0.54 (0.50–0.58) | 0.63 (0.58–0.68) | |
| Hispanic | White | 0.78 (0.73–0.82) | 0.78 (0.74–0.83) | |
| Other | 0.86 (0.78–0.95) | 0.85 (0.77–0.94) | ||
|
| ||||
| Region | Midwest | 0.96 (0.90–1.02) | 0.94 (0.86–1.02) | |
| South | Northeast | 0.77 (0.73–0.81) | 0.80 (0.76–0.85) | |
| West | 1.14 (1.08–1.20) | 1.08 (1.02–1.15) | ||
|
| ||||
| Metropolitan Status | Urban | Rural | 1.90 (1.76–2.05) | 1.42 (1.29–1.59) |
|
| ||||
| Insurance | Public | 0.68 (0.65–0.71) | 0.80 (0.76–0.85) | |
| Uninsured | Private | 0.63 (0.58–0.68) | 0.80 (0.73–0.88) | |
|
| ||||
| KID Year | 2000 | 0.98 (0.91–1.06) | 1.07 (0.98–1.16) | |
| 2003 | 1997 | 1.24 (1.17–1.33) | 1.35 (1.25–1.46) | |
| 2006 | 1.75 (1.65–1.86) | 1.87 (1.74–2.01) | ||
Abbreviations: Odds Ratio (OR); Confidence Interval (CI)
Note: Results are obtained from fitting separate multivariable logistic regression models on the 4 years of KID data Univariate models regress CDI on individual covariates only. Multivariable models adjust for all covariates in the table as well as Age (data not shown).
Discussion
Among hospitalized children in the U.S., we identified a significant impact of CDI, with an increasing incidence and several comorbid and demographic risk factors. There was a significant risk and impact of disease associated with the diagnosis of CDI when comparing death rate, colectomy rate, LOS, and charges. We did not find an increase in the severity of CDI over time.
Children with CDI had a greater likelihood of death, colectomy, longer LOS, and higher charges than those without CDI. All of these findings remained statistically significant even after controlling for CDI comorbid conditions associated with the severity outcomes, patient level demographic variables and a high dimensional propensity score associated with acquiring CDI. The uncontrolled death rate, LOS, and charges associated with CDI in children mirrors what is seen for adults with CDI.2, 38, 39 However, the rate of colectomy with the diagnosis of CDI was 10 times less than that reported in adults. 2
There was an observed increase in the rate of pediatric CDI over the four time periods. This increase is consistent with previously published trends in adults and children.2, 12, 40 Zilberberg et al, utilizing an online version of the HCUP-KID data, showed an unadjusted increase in CDI in children.13 Our evaluation of trend confirmed these descriptive findings while controlling for potential confounders in our logistic regression model (See Table 4).
One of the primary risk factors for the development of CDI is antibiotic administration. An upward outpatient trend in antibiotic use could explain the inpatient upward trend in CDI. There is evidence, however, of a downward trend in antibiotic administration in the U.S. during the same time period.41 Another, more likely, explanation is a more widespread dissemination of a more virulent stain of Clostridium difficile, such as the restriction endonuclease analysis group BI, North American Pulsed Field gel electrophoresis type 1, chain reaction ribotype 027 (BI/NAP1/027). The rise in the number of cases and their severity in adult patients has been partially attributed to this strain or as a result of an increase hospitalization rate of those with comorbid diagnoses most at risk for CDI.42, 43 There may also be increasing awareness among health care providers, leading to increased testing in symptomatic patients.
There was no significant trend in the severity of CDI in children as measured by LOS, charges, death rate, colectomy rate, and death. The lack of increase in both rates of colectomy and death associated with CDI agrees with a previous report in children and is in contrast to findings in adult studies.2, 12 We did observe an increase in the consumer price index-adjusted charges over time, however, this increase was not statistically significant (p=.06).
IBD was the most highly associated comorbid diagnosis with CDI. Children with IBD were 11 times more likely to also have a diagnosis of CDI than children without IBD. This supports previous reports in both adults and children.19, 44, 45 Comorbidity is also a known risk factor for CDI in adults and we have shown this in children.46 The additional diagnostic groups identified with an increased risk of CDI were similar for known risk factors previously reported, such as hematopoietic stem cell transplantation, solid organ transplantation, and solid tumors.18, 20, 21, 47 These diagnostic categories, in addition to the others reported in our study, reinforce the known risk of immune suppression or antibiotic exposure.48–50 Increased awareness of groups at highest risk could decrease adverse outcomes, such as death and colectomy through early testing in symptomatic patients, and earlier appropriate treatment.
The finding that CDI is more common in male children agrees with previous reports in pediatrics.12 However, this gender discrepancy is reversed in adult hospitalized patients.2 Patients with CDI were significantly younger than those without. This could be explained by increased antibiotic pressure in younger children, bias to test for CDI in younger patients, or a true susceptibility to disease at a younger age. In adults, it is the elderly who are at the greatest risk of disease; thus, CDI may be a disease affecting the extremes of age, with adolescents and younger adults being relatively spared. We found a higher risk of CDI in the West and a lower risk in the South. A previous national study of primarily adult cases of CDI showed the highest incidence in the Northeast.51 It is also interesting that, in the overall analysis, there was a decreased risk of CDI associated with Medicaid or other pay types (self pay/no pay). This may represent a decreased risk of disease in these patients because of a lower exposure to antibiotics for routine infections (acute otitis media, etc) compared to those with private insurance.
In evaluating the severity markers, we identified that females had the same risk of mortality, however, they had longer LOS and higher charges. Blacks had an increased risk of death, longer LOS, and higher charges. We were not able to examine the full scope of these findings, however, further research in disparities of care may be justified in this area. There was an increased risk of all severity markers at urban hospitals versus rural hospitals, which, despite extensive controlling, may still be due to referral bias not captured in the analysis.
The HCUP-KID provides an excellent national representative sample of pediatric hospitalizations and can be applied to extrapolate nationwide estimates and trends. The sample size allowed us to conduct the largest and broadest reported study of CDI in children. Use of HCUP-KID does, however, have several weaknesses. Our definition of CDI was entirely based on ICD-9 coding. As in all studies utilizing diagnostic codes, there is concern for paucity of clinical information. We were unable to verify the specific strain of CDI, medical treatments given, or location of acquired infection (outpatient versus nosocomial). This is particularly important as community-associated disease is increasingly recognized and not all cases are associated with exposure to healthcare facilities or antimicrobial treatment. Misclassification and reporting bias are both potential weaknesses. C. difficile is common commensal organism in infancy.24–30 The age at which C. difficile become pathologic is unclear but likely after the first year of life.7, 31 We excluded children less than one year of age in an effort to avoid misclassification bias. Previous studies in both adults and children have validated the CDI ICD-9 code as representing true disease.32, 33 There is more recent evidence that C. difficile may also exist in a carrier state, e.g., in patients with IBD52. Because the HCUP-KID database reports hospital discharges, not individual patients, it was not possible to distinguish patients readmitted to the hospital for the same diagnosis.
The population-based data in our study provide additional evidence that CDI cases have a significant impact in the pediatric population. Our study supports previous reports that CDI is increasing among hospitalized children and provides a background for understanding changing trends and risk factors of CDI in children. Increasing awareness of these risk factors and an upward trend in hospitalized children with CDI is the first step in controlling this important infection.
Acknowledgments
Funding/Support: Dr. Goudie was supported on this project through the Agency for Healthcare Research and Quality grant HS 016957. Dr. Nylund is employed by the United States Air Force. The views expressed in this article are those of the authors and do not reflect the official policy or position of the United States Air Force, Department of Defense, or the U.S. Government.
Footnotes
Author Contributions: Drs. Nylund and Goudie had full access to all the data in the study and takes responsibility for the integrity of the data and accuracy of the data analysis Study Concept and Design: Nylund, Goudie, Fairbrother Garza. Analysis and interpretation of data: Nylund, Goudie, Garza, Fairbrother, Cohen. Drafting of Manuscript: Nylund. Critical revision of the manuscript for important intellectual content: Nylund, Goudie, Garza, Fairbrother, Cohen. Statistical Analysis: Goudie, Nylund.
Financial Disclosures: The authors have no financial arrangement or disclosures.
Previous Presentations: Results presented in this paper have been previously presented in abstract form at the proceedings of Digestive Disease Week, 2010 in New Orleans, LA.
Additional Contributions: The authors wish to thank Pamela J. Schoettker, MS, Medical Writer, Division of Health Policy and Clinical Effectiveness, Cincinnati Children’s Hospital Medical Center, for her editorial assistance.
References
- 1.Zilberberg MD, Shorr AF, Kollef MH. Increase in adult Clostridium difficile-related hospitalizations and case-fatality rate, United States, 2000–2005. Emerg Infect Dis. 2008 Jun;14(6):929–931. doi: 10.3201/eid1406.071447. [DOI] [PMC free article] [PubMed] [Google Scholar]
- 2.Ricciardi R, Rothenberger DA, Madoff RD, Baxter NN. Increasing prevalence and severity of Clostridium difficile colitis in hospitalized patients in the United States. Arch Surg. 2007 Jul;142(7):624–631. doi: 10.1001/archsurg.142.7.624. discussion 631. [DOI] [PubMed] [Google Scholar]
- 3.Barbut F, Decre D, Lalande V, et al. Clinical features of Clostridium difficile-associated diarrhoea due to binary toxin (actin-specific ADP-ribosyltransferase)-producing strains. J Med Microbiol. 2005 Feb;54(Pt 2):181–185. doi: 10.1099/jmm.0.45804-0. [DOI] [PubMed] [Google Scholar]
- 4.Warny M, Pepin J, Fang A, et al. Toxin production by an emerging strain of Clostridium difficile associated with outbreaks of severe disease in North America and Europe. Lancet. 2005 Sep 24–30;366(9491):1079–1084. doi: 10.1016/S0140-6736(05)67420-X. [DOI] [PubMed] [Google Scholar]
- 5.Kelly CP, LaMont JT. Clostridium difficile–more difficult than ever. N Engl J Med. 2008 Oct 30;359(18):1932–1940. doi: 10.1056/NEJMra0707500. [DOI] [PubMed] [Google Scholar]
- 6.McDonald LC, Killgore GE, Thompson A, et al. An epidemic, toxin gene-variant strain of Clostridium difficile. N Engl J Med. 2005 Dec 8;353(23):2433–2441. doi: 10.1056/NEJMoa051590. [DOI] [PubMed] [Google Scholar]
- 7.Bryant K, McDonald LC. Clostridium difficile infections in children. Pediatr Infect Dis J. 2009 Feb;28(2):145–146. doi: 10.1097/INF.0b013e318198c984. [DOI] [PubMed] [Google Scholar]
- 8.Toltzis P, Kim J, Dul M, Zoltanski J, Smathers S, Zaoutis T. Presence of the epidemic North American Pulsed Field type 1 Clostridium difficile strain in hospitalized children. J Pediatr. 2009 Apr;154(4):607–608. doi: 10.1016/j.jpeds.2008.10.016. [DOI] [PubMed] [Google Scholar]
- 9.Ricciardi R, Harriman K, Baxter NN, Hartman LK, Town RJ, Virnig BA. Predictors of Clostridium difficile colitis infections in hospitals. Epidemiol Infect. 2008 Jul;136(7):913–921. doi: 10.1017/S0950268807009387. [DOI] [PMC free article] [PubMed] [Google Scholar]
- 10.Severe Clostridium difficile-associated disease in populations previously at low risk–four states, 2005. MMWR Morb Mortal Wkly Rep. 2005 Dec 2;54(47):1201–1205. [PubMed] [Google Scholar]
- 11.Pokorn M, Radsel A, Cizman M, et al. Severe Clostridium difficile-associated disease in children. Pediatr Infect Dis J. 2008 Oct;27(10):944–946. doi: 10.1097/INF.0b013e3181723d32. [DOI] [PubMed] [Google Scholar]
- 12.Kim J, Smathers SA, Prasad P, Leckerman KH, Coffin S, Zaoutis T. Epidemiological features of Clostridium difficile-associated disease among inpatients at children’s hospitals in the United States, 2001–2006. Pediatrics. 2008 Dec;122(6):1266–1270. doi: 10.1542/peds.2008-0469. [DOI] [PubMed] [Google Scholar]
- 13.Zilberberg MD, Tillotson GS, McDonald C. Clostridium difficile infections among hospitalized children, United States, 1997–2006. Emerg Infect Dis. Apr;16(4):604–609. doi: 10.3201/eid1604.090680. [DOI] [PMC free article] [PubMed] [Google Scholar]
- 14.Thomas C, Stevenson M, Riley TV. Antibiotics and hospital-acquired Clostridium difficile-associated diarrhoea: a systematic review. J Antimicrob Chemother. 2003 Jun;51(6):1339–1350. doi: 10.1093/jac/dkg254. [DOI] [PubMed] [Google Scholar]
- 15.Wistrom J, Norrby SR, Myhre EB, et al. Frequency of antibiotic-associated diarrhoea in 2462 antibiotic-treated hospitalized patients: a prospective study. J Antimicrob Chemother. 2001 Jan;47(1):43–50. doi: 10.1093/jac/47.1.43. [DOI] [PubMed] [Google Scholar]
- 16.Dial S, Delaney JA, Schneider V, Suissa S. Proton pump inhibitor use and risk of community-acquired Clostridium difficile-associated disease defined by prescription for oral vancomycin therapy. Cmaj. 2006 Sep 26;175(7):745–748. doi: 10.1503/cmaj.060284. [DOI] [PMC free article] [PubMed] [Google Scholar]
- 17.Kamthan AG, Bruckner HW, Hirschman SZ, Agus SG. Clostridium difficile diarrhea induced by cancer chemotherapy. Arch Intern Med. 1992 Aug;152(8):1715–1717. [PubMed] [Google Scholar]
- 18.Bobak D, Arfons LM, Creger RJ, Lazarus HM. Clostridium difficile-associated disease in human stem cell transplant recipients: coming epidemic or false alarm? Bone Marrow Transplant. 2008 Oct 6; doi: 10.1038/bmt.2008.317. [DOI] [PubMed] [Google Scholar]
- 19.Rodemann JF, Dubberke ER, Reske KA, Seo da H, Stone CD. Incidence of Clostridium difficile infection in inflammatory bowel disease. Clin Gastroenterol Hepatol. 2007 Mar;5(3):339–344. doi: 10.1016/j.cgh.2006.12.027. [DOI] [PubMed] [Google Scholar]
- 20.Castagnola E, Battaglia T, Bandettini R, et al. Clostridium difficile-associated disease in children with solid tumors. Support Care Cancer. 2008 Sep 19; doi: 10.1007/s00520-008-0507-0. [DOI] [PubMed] [Google Scholar]
- 21.Gunderson CC, Gupta MR, Lopez F, et al. Clostridium difficile colitis in lung transplantation. Transpl Infect Dis. 2008 Jul;10(4):245–251. doi: 10.1111/j.1399-3062.2008.00305.x. [DOI] [PubMed] [Google Scholar]
- 22.Pascarella F, Martinelli M, Miele E, Del Pezzo M, Roscetto E, Staiano A. Impact of Clostridium difficile infection on pediatric inflammatory bowel disease. J Pediatr. 2009 Jun;154(6):854–858. doi: 10.1016/j.jpeds.2008.12.039. [DOI] [PubMed] [Google Scholar]
- 23.Healthcare Cost and Utilization Project (HCUP) Agency for Healthcare Research and Quality; Rockville, MD: Sep, 2009. 2006 Introduction to the KID. www.hcup-us.ahrq.gov/db/nation/kid/kid_2006_introduction.jsp. [PubMed] [Google Scholar]
- 24.Al-Jumaili IJ, Shibley M, Lishman AH, Record CO. Incidence and origin of Clostridium difficile in neonates. J Clin Microbiol. 1984 Jan;19(1):77–78. doi: 10.1128/jcm.19.1.77-78.1984. [DOI] [PMC free article] [PubMed] [Google Scholar]
- 25.Bacon AE, Fekety R, Schaberg DR, Faix RG. Epidemiology of Clostridium difficile colonization in newborns: results using a bacteriophage and bacteriocin typing system. J Infect Dis. 1988 Aug;158(2):349–354. doi: 10.1093/infdis/158.2.349. [DOI] [PubMed] [Google Scholar]
- 26.Enad D, Meislich D, Brodsky NL, Hurt H. Is Clostridium difficile a pathogen in the newborn intensive care unit? A prospective evaluation. J Perinatol. 1997 Sep-Oct;17(5):355–359. [PubMed] [Google Scholar]
- 27.Larson HE, Barclay FE, Honour P, Hill ID. Epidemiology of Clostridium difficile in infants. J Infect Dis. 1982 Dec;146(6):727–733. doi: 10.1093/infdis/146.6.727. [DOI] [PubMed] [Google Scholar]
- 28.Matsuki S, Ozaki E, Shozu M, et al. Colonization by Clostridium difficile of neonates in a hospital, and infants and children in three day-care facilities of Kanazawa, Japan. Int Microbiol. 2005 Mar;8(1):43–48. [PubMed] [Google Scholar]
- 29.Stark PL, Lee A, Parsonage BD. Colonization of the large bowel by Clostridium difficile in healthy infants: quantitative study. Infect Immun. 1982 Mar;35(3):895–899. doi: 10.1128/iai.35.3.895-899.1982. [DOI] [PMC free article] [PubMed] [Google Scholar]
- 30.Tina LG, Proto N, Sciacca A. Asymptomatic intestinal colonization by Clostridium difficile in preterm neonates. Pediatr Infect Dis J. 1994 Dec;13(12):1158–1159. doi: 10.1097/00006454-199412000-00023. [DOI] [PubMed] [Google Scholar]
- 31.Tullus K, Aronsson B, Marcus S, Mollby R. Intestinal colonization with Clostridium difficile in infants up to 18 months of age. Eur J Clin Microbiol Infect Dis. 1989 May;8(5):390–393. doi: 10.1007/BF01964052. [DOI] [PubMed] [Google Scholar]
- 32.Shaklee J, Leckerman K, Elward A, et al. Validation of an ICD-9-CM Code for Identifying Children Hospitalized with Clostridium difficile Infection; Paper presented at: Infectious Diseases Society of America Annual Meeting; October 31, 2009; Philadelphia, Pennsylvania. 2009. [Google Scholar]
- 33.Dubberke ER, Reske KA, McDonald LC, Fraser VJ. ICD-9 codes and surveillance for Clostridium difficile-associated disease. Emerg Infect Dis. 2006 Oct;12(10):1576–1579. doi: 10.3201/eid1210.060016. [DOI] [PMC free article] [PubMed] [Google Scholar]
- 34.CPI Detailed Report. 2008 http://www.bls.gov/cpi/home.htm.
- 35.Tai D, Dick P, To T, Wright JG. Development of pediatric comorbidity prediction model. Arch Pediatr Adolesc Med. 2006 Mar;160(3):293–299. doi: 10.1001/archpedi.160.3.293. [DOI] [PubMed] [Google Scholar]
- 36.Schneeweiss S, Rassen JA, Glynn RJ, Avorn J, Mogun H, Brookhart MA. High-dimensional propensity score adjustment in studies of treatment effects using health care claims data. Epidemiology. 2009 Jul;20(4):512–522. doi: 10.1097/EDE.0b013e3181a663cc. [DOI] [PMC free article] [PubMed] [Google Scholar]
- 37.Parsons LS. Proceedings of the Twenty-Ninth Annual SAS® Users Group International Conference. Vol Montréal, Canada: SAS Institute Inc; 2004. Performing a 1:N Case-Control Match on Propensity Score. [Google Scholar]
- 38.Dubberke ER, Reske KA, Olsen MA, McDonald LC, Fraser VJ. Short- and long-term attributable costs of Clostridium difficile-associated disease in nonsurgical inpatients. Clin Infect Dis. 2008 Feb 15;46(4):497–504. doi: 10.1086/526530. [DOI] [PubMed] [Google Scholar]
- 39.Song X, Bartlett JG, Speck K, Naegeli A, Carroll K, Perl TM. Rising economic impact of clostridium difficile-associated disease in adult hospitalized patient population. Infect Control Hosp Epidemiol. 2008 Sep;29(9):823–828. doi: 10.1086/588756. [DOI] [PubMed] [Google Scholar]
- 40.Archibald LK, Banerjee SN, Jarvis WR. Secular trends in hospital-acquired Clostridium difficile disease in the United States, 1987–2001. J Infect Dis. 2004 May 1;189(9):1585–1589. doi: 10.1086/383045. [DOI] [PubMed] [Google Scholar]
- 41.Miller EG, Carroll WA. Trends in Children’s Antibiotic Use: 1996 to 2001. Quality AfHRa. 2005 [Google Scholar]
- 42.O’Connor JR, Johnson S, Gerding DN. Clostridium difficile infection caused by the epidemic BI/NAP1/027 strain. Gastroenterology. 2009 May;136(6):1913–1924. doi: 10.1053/j.gastro.2009.02.073. [DOI] [PubMed] [Google Scholar]
- 43.Miller M, Gravel D, Mulvey M, et al. Health care-associated Clostridium difficile infection in Canada: patient age and infecting strain type are highly predictive of severe outcome and mortality. Clin Infect Dis. Jan 15;50(2):194–201. doi: 10.1086/649213. [DOI] [PubMed] [Google Scholar]
- 44.Ananthakrishnan AN, McGinley EL, Binion DG. Excess hospitalisation burden associated with Clostridium difficile in patients with inflammatory bowel disease. Gut. 2008 Feb;57(2):205–210. doi: 10.1136/gut.2007.128231. [DOI] [PubMed] [Google Scholar]
- 45.Issa M, Vijayapal A, Graham MB, et al. Impact of Clostridium difficile on inflammatory bowel disease. Clin Gastroenterol Hepatol. 2007 Mar;5(3):345–351. doi: 10.1016/j.cgh.2006.12.028. [DOI] [PubMed] [Google Scholar]
- 46.Eilixhauser A. Clostridium Difficile-Associated Disease in U.S. Hospitals 1993–2005. HCUP Statisical Brief #50. [2008; http://www.hcup-us.ahrq.gov/reports/statbriefs/sb50.pdf. Accessed December, 2009.
- 47.Wong NA, Bathgate AJ, Bellamy CO. Colorectal disease in liver allograft recipients – a clinicopathological study with follow-up. Eur J Gastroenterol Hepatol. 2002 Mar;14(3):231–236. doi: 10.1097/00042737-200203000-00005. [DOI] [PubMed] [Google Scholar]
- 48.Sharma AK, Holder FE. Clostridium difficile diarrhea after use of tacrolimus following renal transplantation. Clin Infect Dis. 1998 Dec;27(6):1540–1541. doi: 10.1086/517744. [DOI] [PubMed] [Google Scholar]
- 49.Pepin J, Saheb N, Coulombe MA, et al. Emergence of fluoroquinolones as the predominant risk factor for Clostridium difficile-associated diarrhea: a cohort study during an epidemic in Quebec. Clin Infect Dis. 2005 Nov 1;41(9):1254–1260. doi: 10.1086/496986. [DOI] [PubMed] [Google Scholar]
- 50.Loo VG, Poirier L, Miller MA, et al. A predominantly clonal multi-institutional outbreak of Clostridium difficile-associated diarrhea with high morbidity and mortality. N Engl J Med. 2005 Dec 8;353(23):2442–2449. doi: 10.1056/NEJMoa051639. [DOI] [PubMed] [Google Scholar]
- 51.Zilberberg MD, Shorr AF, Kollef MH. Growth and geographic variation in hospitalizations with resistant infections, United States, 2000–2005. Emerg Infect Dis. 2008 Nov;14(11):1756–1758. doi: 10.3201/eid1411.080337. [DOI] [PMC free article] [PubMed] [Google Scholar]
- 52.Clayton EM, Rea MC, Shanahan F, et al. The vexed relationship between Clostridium difficile and inflammatory bowel disease: an assessment of carriage in an outpatient setting among patients in remission. Am J Gastroenterol. 2009 May;104(5):1162–1169. doi: 10.1038/ajg.2009.4. [DOI] [PubMed] [Google Scholar]