Atrial fibrillation (AF) is one of the most common arrhythmias, but its mechanisms remain unclear due to the complex human atrial structure and pathology of this disease1,2. High resolution optical mapping3 and 3D structural imaging of the atria in ex vivo animal models4 have provided a wealth of information for better understanding of AF1. However, these high resolution techniques cannot currently be performed in patients to directly uncover the important role of atrial anatomical substrates in pathophysiological conduction3. For the first time in the intact human heart, this study integrates functional data collected by high resolution near infrared optical mapping with the 3D atrial structure of the same heart obtained by novel micro-CT imaging to investigate the structural basis for conduction during sinus rhythm (SR), atrial pacing and sustained atrial flutter (AFL) and AF.
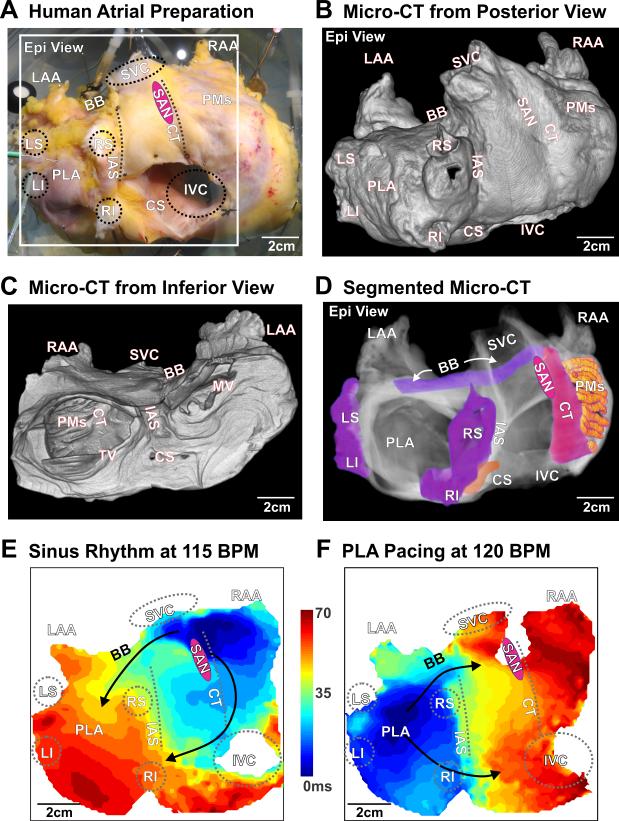
An intact explanted human heart (unused donor, 63 y.o. female, chronic hypertension, heart weight 608 g) from the Lifeline of Ohio Organ Procurement Organization was obtained in the operating room at the time of cross-clamp and immediately preserved with cold cardioplegic solution (1-3°C) in accordance with The Ohio State University Institutional Review Board. Whole intact atria were dissected from ventricles and coronary-perfused with oxygenated Tyrode solution at constant pressure (55-60 mmHg) and temperature (37°C). Sub-Epicardial optical mapping of the whole coronary-perfused atria was conducted with near-infrared voltage-sensitive dye di-4-ANBDQBS3 to detect and map atrial activations during SR, posterior left atrium (PLA) pacing, and pacing-induced sustained AFL and AF (Figures 1-3). A high spatial (100×100 pixels, 1.16×1.16 mm2) and temporal (1 frame/ms) resolution Ultima-L CMOS camera (SciMedia, Japan) was focused on both atria from the epicardial surface (Figure 1A). After functional mapping, the human atria was formalin-fixed for 48 hours, then washed with PBS and incubated at 4°C in 25% Lugol's iodine solution for 6 days. The whole atria (6×10×15 cm3) were imaged by a micro PET-CT (Inveon, Siemens) scanner with a resolution of 49×49×49 μm3 in two bed positions combined using the 30% overlap. Atrial structure was further smoothed and segmented according to their known anatomical features and digitally reconstructed in 3D (Figures 1B-D, Supplemental Figure I & Movie I and V). The structure tensor approach with 3D Eigen-analysis utilized the X-ray signal intensity of the original micro-CT images to characterize 3D myofiber field, adapted from histological reconstructions4 (see also Supplemental Methods). The optical mapping and micro-CT images were reconciled using atrial anatomical landmarks and pin holes placed at the completion of optical mapping.
Figure 1.
High resolution optical and structural mapping of an explanted human heart during sinus rhythm (SR) and posterior left atrium (PLA) pacing. A. Coronary-perfused, explanted intact human atria; white box indicates optical mapping field of view from the epicardial surface. Novel micro-CT imaging of the optically mapped the heart at a spatial resolution of 49×49×49 μm3 visualized from an anterior (B) and posterior (C) view. Significant anatomical regions across and within both atrial chambers are highlighted (D). In the activation map of SR at 115 BPM (E) and PLA pacing at 120 BPM (F), black arrows indicate fastest conduction along major muscular bundles (B, C&D). BB – Bachmann's bundle, CS – coronary sinus, CT – crista terminalis, Epi – epicardial, LS/LI/RS/RI – left superior/left inferior/right superior/right inferior pulmonary vein, IVC/SVC – inferior/superior vena cava, LAA/RAA – left/right atrial appendage, PLA – posterior left atrium, PMs – pectinate muscles, SAN – sinoatrial node, LRA – lateral right atrium, MV – mitral valve, TV – tricuspid valve, IAS – interatrial septum.
Figure 3.
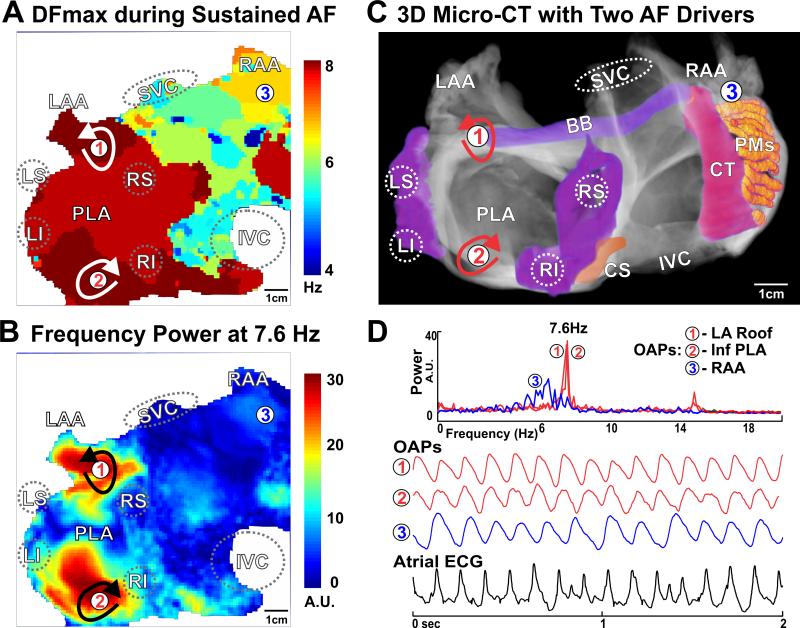
Sustained Atrial Fibrillation. A. Dominant frequency (DF) analysis of the pacing-induced sustained AF displays estimated frequency across the human atria and indicates the highest frequency in the PLA. B. Power analysis at the highest dominant frequency (7.6Hz) shows two discrete islands of stable activity; black arrows indicate the two competing stationary drivers. C. Locations of the reentrant AF drivers were marked by red arrows on the micro-CT reconstruction of atria. D. OAPs from the left atrial roof, floor, and LRA denoted as 1-3, along with atrial ECG. OAPs – optical action potentials; See Figure 1 for other abbreviations.
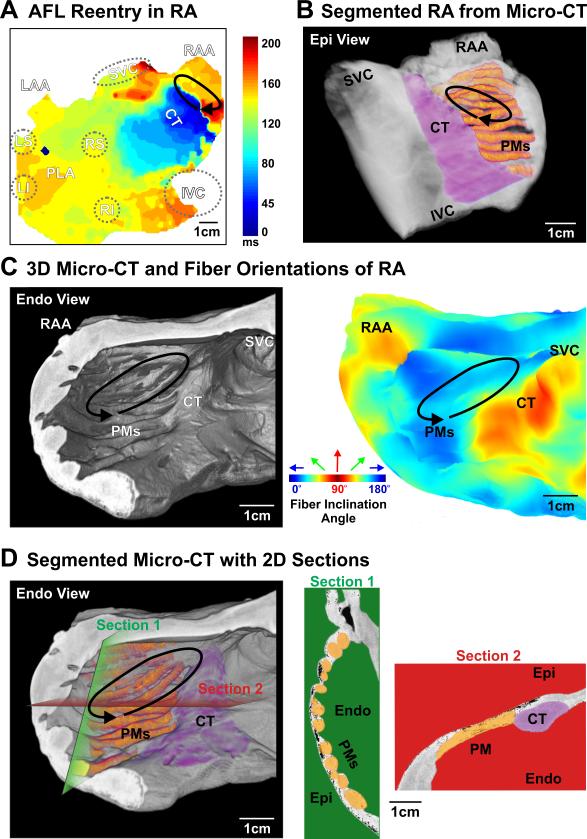
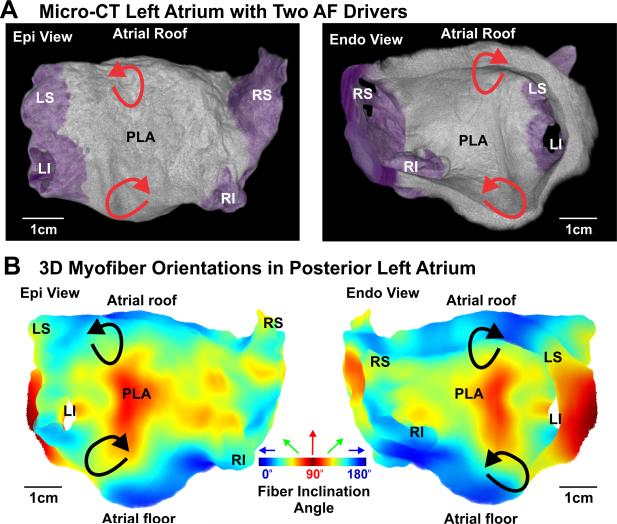
During SR at baseline (59 bpm) and 10 nM isoproterenol perfusion (115 bpm), integration of optical mapping and micro-CT imaging revealed that the electrical wavefront originated from the sinoatrial node in the superior crista terminalis and propagated from the right to the left atrium (RA and LA) through inter-atrial muscular bundles such as Bachmann's bundle (BB) and septal pathways (Figures 1E & Movie II). PLA pacing (120 bpm) (Figure 1F & Movie III) led to retrograde inter-atrial conduction from the LA to RA through the same structural pathways. Major atrial muscular bundles are highlighted in Figure 1D. Acceleration of PLA pacing led to conduction anisotropy, magnified in pectinate muscle (PM) bundles in the lateral RA, and eventually unidirectional block and reentrant AFL (267 bpm), while the LA was passively activated by the BB and septal pathways (Figure 2A & Movie IV). Micro-CT revealed that endocardial PMs and their intersection with the crista terminalis formed an anatomical track that anchored the AFL reentry (Figures 2B-D). Burst atrial pacing also induced an episode of sustained AF (>75 min). Dominant frequency (DF) analysis indicates two discrete driver regions in the LA with higher frequency (7.6 Hz) and power (stability) than the RA (Figure 3A). Due to intermittent failure of 1:1 conduction, the atrial regions outside of the stationed reentrant AF drivers had slower activation frequencies (Figures 3B&D) and disorganized multi-wavebreak activity. Abrupt changes in myofiber orientation at intersections between the circumferential atrial roof/floor and the longitudinal PLA bundle provided substrates anchoring these drivers to the anatomic musculature (Figure 4B). Our study for the first time provides direct evidence that the atrial myofiber orientation determines the specific activation patterns in both RA and LA, during SR, pacing, AFL and AF in intact human atria.
Figure 2.
Atrial flutter: pectinate muscle (PM) structure sustains reentry in human LRA. A. Activation map of the human atria shows a reentry circuit in the LRA (solid arrow) with passive left atrial activation through major bundles shown in Figure 1. B. PMs and CT in the LRA are highlighted and the location of reentry is indicated from the epicardium of the reconstructed 3D atrial LRA. C. Left: the LRA and the location of reentry are indicated from endocardium of the atrial LRA; Right: 3D myofiber orientation of the LRA in absolute inclination angle with the angle range from 0° to 90° is shown from the endocardium. Here the inclination angle is defined as the angle between each individual fiber angle with its projection on the XY imaging plane; Blue is 0°, green is 45° and red is 90°. D. Left: endocardial PMs in the LRA are highlighted; Right: 2D anatomical sections taken from the green and red planes are displayed to demonstrate tissue variation and major muscular bundles (CT & PMs) in the LRA. See Figure 1 for other abbreviations.
Figure 4.
AF reentrant driver locations correlate with myofiber structure in the posterior left atrium (PLA). A. Anatomical structure of the PLA is displayed from posterior/epicardial (left) and anterior/endocardial (right) views, respectively. B. 3D myofiber orientation of the PLA in absolute inclination angles with the angle range from 0° to 90° is shown from the posterior/epicardial (left) and anterior/endocardial (right) surface; Blue is 0°, green is 45° and red is 90°. The two AF driver locations are indicated on the 3D reconstructed atrial anatomy by red arrows (A) and black arrows (B), where a longitudinal PLA bundle intersects the circumferential atrial roof and floor. See Figure 1 for other abbreviations.
Supplementary Material
Acknowledgments
We sincerely thank the Lifeline of Ohio Organ Procurement Organization for providing the explanted heart and Mr. Benjamin Canan and Mr. Eric Schultz for help with tissue processing. We also thank the Wright Center of Innovation in Biomedical Imaging at The Ohio State University for imaging assistance.
Funding Sources: This work was supported by NIH HL115580 (VVF), by the International Mobility Fund from Royal Society of New Zealand (JZ and VVF), and by funding from Dorothy M. Davis Heart and Lung Research Institute, The Ohio State University.
Footnotes
Conflict of Interest Disclosures: None
References
- 1.Allessie MA, de Groot NM, Houben RP, Schotten U, Boersma E, Smeets JL, Crijns H. Electropathological substrate of long-standing persistent atrial fibrillation in patients with structural heart disease: longitudinal dissociation. Circ Arrhythm Electrophysiol. 2010;3:606–615. doi: 10.1161/CIRCEP.109.910125. [DOI] [PubMed] [Google Scholar]
- 2.Ho SY, Cabrera JA, Sanchez-Quintana D. Left atrial anatomy revisited. Circ Arrhythm Electrophysiol. 2012;5:220–228. doi: 10.1161/CIRCEP.111.962720. [DOI] [PubMed] [Google Scholar]
- 3.Glukhov AV, Hage LT, Hansen BJ, Pedraza-Toscano A, Vargas-Pinto P, Hamlin RL, Weiss R, Carnes CA, Billman GE, Fedorov VV. Sinoatrial node reentry in a canine chronic left ventricular infarct model: role of intranodal fibrosis and heterogeneity of refractoriness. Circ Arrhythm Electrophysiol. 2013;6:984–994. doi: 10.1161/CIRCEP.113.000404. [DOI] [PMC free article] [PubMed] [Google Scholar]
- 4.Zhao J, Butters TD, Zhang H, Pullan AJ, LeGrice IJ, Sands GB, Smaill BH. An image-based model of atrial muscular architecture: effects of structural anisotropy on electrical activation. Circ Arrhythm Electrophysiol. 2012;5:361–370. doi: 10.1161/CIRCEP.111.967950. [DOI] [PubMed] [Google Scholar]
Associated Data
This section collects any data citations, data availability statements, or supplementary materials included in this article.


