

Abstract
How humans integrate information to form beliefs about reality is a question that has engaged scientists for centuries, yet the biological system supporting this process is not well understood. One of the most salient attributes of information is valence. Whether a piece of news is good or bad is critical in determining whether it will alter our beliefs. Here, we reveal a frontal–subcortical circuit in the left hemisphere that is simultaneously associated with enhanced integration of favorable information into beliefs and impaired integration of unfavorable information. Specifically, for favorable information, stronger white matter connectivity within this system, particularly between the left inferior frontal gyrus (IFG) and left subcortical regions (including the amygdala, hippocampus, thalamus, putamen, and pallidum), as well as insular cortex, is associated with greater change in belief. However, for unfavorable information, stronger connectivity within this system, particularly between the left IFG and left pallidum, putamen, and insular cortex, is associated with reduced change in beliefs. These novel results are consistent with models suggesting that partially separable processes govern learning from favorable and unfavorable information.
SIGNIFICANCE STATEMENT Beliefs of what may happen in the future are important, because they guide decisions and actions. Here, we illuminate how structural brain connectivity is related to the generation of subjective beliefs. We focus on how the valence of information is related to people's tendency to alter their beliefs. By quantifying the extent to which participants update their beliefs in response to desirable and undesirable information and relating those measures to the strength of white matter connectivity using diffusion tensor imaging, we characterize a left frontal–subcortical system that is associated simultaneously with greater belief updating in response to favorable information and reduced belief updating in response to unfavorable information. This neural architecture may allow valence to be incorporated into belief updating.
Keywords: belief updating, DTI, frontal-subcortical circuit, individual differences, valence, white-matter connectivity
Introduction
Human decision-making is guided by beliefs of what may happen in the future, which are updated in response to new information. Whether new information will significantly alter our views is influenced partially by the question: is the news good or bad? In particular, people tend to alter self-relevant beliefs to a greater extent in response to favorable compared with unfavorable information (Eil and Rao, 2011; Sharot et al., 2011), although significant individual differences exist (Sharot et al., 2011; Moutsiana et al., 2013; Chowdhury et al., 2014; Garrett et al., 2014).
The finding that valence affects how we alter beliefs fits with the notion that emotion is fundamental to decision-making (Loewenstein et al., 2001; Loewenstein and Lerner, 2003; Bechara and Damasio, 2005; Bossaerts, 2009). Indeed, updating beliefs involves not only brain regions known to perform complex cognitive functions, such as regions of the frontal lobe (Li et al., 2011a; Sharot et al., 2011; d'Acremont et al., 2013), but also key structures for emotion, including the amygdala (Li et al., 2011b), insula (Huber et al., 2015), and striatum (Li et al., 2011a; d'Acremont et al., 2013), which also code statistical features used for belief formation (Christopoulos et al., 2009; for review, see Bossaerts, 2009; Gläscher et al., 2010; Payzan-LeNestour et al., 2013). This leads to the hypothesis that the effect of valence on belief updating is related to the ability of these regions to interact.
Although certain cognitive and perceptual demands can be attributed to functionally specialized regions (Kanwisher, 2010), learning is thought to be mediated by adaptive and dynamic networks (Lee et al., 2012), which can be characterized using connectivity analyses (Conturo et al., 1999; Catani et al., 2002). Frontal–subcortical circuits in particular are principal in mediating learning and behavior (Mega and Cummings, 1994). Abnormalities in this neural circuitry, such as disruption of the connectivity between the nodes, are associated with a variety of cognitive, affective, and neuropsychiatric disorders (Mayberg, 1997; Tekin and Cummings, 2002).
We hypothesize that valence-dependent belief updating involves a complex network that links cortical regions with subcortical structures known to be important for emotion, valuation, and learning. To test this and characterize the neurological system mediating valence-dependent learning, we capitalize on individual differences in both brain structure and behavior. This approach has been used successfully in the past to study the neural systems underlying metacognition (Fleming et al., 2010), reward learning (Samanez-Larkin et al., 2012), and long-term memory (Cohen, 2011), to name a few (for review, see Kanai and Rees, 2011).
We use probabilistic tractography (Johansen-Berg and Rushworth, 2009) to identify white matter (WM) tracts connecting frontal and subcortical regions, the strength of which correlates with asymmetric information integration across individuals. We selected the medial frontal cortex (MFC) and inferior frontal gyrus (IFG) as seed regions because of preliminary evidence that asymmetric error coding in these regions is associated with valence-dependent learning asymmetries (Sharot et al., 2011). The left IFG especially has been shown to play a role in both coding errors in response to unexpected desirable news (Sharot et al., 2011) and inhibiting learning from errors in response to unexpected undesirable news as suggested by a transcranial magnetic stimulation (TMS) study (Sharot et al., 2012). These findings can be interpreted in light of literature suggesting that the IFG encodes “Bayesian surprise,” reflecting violation of expectation based on a combination of previous knowledge with new evidence (d'Acremont et al., 2013). It is also in accord with documented functions of the IFG in error monitoring (Mitchell et al., 2009), reversal learning (Cools et al., 2002), risk prediction error (d'Acremont et al., 2009), and inhibition (Aron et al., 2004). However, it is unlikely to mediate valence-dependent integration of information in isolation. The IFG does not code for valence per se, neither is it thought to mediate reward processing. Thus, we seek a more comprehensive characterization of the neural system that gives rise to valence-dependent belief updating.
Materials and Methods
Participants
Thirty-two volunteers (aged 18–34 years; mean age, 22.8 years; 14 males) were recruited via a University College London website. All completed a diffusion tensor imaging (DTI) scan and a behavioral task. Fourteen participants completed the behavioral task outside the scanner and 18 inside the scanner during a functional magnetic resonance imaging (fMRI) scan. Here, we report the behavioral data and DTI data only. Participants gave informed consent and were compensated for their time. The study was approved by the University College London Research Ethics Committee. Because we were interested in examining healthy individuals, three subjects with a Beck Depression Inventory (BDI) score above 12 were excluded a priori from the analysis as done previously (Moutsiana et al., 2013; Chowdhury et al., 2014).
Stimuli
Forty-six short descriptions of negative life events (e.g., passenger in a car accident, home burglary; Table 1) were presented in random order (adapted from Moutsiana et al., 2013). All events were shown to all participants. For each event, the average probability (base rate) of that event occurring at least once to a person living in the same sociocultural environment as the participant was determined from online resources (e.g., Office for National Statistics, Eurostat, PubMed). Our participants were all living in a similar sociocultural environment, so probabilities were the same for all. Very rare or very common events were not included; all event probabilities were between 10 and 70%. To ensure that the range of possible overestimation was equal to the range of possible underestimation, participants were told that the range of probabilities were between 3 and 77%.
Table 1.
Stimuli
| Stimuli |
|---|
| Abdominal (stomach) surgery |
| Abnormal heart rhythm |
| Anemia |
| Anxiety |
| Appendicitis |
| Asthma |
| Being convicted of crime |
| Betrayed by friend |
| Bicycle theft |
| Bone fracture (break) |
| Computer crash with loss of important data |
| Deceived when playing online games |
| Develop an addiction |
| Diabetes type I |
| Food poisoning |
| Getting a fine |
| Having fleas/lice |
| Holiday cancelled because of natural disaster |
| Home burglary |
| Hospital stay longer than three weeks |
| Household accident |
| Insect infestation (e.g. ants) in your home |
| Knee surgery |
| Liver disease |
| Lose wallet |
| Lose your house keys |
| Lung disease |
| Migraine |
| Mouse/rat in house |
| Obesity |
| Passenger in a car accident |
| Severe cut by sharp knife |
| Severe injury because of accident (traffic or house) |
| Severe teeth problems when old |
| Skin burn |
| Sport-related accident |
| Stopped and searched by the police |
| Stung by a wasp |
| Theft from person |
| Trapped in a lift |
| Trapped in the tube |
| Victim of mugging |
| Victim of violence by stranger |
| Victim of violence with need to go to the emergency room |
| Wisdom tooth surgery |
| Witness a traumatizing accident |
Procedure
We used the frequently used “belief update” procedure (Sharot et al., 2011, 2012; Moutsiana et al., 2013; Chowdhury et al., 2014; Garrett and Sharot, 2014; Garrett et al., 2014; Korn et al., 2014; Kuzmanovic et al., 2015). On each trial, one of 46 adverse life events was presented in random order for 4 s, and participants were asked to estimate how likely the event was to happen to them in the future. Participants had up to 8 s to respond. They were then presented with the base rate of the event in a demographically similar population for 2 s (see Fig. 1, procedure). Between each trial, a fixation cross appeared for a jittered duration (1–4 s).
Figure 1.
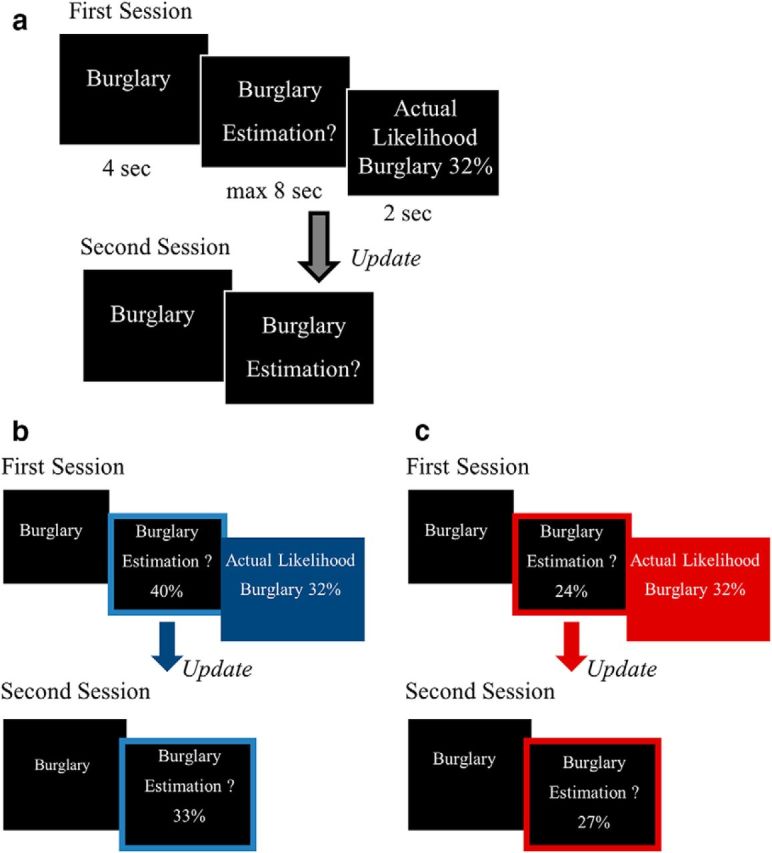
Procedure. a, On each trial, participants were presented with a short description of one of 46 adverse events and asked to estimate how likely this event was to occur to them in the future. They were then presented with the base rate of the event occurring in a demographically similar population. The second session was the same as the first, except that the base rate of the event to occur was not presented. Examples of trials for which the participant's estimate was higher (b) or lower (c) than the base rate. Here, for illustration purposes only, the blue and red frames denote the participant's response (either a relative overestimation or underestimation, respectively), and the blue and red filled boxes denote information that calls for an adjustment in a favorable (b) or unfavorable (c) direction.
In a second session, immediately after the first, participants were asked again to provide estimates of their likelihood of encountering the same events, so that we could assess how they updated their estimates in response to the information presented. Participants then rated all stimuli on previous experience (“Has this event happened to you before?”; from 1 for never to 6 for very often), familiarity (“Regardless if this event has happened to you before, how familiar do you feel it is to you from TV, friends, movies, and so on?”; from 1 for not at all familiar to 6 for very familiar), and negativity (“How negative would this event be for you?”; from 1 for not negative at all to 6 for very negative).
Participants completing the task in the scanner responded using two MRI-compatible response boxes with five buttons in each hand. Each button corresponded to one digit.
Behavioral data analysis
Behavioral data analysis was equivalent to that done previously (Sharot et al., 2011, 2012; Moutsiana et al., 2013; Chowdhury et al., 2014; Garrett et al., 2014). For each trial and each subject, we estimated update as follows: favorable information update = first estimation − second estimation; unfavorable information update = second estimation − first estimation. Thus, positive updates indicate a change toward the base rate and negative updates a change away from the base rate. For each participant, we then averaged updates scores across trials for which favorable information was presented and separately for which unfavorable information was presented. We then calculated asymmetric information integration as the difference between the two, with positive values corresponding to greater update in response to favorable information and negative values to greater update in response to unfavorable information.
Note that a recent study has shown that classifying trials using different methods—either according to the subjects' own rating of desirability of the information or according to the subjects' estimates of the base rate rather than self-risk—yields similar results (Garrett and Sharot, 2014). Thus, we use the traditional design and analysis here (Sharot et al., 2011). Moreover, past studies have shown that the amount of update does not alter whether subjects are asked to estimate the likelihood of the event happening in the future or the likelihood of the event not happening in the future (Sharot et al., 2011; Garrett and Sharot, 2014). Thus, scores are not driven by response to high and low numbers but to valence per se. Because this has been established in the studies above, we used the straightforward version of the task here (i.e., eliciting estimation of an event happening).
Data acquisition: DTI
Scanning was performed at the Birkbeck–University College London Centre for NeuroImaging using a Siemens Avanto 1.5 T MRI scanner and a 32-channel head coil. Diffusion-weighted images were acquired using echoplanar imaging (TR, 7500 ms; TE, 104 ms). Each whole-brain volume comprised 46 contiguous axial slices (voxel size, 2.3 mm isotropic). Diffusion-sensitizing encoding gradients were applied to 64 directions (b = 1000 s/mm2), and one volume was acquired without diffusion weighting (b = 0 s/mm2). We also acquired a high-resolution MP-RAGE three-dimensional (3D) T1-weighted structural scan (176 slices; TR, 2730 ms; TE, 3.57 ms) of the whole brain.
DTI data analysis
Raw digital imaging and communications in medicine images were converted into Neuroimaging Informatics Technology Initiative data format, and all images were inspected manually for abnormalities and artifacts. DTI data were analyzed using FMRIB (for Functional MRI of the Brain) Software Library (FSL) tools (FSL version 5; http://fsl.fmrib.ox.ac.uk/fsl; Jenkinson and Smith, 2001; Behrens et al., 2003). We followed the standard preprocessing pipeline for diffusion-weighted images using FDT (FMRIB diffusion toolbox): images were corrected for eddy currents and possible head motion using affine registration (12 degrees of freedom) to a reference volume and skull-striped using BET (FMRIB brain extract tool; Smith, 2002). From each preprocessed image voxel, specific diffusion tensors were then calculated using BEDPOSTX (Bayesian estimation of diffusion parameters obtained using sampling techniques), which uses Markov Chain Monte Carlo sampling to model crossing fibers (Behrens et al., 2007).
Defining seed regions for DTI
Exact locations of seed regions were determined based on past studies (Sharot et al., 2011, 2012) demonstrating a role for the left and right IFG (Talairach coordinates x, y, z, ±48, 18, 16) and the right MFC (Talairach coordinates x, y, z, −10, 62, 28) in belief updating in this task. First, coordinates were converted from the Montreal Neurological Institute (MNI) space to Talairach space using GingerAle (http://www.brainmap.org/ale/), and then masks were a priori defined as a 5 mm sphere around the coordinates above using the MarsBaR (Brett et al., 2002) toolbox. For the probabilistic tractography analysis, each mask was then transformed into each individual's DTI space.
In this procedure, DTI scans were transformed to the FSL MNI space using rigid-body transformations [FLIRT (FMRIB Linear Image Restoration Tool); Jenkinson and Smith, 2001], and the inverse transformation matrix was applied to the seed image masks, thus transforming the group mask into each subject's DTI space. Only voxels in the mask overlapping each individual's nondiffusion brain image were included in the masks. Masks were then inspected manually and binarized. Participant specific masks were then used as seed voxels in separate fiber tracking analyses below.
Fiber tracking
Fiber tracking was performed probabilistically using probtrackx (Behrens et al., 2007), part of the FMRIB diffusion toolbox. From each voxel in the seed mask, 5000 tract-following samples were generated, and a curvature threshold of 0.2 was used. The output of this analysis is a visitation map, namely a brain volume, in which each voxel has a probability value that corresponds to the number of pathways starting from the seed region and passing through that particular voxel (Cohen et al., 2009; van den Brink et al., 2014). The number of pathways is used widely as one of the main indicators of tract strength (Johansen-Berg and Rushworth, 2009; van den Brink et al., 2014). Probabilistic tracking was performed separately for each seed in a whole-brain analysis, and hence we acquired 32 visitation maps per seed region, one for each participant.
Belief updating asymmetry and structural connectivity correlates
To test the hypothesis that information integration asymmetry is related to connectivity strength between seed regions and subcortical areas, we estimated separately each of the seeded tracts using subject specific probabilistic tractography (Behrens et al., 2007).
Voxelwise analyses were then performed (separate for each seed mask) across participants, correlating the visitation maps (“tract strength”) with information integration asymmetry scores (following a procedure previously used by Cohen, 2011; for an illustration of the analysis steps, see Fig. 2). To that end, visitation maps were first scaled to control for differences in the number of voxels in individuals seed masks by dividing the probability values of the voxels by the number of voxels in the DTI mask × 5000 (number of generated paths), normalized to MNI space with 3 mm isotropic resolution using each participants' inverse transformation matrix created in the previous step and spatially filtered with a 3D σ of 2.54, corresponding to a 6 mm full-width at half-maximum (FWHM). The aligned four-dimensional (group) visitation maps data of all subjects was fed into a voxelwise covariance analysis. To allow enough variance in the data for performing correlations, only voxels in which at least 80% of the participants had a nonzero fiber tract strength were included in the analysis (Fig. 2d). This resulted in testing 24% of brain voxels for a correlation between fiber track connectivity with seed regions and asymmetric information integration. To ensure that our results were not dependent on this constraint, we repeated the analysis including any voxels for which at least one participant had nonzero tract strength.
Figure 2.

Illustration of the main analysis steps. a, One of the three seed regions used in whole-brain probabilistic tractography analysis is portrayed in blue on an MNI template brain (seed was converted to individuals' DTI space). This seed includes voxels in the left IFG identified from our previous fMRI and TMS studies (Sharot et al., 2011, 2012). b, Visitation maps (tractography results) of two representative participants in subjects' (sbj) DTI space. Each visitation map was first normalized to MNI space. c, Tractography results for all subjects in MNI space. For visualization purposes, the mask is the sum of all the individual masks. Light blue represents voxels in which connectivity with the left IFG was observed in 100% of participants. Darker blue depicts voxels in which connectivity with the left IFG was observed in <100% of participants. d, Region in which connectivity with the left IFG was observed in at least 80% of the participants was used as a mask for cross-subject correlational analysis (all individual tractography results were normalized to MNI space and scaled for the size of the mask). For each voxel in the mask, a correlation analysis was performed between the fiber tract strength of that voxel with the left IFG and the asymmetric information integration score, while controlling for all noise regressors.
We conducted a voxelwise whole-brain regression across all subjects [familywise error (FWE) corrected], relating connectivity strength of each voxel with each seed, with the asymmetric information integration scores included as a regressor of interest. We controlled for memory errors (see below), mean first estimate (see below), gender, age, and BDI by including these as noise regressors in the model. Correlation maps were acquired using the FSL randomize tool (http://fsl.fmrib.ox.ac.uk/fsl/fslwiki/Randomize; Winkler et al., 2014) with threshold-free cluster-enhancement (TFCE; Smith and Nichols, 2009) thresholding. For each contrast of interest, there were 5000 permutations, generating a distribution of correlation coefficient at each voxel. TFCE-corrected statistical maps were thresholded at 0.95, corresponding to p < 0.05, and raw statistics were FWE corrected.
To determine whether correlations between asymmetric information integration and connectivity were driven by the relative updating in response to favorable information and unfavorable information and/or by independent contributions of each, we conducted an analysis analogous to teasing apart an interaction by looking at simple effects (a procedure that does not suffer from circular analysis; Kriegeskorte et al., 2009), while at the same time controlling for the variables of no interest. Specifically, for each subject, we extracted the connectivity values from the voxels showing significant effects above and averaged those in each anatomically defined region (anatomical masks were created using the FSL altas tool in the MNI stereotaxic space brain). We then conducted canonical correlation analyses in each region with our two-dimensional dependent variable (update in response to favorable information and update in response to unfavorable information), independent variable (tract strength), and all variables of no interest. The latter included estimation errors and memory errors for favorable and unfavorable information, base rate asymmetry (i.e., difference in statistics presented for favorable and unfavorable events), average size of the update, mean first estimate, age, gender, BDI score, mean fractional anisotropy (FA), and the gray matter (GM) volume in the specific region (for detail of all these variables, see below). Because tract strength values are non-normally distributed, they were transformed to log10 values, before running canonical correlation analyses.
Additional memory analysis control
Although all the analyses above were performed while controlling for memory scores, we also tested for effects of memory asymmetry per se rather than information integration asymmetry by repeating the procedure above using the memory errors asymmetry score as the main variable of interest instead of information integration asymmetry score.
Covariates of no interest
We describe the variables controlled for in the canonical analysis as follows (in addition to age and gender):
Mean first estimate.
For each participant, the average first response over all trials was calculated and used as a covariate in the model in the whole-brain analysis. We also included the average first response over all trials in the canonical correlation analysis model.
Mean overall update.
For each participant for each trial, absolute update (first estimate − second estimate) was computed, and then the average over all trials was calculated and entered in the canonical correlation analysis.
Estimation errors.
For each participant for each trial, an estimation error (estimation error = first estimation − probability presented) was computed. We included both favorable and unfavorable information estimation errors in the canonical correlation analysis model.
Memory.
To test memory for the information presented, subjects were asked at the end of the study to provide the previously presented base rate of each event. Memory errors were calculated for each subject and each trial as the absolute difference between the base rate and the participants' recollection of that statistic (memory error = base rate − recollection of base rate). Errors were than averaged separately for all trials in which subjects received favorable information and unfavorable information. The difference between the two was calculated (memory asymmetry) and added as a covariate in the whole-brain analysis in the model. We also entered memory errors for favorable information and memory errors for unfavorable information in the region of interest (ROI) analysis.
Base rates.
For each participant, we calculated the average base rate presented for favorable information and the average base rate presented for unfavorable information. The two were subtracted to create an asymmetry score that we used as a covariate.
BDI.
To ensure that the results were not explained by depression symptoms, we added BDI scores as a covariate in the analysis.
FA.
For each participant, an FA map was created during voxelwise fitting of the diffusion tensor (see previous section). FA maps were normalized to MNI space using nonlinear registration. We extracted mean FA values within the group masks using FSL atlas (http://fsl.fmrib.ox.ac.uk/fsl/fslwiki/Fslutils) commands. FA values for each ROI were included as covariates in the analysis for that ROI.
GM volume.
Using the New Segment option and the default settings in Statistical Parametric Mapping 8 (SPM8; http://www.fil.ion.ucl.ac.uk/spm), we first segmented each T1-weighted image into GM, WM, and CSF. Subsequently, we performed diffeomorphic anatomical registration through exponentiated lie algebra for intersubject registration of the GM, and WM images (Ashburner, 2007). The registered images were smoothed with a Gaussian kernel (FWHM of 8 mm) and transformed to MNI DTI stereotactic space using affine and nonlinear spatial normalization implemented in SPM8. To ensure that the local GM volume was retained before and after spatial transformation, the image intensity was modulated by the Jacobian determinants of the deformation fields. After these preprocessing steps, we obtained smoothed modulated normalized images; hence, the value of GM volume represents the tissue volume per unit of spatially normalized image in arbitrary units. GM values for each ROI were included as a covariates in the analysis for that ROI.
Results
Our analysis includes the following steps. First, we quantify asymmetric information integration for each individual. We then correlate those scores with the connectivity index values along the white matter pathway obtained using probabilistic tractography on DTI data. This produces a map of regions in which anatomical connectivity is related to asymmetric information integration across participants. Finally, we examine whether these correlations are driven by the net effect of the asymmetry, a reduction in information integration in response to unfavorable news, an increase in information integration in response to favorable news, or both.
Quantifying asymmetric information integration
Participants performed the belief update procedure that allows quantification of the magnitude of belief change in response to information that is better or worse than expected (Sharot et al., 2011, 2012; Moutsiana et al., 2013; Chowdhury et al., 2014; Garrett and Sharot, 2014; Garrett et al., 2014; Korn et al., 2014; Kuzmanovic et al., 2015). They were presented with 46 adverse life events and asked to estimate how likely the event was to happen to them in the future. They were then presented with the base rate of the event in a demographically similar population (Fig. 1, procedure). Trials were divided into those in which participants received favorable information (i.e., the probability presented of encountering an aversive event was lower than the subject's estimate of their own probability; Fig. 1b) or unfavorable information (i.e., the probability presented was higher than the subject's estimate of their own probability; Fig. 1c). Note that different methods of dividing trials in this task has shown to yield similar results (Garrett and Sharot, 2014).
In a second session, immediately after the first, participants were asked again to provide estimates of their likelihood of encountering the same events. For each subject and each trial, an update term was then calculated (favorable trials update = first estimation − second estimation; unfavorable trials update = second estimation − first estimation). Thus, positive updates indicate a change toward the base rate and negative updates a change away from it. Then, for each participant, we calculated separately the average update for favorable trials and unfavorable trials. The difference between the two was the asymmetric information integration score (favorable update − unfavorable update). Positive values correspond to greater update in response to favorable information and negative values to greater update in response to unfavorable information.
Replicating previous results (Sharot et al., 2011, 2012; Moutsiana et al., 2013; Garrett and Sharot, 2014), our sample demonstrated asymmetric information integration such that beliefs were updated to a greater extent in response to favorable (mean, 12.87) than unfavorable (mean, 5.44) information (t(31) = 4.16, p < 0.001). Important for the current investigation, the magnitude of this asymmetry varied across individuals (mean ± SD, 7.43 ± 10.11).
The extent of updating for favorable information did not correlate across subjects with the extent of updating for unfavorable information (r = −0.05, p = 0.78). Across individuals, there was no asymmetry in memory errors for favorable (mean, 12.6) and unfavorable (mean, 11.3) information (t = 1.92, p = 0.065). Moreover, the asymmetry for memory errors did not correlate across individuals with the asymmetry for updating (r = −0.14, p = 0.44). Participants' first estimate did correlate with asymmetric belief updating (r = −0.36, p = 0.04); we have controlled for memory and first estimates in all the statistical analyses by entering these scores as covariates of no interest in the model.
Asymmetric information integration is related to frontal–subcortical anatomical connectivity
Our analysis revealed left IFG connectivity to widespread ipsilateral cortical and subcortical areas, as well as some contralateral areas (Fig. 2, for example individual visitation maps, see b, and for a summary result of visitation maps across all 32 participants, see c). Across subjects, asymmetric information integration scores correlated with connectivity strength from the left IFG along three major tracts in the left hemisphere: the inferior fronto-occipital fasciculus, the anterior thalamic radiation, and the uncinate fasciculus (note that DTI does not provide directional information and thus “from” and “to” refer to statistical seed and target voxels). This cluster included voxels in the left anterior thalamus extending to the putamen, insula, and pallidum, as well as the amygdala and hippocampus (Fig. 3, Table 2; FWE corrected, p < 0.05). The results indicate that individuals with greater asymmetric information integration (i.e., greater belief updating after favorable information relative to unfavorable information) have stronger connections between the left IFG and a network of subcortical and cortical regions (Fig. 3, Table 2). Memory for the information provided, mean first estimates, gender, age, and BDI score were controlled for by entering these values as noise regressors in the model (see Materials and Methods). No negative correlations were found.
Figure 3.
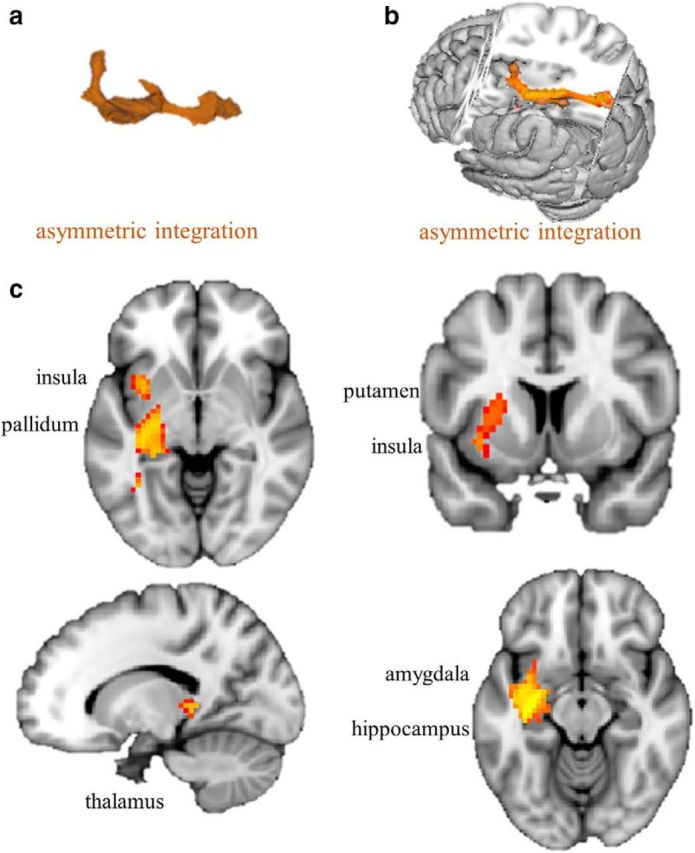
White matter connectivity correlates with asymmetric information integration. a, 3D cluster in orange of fiber tracts in which strength seeded from the left IFG correlates positively with asymmetric information integration across participants. b, Cluster shown in a 3D brain. c, Cluster shown on sagittal, coronal, and axial planes portraying significant effects in the left pallidum, left putamen, left insula, left amygdala, left hippocampus, and left thalamus (whole-brain FWE corrected, p < 0.05).
Table 2.
Brain regions in which strength of white matter connectivity to the left IFG correlated with asymmetric information integration
| Cluster properties (441 voxels) | Peak (T, p) FWE corrected | MNI coordinates x, y, z |
|---|---|---|
| Left amygdala | 3.82, 0.02 | −27, −6, −15 |
| Left hippocampus | 3.75, 0.02 | −33, −21, −12 |
| Left insula | 3.58, 0.03 | −39, −3, −12 |
| Left pallidum | 3.09, 0.05 | −24, −18, −6 |
| Left putamen | 3.51, 0.03 | −26, 6, 9 |
| Left thalamus | 3.42, 0.03 | −12, −27, 6 |
Similar results were also observed when including all voxels for which at least one participant had a nonzero value. Specifically, this analysis resulted in a comparable cluster (436 voxels, p < 0.05 FWE corrected) encompassing the left anterior thalamus extending to the putamen, insula, pallidum, amygdala, and hippocampus.
These findings were specific to the left IFG, and we did not observe significant results when seeding from the right IFG or from MFC. This suggests that the pattern of results is specific and does not reflect general connectivity patterns across the brain. Moreover, control analysis testing for associations between tract strength and memory errors did not yield any significant results, further supporting the notion that the structure-information integration correlates found here are not accounted for by memory effects per se. This is not surprising, because we have shown repeatedly that memory asymmetry and asymmetric information integration are unrelated (Sharot et al., 2011, 2012; Moutsiana et al., 2013; Garrett and Sharot, 2014).
Frontal–subcortical anatomical connectivity is associated with information integration in opposite direction for favorable and unfavorable information
Asymmetric information integration can be driven independently by (1) greater integration in response to favorable information, (2) reduced integration in response to unfavorable information, or (3) both. To examine whether fiber tract connectivity was related to the net effect of the asymmetry (i.e., individuals who show greater integration in response to favorable relative to unfavorable information) or whether each type of valence-dependent update was related independently to anatomical connectivity strength, we ran a follow-up analysis examining independent contributions. This would reveal whether the effect described above results from option 1, 2, or 3. Specifically, for each subject, we extracted and averaged the connectivity values from the voxels identified above in each anatomically defined region (Fig. 3c). Using canonical correlation analysis, we then looked at the relationship between connectivity strength in each region and update in response to favorable information and unfavorable information while also entering in the model all the covariates of no interest: the magnitude of estimation errors for favorable and unfavorable information trials, memory errors for favorable and unfavorable information trials, age, gender, BDI score, average size of the update over all trials, mean first estimation, base rate asymmetry between favorable and unfavorable events, mean FA, and GM volume of the specific region by including them all in the model. Note that the goal of this analysis is to explain and characterize what is driving our initial results (i.e., distinguish between options 1, 2, or 3). This is analogous to teasing apart an interaction by looking at simple effects, a procedure that does not suffer from circular analysis (Kriegeskorte et al., 2009) and is performed to enable interpretation of the primary result.
The results revealed that frontal–subcortical anatomical connectivity was associated with information integration in opposite direction for favorable and unfavorable information. Subjects with stronger connectivity between the left IFG and left amygdala (β = 0.395, p = 0.02), putamen (β = 0.320, p = 0.016), pallidum (β = 0.521, p = 0.04), hippocampus (β = 0.386, p = 0.018), and thalamus (β = 0.331, p = 0.033) were more likely to change their beliefs when receiving information that was better than expected (favorable information); this was true also for one cortical region, the insula (β = 0.278, p = 0.036; Fig. 4). At the same time, subjects with stronger connectivity between the left IFG and left pallidum (β = −0.559, p = 0.017), putamen (β = −0.469, p = 0.007), and insula (β = −0.381, p = 0.024) were less likely to change their beliefs when receiving information that was worse than expected (unfavorable information; Fig. 4). In other words, the strength of white matter connections between the left IFG and the above regions was associated with learning in response to favorable and unfavorable information in opposite directions, revealing a potential pathway supporting motivational-driven belief formation.
Figure 4.

Teasing apart correlation results. Canonical correlational analysis was run to test whether the relationship between white matter connectivity and asymmetric information integration was driven by the net effect of asymmetric information integration or by independent contribution of update in response to favorable news and/or unfavorable. This analysis is equivalent to teasing apart an interaction effect. The graph shows β values from the canonical correlational analysis representing the relationship between fiber strength and update in response to favorable and unfavorable information while controlling for all covariates (see Materials and Methods). *p < 0.05.
Discussion
Our results illuminate how structural brain connectivity is related to the generation of subjective beliefs in humans. We identify a neural system of interconnected brain regions for which the extent of white matter connectivity is associated with belief updating as a function of valence. In particular, our results reveal an opposing relationship between left frontal–subcortical white matter connectivity and updating in response to favorable and unfavorable information. For favorable information (e.g., learning you are less likely to be burglarized than you thought), stronger anatomical connectivity within this system, particularly between the left IFG and the left amygdala, hippocampus, putamen, pallidum, thalamus, and insular cortex, was associated with greater changes in belief across individuals. However, for unfavorable information, the opposite finding emerged; stronger connectivity between the left IFG and left putamen, pallidum, and insular cortex was related to reduced change in beliefs. Thus, left frontal–subcortical anatomical connectivity is associated with belief change differently based on the valence of the information presented.
This system includes regions that have been shown to mediate learning, memory, emotion, and value processing, including the amygdala (LeDoux, 1992, 2003), hippocampus (Cohen and Eichenbaum, 1993), basal ganglia (Cohen and Frank, 2009), insula (Damasio et al., 2000), and the left IFG, which has been suggested to encode the improbability of outcomes given the combination of priors and new evidence (d'Acremont et al., 2013). Increased white matter connectivity within this system may indicate greater potential for structures to share information related to valence, emotional state, event probabilities and other statistical factors incorporated into belief formation. Such a system could enable elements of emotion to be integrated in the process of belief updating and therefore decision-making.
These results could not be explained by how well subjects remembered the information presented to them nor the base rates of the events, their first estimates, the overall size of the update, depression scores, differences in GM volume, FA, age, or gender, because all these factors were carefully controlled for. Furthermore, given that the results are valence specific (i.e., indicating the difference in performance in response to favorable and unfavorable information), they cannot be explained by IQ and other non-valenced high-level characteristics.
The left IFG performs an important function in subjective belief updating (Sharot et al., 2011), such as encoding Bayesian posterior probabilities computed from previous knowledge and new evidence (d'Acremont et al., 2013). The current results show that a system connecting this structure to regions known to process emotion and value is associated with asymmetric belief updating. Indeed, interfering with activity in this system by administering TMS to the left IFG abolishes valence-dependent asymmetric updating (Sharot et al., 2012). Furthermore, damage to this frontal–subcortical circuit after stroke predisposes patients to depression (Vataja, 2004). This is of special interest, because depression has been associated with balanced information integration from desirable and undesirable information in this same task (Garrett et al., 2014; Korn et al., 2014).
Together with past findings (Sharot et al., 2011, 2012), the current results characterize a neural architecture that may allow valence to be incorporated into self-relevant belief updating. The results are in accord with the suggestion that partially separable processes govern learning from favorable and unfavorable information (Frank et al., 2007; Collins and Frank, 2014).
Footnotes
This work was supported by a Wellcome Trust Career Development Fellowship (T.S.), a University College London (UCL) Graduate School Bridging Fund (C.M.), a UCL impact award (N.G.), and a UCL Grand Challenge award (C.J.C.). We thank T. Behrens for discussion of results and S. Lazzaro and S. Bobadilla-Suarez for comments on a previous version of this manuscript.
The authors declare no competing financial interests.
This is an Open Access article distributed under the terms of the Creative Commons Attribution License Creative Commons Attribution 4.0 International, which permits unrestricted use, distribution and reproduction in any medium provided that the original work is properly attributed.
References
- Aron AR, Robbins TW, Poldrack RA. Inhibition and the right inferior frontal cortex. Trends Cogn Sci. 2004;8:170–177. doi: 10.1016/j.tics.2004.02.010. [DOI] [PubMed] [Google Scholar]
- Ashburner J. A fast diffeomorphic image registration algorithm. Neuroimage. 2007;38:95–113. doi: 10.1016/j.neuroimage.2007.07.007. [DOI] [PubMed] [Google Scholar]
- Bechara A, Damasio AR. The somatic marker hypothesis: a neural theory of economic decision. Games Econ Behav. 2005;52:336–372. doi: 10.1016/j.geb.2004.06.010. [DOI] [Google Scholar]
- Behrens TEJ, Woolrich MW, Jenkinson M, Johansen-Berg H, Nunes RG, Clare S, Matthews PM, Brady JM, Smith SM. Characterization and propagation of uncertainty in diffusion-weighted MR imaging. Magn Reson Med. 2003;50:1077–1088. doi: 10.1002/mrm.10609. [DOI] [PubMed] [Google Scholar]
- Behrens TEJ, Berg HJ, Jbabdi S, Rushworth MFS, Woolrich MW. Probabilistic diffusion tractography with multiple fibre orientations: what can we gain? Neuroimage. 2007;34:144–155. doi: 10.1016/j.neuroimage.2006.09.018. [DOI] [PMC free article] [PubMed] [Google Scholar]
- Bossaerts P. What decision neuroscience teaches us about financial decision making. Annu Rev Financ Econ. 2009;1:383–404. doi: 10.1146/annurev.financial.102708.141514. [DOI] [Google Scholar]
- Brett M, Anton J, Valabregue R, Poline J. Region of interest analysis using an SPM toolbox. Neuroimage [Abstr] 2002;16:497. [Google Scholar]
- Catani M, Howard RJ, Pajevic S, Jones DK. Virtual in vivo interactive dissection of white matter fasciculi in the human brain. Neuroimage. 2002;17:77–94. doi: 10.1006/nimg.2002.1136. [DOI] [PubMed] [Google Scholar]
- Chowdhury R, Sharot T, Wolfe T, Düzel E, Dolan RJ. Optimistic update bias increases in older age. Psychol Med. 2014;44:2003–2012. doi: 10.1017/S0033291713002602. [DOI] [PMC free article] [PubMed] [Google Scholar]
- Christopoulos GI, Tobler PN, Bossaerts P, Dolan RJ, Schultz W. Neural correlates of value, risk, and risk aversion contributing to decision making under risk. J Neurosci. 2009;29:12574–12583. doi: 10.1523/JNEUROSCI.2614-09.2009. [DOI] [PMC free article] [PubMed] [Google Scholar]
- Cohen MX. Hippocampal-prefrontal connectivity predicts midfrontal oscillations and long-term memory performance. Curr Biol. 2011;21:1900–1905. doi: 10.1016/j.cub.2011.09.036. [DOI] [PubMed] [Google Scholar]
- Cohen MX, Frank MJ. Neurocomputational models of basal ganglia function in learning, memory and choice. Behav Brain Res. 2009;199:141–156. doi: 10.1016/j.bbr.2008.09.029. [DOI] [PMC free article] [PubMed] [Google Scholar]
- Cohen MX, Schoene-Bake JC, Elger CE, Weber B. Connectivity-based segregation of the human striatum predicts personality characteristics. Nat Neurosci. 2009;12:32–34. doi: 10.1038/nn.2228. [DOI] [PubMed] [Google Scholar]
- Cohen NJ, Eichenbaum H. Memory, amnesia, and the hippocampal system. Cambridge, MA: Massachusetts Institute of Technology; 1993. [Google Scholar]
- Collins AG, Frank MJ. Opponent actor learning (OpAL): modeling interactive effects of striatal dopamine on reinforcement learning and choice incentive. Psychol Rev. 2014;121:337–366. doi: 10.1037/a0037015. [DOI] [PubMed] [Google Scholar]
- Conturo TE, Lori NF, Cull TS, Akbudak E, Snyder AZ, Shimony JS, McKinstry RC, Burton H, Raichle ME. Tracking neuronal fiber pathways in the living human brain. Proc Natl Acad Sci U S A. 1999;96:10422–10427. doi: 10.1073/pnas.96.18.10422. [DOI] [PMC free article] [PubMed] [Google Scholar]
- Cools R, Clark L, Owen AM, Robbins TW. Defining the neural mechanisms of probabilistic reversal learning using event-related functional magnetic resonance imaging. J Neurosci. 2002;22:4563–4567. doi: 10.1523/JNEUROSCI.22-11-04563.2002. [DOI] [PMC free article] [PubMed] [Google Scholar]
- d'Acremont M, Lu ZL, Li X, Van der Linden M, Bechara A. Neural correlates of risk prediction error during reinforcement learning in humans. Neuroimage. 2009;47:1929–1939. doi: 10.1016/j.neuroimage.2009.04.096. [DOI] [PubMed] [Google Scholar]
- d'Acremont M, Schultz W, Bossaerts P. The human brain encodes event frequencies while forming subjective beliefs. J Neurosci. 2013;33:10887–10897. doi: 10.1523/JNEUROSCI.5829-12.2013. [DOI] [PMC free article] [PubMed] [Google Scholar]
- Damasio AR, Grabowski TJ, Bechara A, Damasio H, Ponto LL, Parvizi J, Hichwa RD. Subcortical and cortical brain activity during the feeling of self-generated emotions. Nat Neurosci. 2000;3:1049–1056. doi: 10.1038/79871. [DOI] [PubMed] [Google Scholar]
- Eil D, Rao JM. The good news-bad news effect: asymmetric processing of objective information about yourself. Am Econ J Microeconomics. 2011;3:114–138. doi: 10.1257/mic.3.2.114. [DOI] [Google Scholar]
- Fleming SM, Weil RS, Nagy Z, Dolan RJ, Rees G. Relating introspective accuracy to individual differences in brain structure. Science. 2010;329:1541–1543. doi: 10.1126/science.1191883. [DOI] [PMC free article] [PubMed] [Google Scholar]
- Frank MJ, Samanta J, Moustafa AA, Sherman SJ. Hold your horses: impulsivity, deep brain stimulation, and medication in parkinsonism. Science. 2007;318:1309–1312. doi: 10.1126/science.1146157. [DOI] [PubMed] [Google Scholar]
- Garrett N, Sharot T. How robust is the optimistic update bias for estimating self-risk and population base rates? PLoS One. 2014;9:e98848. doi: 10.1371/journal.pone.0098848. [DOI] [PMC free article] [PubMed] [Google Scholar]
- Garrett N, Sharot T, Faulkner P, Korn CW, Roiser JP, Dolan RJ. Losing the rose tinted glasses: neural substrates of unbiased belief updating in depression. Front Hum Neurosci. 2014;8:639. doi: 10.3389/fnhum.2014.00639. [DOI] [PMC free article] [PubMed] [Google Scholar]
- Gläscher J, Daw N, Dayan P, O'Doherty JP. States versus rewards: dissociable neural prediction error signals underlying model-based and model-free reinforcement learning. Neuron. 2010;66:585–595. doi: 10.1016/j.neuron.2010.04.016. [DOI] [PMC free article] [PubMed] [Google Scholar]
- Huber RE, Klucharev V, Rieskamp J. Neural correlates of informational cascades: brain mechanisms of social influence on belief updating. Soc Cogn Affect Neurosci. 2015;10:589–597. doi: 10.1093/scan/nsu090. [DOI] [PMC free article] [PubMed] [Google Scholar]
- Jenkinson M, Smith S. A global optimisation method for robust affine registration of brain images. Med Image Anal. 2001;5:143–156. doi: 10.1016/S1361-8415(01)00036-6. [DOI] [PubMed] [Google Scholar]
- Johansen-Berg H, Rushworth MF. Using diffusion imaging to study human connectional anatomy. Annu Rev Neurosci. 2009;32:75–94. doi: 10.1146/annurev.neuro.051508.135735. [DOI] [PubMed] [Google Scholar]
- Kanai R, Rees G. The structural basis of inter-individual differences in human behaviour and cognition. Nat Rev Neurosci. 2011;12:231–242. doi: 10.1038/nrn3000. [DOI] [PubMed] [Google Scholar]
- Kanwisher N. Functional specificity in the human brain: a window into the functional architecture of the mind. Proc Natl Acad Sci U S A. 2010;107:11163–11170. doi: 10.1073/pnas.1005062107. [DOI] [PMC free article] [PubMed] [Google Scholar]
- Korn CW, Sharot T, Walter H, Heekeren HR, Dolan RJ. Depression is related to an absence of optimistically biased belief updating about future life events. Psychol Med. 2014;44:579–592. doi: 10.1017/S0033291713001074. [DOI] [PMC free article] [PubMed] [Google Scholar]
- Kriegeskorte N, Simmons WK, Bellgowan PS, Baker CI. Circular analysis in systems neuroscience: the dangers of double dipping. Nat Neurosci. 2009;12:535–540. doi: 10.1038/nn.2303. [DOI] [PMC free article] [PubMed] [Google Scholar]
- Kuzmanovic B, Jefferson A, Vogeley K. Self-specific optimism bias in belief updating is associated with high trait optimism. J Behav Decis Mak. 2015;28:281–293. doi: 10.1002/bdm.1849. [DOI] [Google Scholar]
- LeDoux J. The emotional brain, fear, and the amygdala. Cell Mol Neurobiol. 2003;23:727–738. doi: 10.1023/A:1025048802629. [DOI] [PMC free article] [PubMed] [Google Scholar]
- LeDoux JE. Brain mechanisms of emotion and emotional learning. Curr Opin Neurobiol. 1992;2:191–197. doi: 10.1016/0959-4388(92)90011-9. [DOI] [PubMed] [Google Scholar]
- Lee D, Seo H, Jung MW. Neural basis of reinforcement learning and decision making. Annu Rev Neurosci. 2012;35:287–308. doi: 10.1146/annurev-neuro-062111-150512. [DOI] [PMC free article] [PubMed] [Google Scholar]
- Li J, Delgado MR, Phelps EA. How instructed knowledge modulates the neural systems of reward learning. Proc Natl Acad Sci U S A. 2011a;108:55–60. doi: 10.1073/pnas.1014938108. [DOI] [PMC free article] [PubMed] [Google Scholar]
- Li J, Schiller D, Schoenbaum G, Phelps EA, Daw ND. Differential roles of human striatum and amygdala in associative learning. Nat Neurosci. 2011b;14:1250–1252. doi: 10.1038/nn.2904. [DOI] [PMC free article] [PubMed] [Google Scholar]
- Loewenstein G, Lerner J. The role of affect in decision making. Oxford, UK: Oxford UP; 2003. [Google Scholar]
- Loewenstein GF, Weber EU, Hsee CK, Welch N. Risk as feelings. Psychol Bull. 2001;127:267–286. doi: 10.1037/0033-2909.127.2.267. [DOI] [PubMed] [Google Scholar]
- Mayberg HS. Limbic-cortical dysregulation: a proposed model of depression. J Neuropsychiatry Clin Neurosci. 1997;9:471–481. doi: 10.1176/jnp.9.3.471. [DOI] [PubMed] [Google Scholar]
- Mega MS, Cummings JL. Frontal-subcortical circuits and neuropsychiatric disorders. J Neuropsychiatry Clin Neurosci. 1994;6:358–370. doi: 10.1176/jnp.6.4.358. [DOI] [PubMed] [Google Scholar]
- Mitchell DG, Luo Q, Avny SB, Kasprzycki T, Gupta K, Chen G, Finger EC, Blair RJ. Adapting to dynamic stimulus-response values: differential contributions of inferior frontal, dorsomedial, and dorsolateral regions of prefrontal cortex to decision making. J Neurosci. 2009;29:10827–10834. doi: 10.1523/JNEUROSCI.0963-09.2009. [DOI] [PMC free article] [PubMed] [Google Scholar]
- Moutsiana C, Garrett N, Clarke RC, Lotto RB, Blakemore SJ, Sharot T. Human development of the ability to learn from bad news. Proc Natl Acad Sci U S A. 2013;110:16396–16401. doi: 10.1073/pnas.1305631110. [DOI] [PMC free article] [PubMed] [Google Scholar]
- Payzan-LeNestour E, Dunne S, Bossaerts P, O'Doherty JP. The neural representation of unexpected uncertainty during value-based decision making. Neuron. 2013;79:191–201. doi: 10.1016/j.neuron.2013.04.037. [DOI] [PMC free article] [PubMed] [Google Scholar]
- Samanez-Larkin GR, Levens SM, Perry LM, Dougherty RF, Knutson B. Frontostriatal white matter integrity mediates adult age differences in probabilistic reward learning. J Neurosci. 2012;32:5333–5337. doi: 10.1523/JNEUROSCI.5756-11.2012. [DOI] [PMC free article] [PubMed] [Google Scholar]
- Sharot T, Korn CW, Dolan RJ. How unrealistic optimism is maintained in the face of reality. Nat Neurosci. 2011;14:1475–1479. doi: 10.1038/nn.2949. [DOI] [PMC free article] [PubMed] [Google Scholar]
- Sharot T, Kanai R, Marston D, Korn CW, Rees G, Dolan RJ. Selectively altering belief formation in the human brain. Proc Natl Acad Sci U S A. 2012;109:17058–17062. doi: 10.1073/pnas.1205828109. [DOI] [PMC free article] [PubMed] [Google Scholar]
- Smith SM. Fast robust automated brain extraction. Hum Brain Mapp. 2002;17:143–155. doi: 10.1002/hbm.10062. [DOI] [PMC free article] [PubMed] [Google Scholar]
- Smith SM, Nichols TE. Threshold-free cluster enhancement: addressing problems of smoothing, threshold dependence and localisation in cluster inference. Neuroimage. 2009;44:83–98. doi: 10.1016/j.neuroimage.2008.03.061. [DOI] [PubMed] [Google Scholar]
- Tekin S, Cummings JL. Frontal-subcortical neuronal circuits and clinical neuropsychiatry: an update. J Psychosom Res. 2002;53:647–654. doi: 10.1016/S0022-3999(02)00428-2. [DOI] [PubMed] [Google Scholar]
- van den Brink RL, Cohen MX, van der Burg E, Talsma D, Vissers ME, Slagter HA. Subcortical, modality-specific pathways contribute to multisensory processing in humans. Cereb Cortex. 2014;24:2169–2177. doi: 10.1093/cercor/bht069. [DOI] [PubMed] [Google Scholar]
- Vataja R. Poststroke depression and lesion location revisited. J Neuropsychiatr. 2004;16:156–162. doi: 10.1176/jnp.16.2.156. [DOI] [PubMed] [Google Scholar]
- Winkler AM, Ridgway GR, Webster MA, Smith SM, Nichols TE. Permutation inference for the general linear model. Neuroimage. 2014;92:381–397. doi: 10.1016/j.neuroimage.2014.01.060. [DOI] [PMC free article] [PubMed] [Google Scholar]