Abstract
Our laboratory has previously demonstrated that application of an antimicrobial spray product containing titanium dioxide (TiO2) generates an aerosol of titanium dioxide in the breathing zone of the applicator. The present report describes the design of an automated spray system and the characterization of the aerosol delivered to a whole body inhalation chamber. This system produced stable airborne levels of TiO2 particles with a median count size diameter of 110 nm. Rats were exposed to 314 mg/m3 min (low dose), 826 mg/m3 min (medium dose), and 3638 mg/m3 min (high dose) of TiO2 under the following conditions: 2.62 mg/m3 for 2 h, 1.72 mg/m3 4 h/day for 2 days, and 3.79 mg/m3 4 h/day for 4 days, respectively. Pulmonary (breathing rate, specific airway resistance, inflammation, and lung damage) and cardiovascular (the responsiveness of the tail artery to constrictor or dilatory agents) endpoints were monitored 24 h post-exposure. No significant pulmonary or cardiovascular changes were noted at low and middle dose levels. However, the high dose caused significant increases in breathing rate, pulmonary inflammation, and lung cell injury. Results suggest that occasional consumer use of this antimicrobial spray product should not be a hazard. However, extended exposure of workers routinely applying this product to surfaces should be avoided. During application, care should be taken to minimize exposure by working under well ventilated conditions and by employing respiratory protection as needed. It would be prudent to avoid exposure to children or those with pre-existing respiratory disease.
Keywords: Nano TiO2, antimicrobial spray, inhalation studies, pulmonary responses, cardiovascular responses
Introduction
Nanotechnology is the understanding, control and manipulation of matter at dimensions between 1 and 100 nm where unique phenomena enable novel applications. These novel applications include incorporation of nanoscale materials into a wide variety of products, devices and systems with new or improved performance. In light of the endless number of potential applications, nanotechnology is expected to grow into a trillion dollar industry employing millions of workers world-wide within the next decade (Rocco, 2004). Among these applications is the incorporation of either nanoanatase titanium dioxide or nano silver into spray formulations giving them antimicrobial properties. It is anticipated that such antimicrobial products would be used widely by consumers to disinfect kitchen and bathroom and by workers in hospitals, hotels, or exercise facilities.
Recently, the number of disinfectant products containing nanoparticles have increased substantially. However, little information is available concerning potential adverse effects of inhalation of nanoparticles during the application of these antimicrobial spray products onto surfaces. The Consumer Product Safety Commission has identified three critical questions which must be addressed in order to assure the safe use of such products.
Are nanoparticles present in these spray products?
If so, what concentration of nanoparticles are aerosolized during application of these products onto surfaces?
Would such levels of aerosolized nanoparticles have any adverse effects after inhalation?
Recently, we simulated the use of a commercially available antimicrobial product. Results indicate that the TiO2 particulate levels in the breathing zone of a person applying the spray to a vertical surface could reach 3.4 mg/m3, with most of these TiO2 particles being less than 110 nm in diameter (Chen et al., 2010). Therefore the goals of the present study were to: (1) design a generation/inhalation exposure system to expose rats to this antimicrobial spray product under controlled conditions that produce a TiO2 particle concentration and size which mimic those measured during simulated use; and (2) determine the pulmonary and cardiovascular responses to exposure and the dose-dependence of these responses.
Materials and methods
Test agent
The product tested in this study was purchased on the internet. It is a commercially available spray can product marketed as containing “nano” TiO2 particles and intended to be used as a surface antimicrobial agent, such as a bathroom sanitizer. The exact composition of the spray is considered proprietary information and was not available from the manufacturer. A previous study from our laboratory indicated that under conditions which simulated consumer use, breathing zone particulate levels reached 3.4 mg/m3 with 75 nm mean diameter TiO2 nanoparticles reaching 1.2 × 10⁵ particles/cm3 (Chen et al., 2010).
Computer-controlled spray can aerosol exposure system
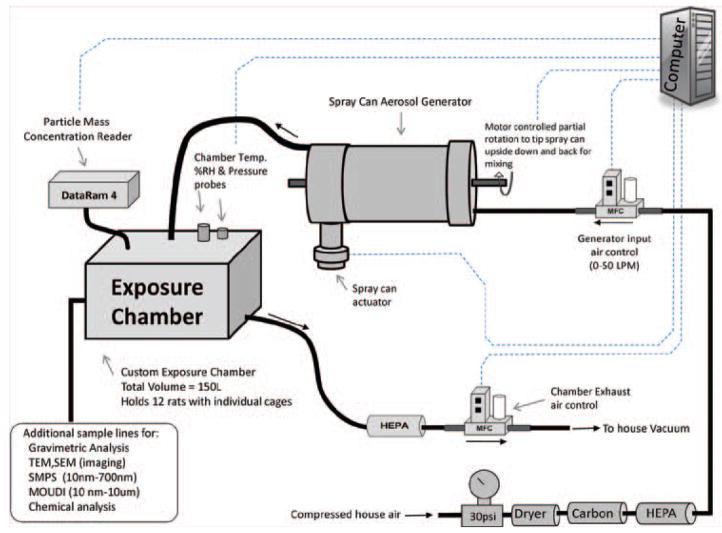
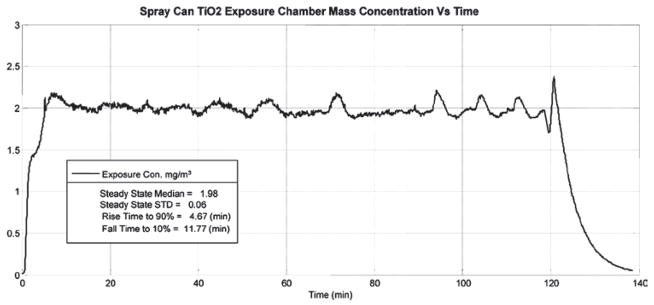
An inhalation exposure system for rats was designed and assembled to generate aerosols that are representative of those formed while using the antimicrobial pressurized product. The system requirements were to: (1) deliver the same size and concentrations of particles to the animal’s breathing zone as those previously measured near a person’s breathing space (Chen et al., 2010) during “typical use” of the spray can product, (2) automatically keep the contents of the spray can thoroughly mixed during an exposure period of 2–4 h, (3) automatically maintain constant exposure levels within the exposure chamber while minimizing fluctuations, (4) automatically control chamber pressure, air flows, and total exposure time, and (5) monitor and record temperature and humidity within the exposure chamber. A block diagram of the complete spray can aerosol generation/inhalation exposure system is shown in Figure 1. Air from a water-sealed compressor was conditioned by passing it through a dryer, a charcoal filter, and then a high-efficiency particulate arresting (HEPA) filter. A mass flow controller (Aalborg, model # GPC373S) supplied this clean air at a flow rate of 20 L/min to the generator. (The spray can aerosol generator itself is discussed in full detail in the following section.) The output air from the aerosol generator was introduced into a custom made 150 L stainless steel exposure chamber that accommodated an animal cage rack capable of housing 12 rats. An instrument based on light scattering properties of aerosols (Thermo Electron DataRAM 4) was used to monitor the mass concentration of particles inside the exposure chamber. Samples from the DataRAM were read continuously by the computer and used to adjust the on/off time of the spray can activation. In addition, dry aerosol concentrations were determined gravimetrically with 37 mm cassettes and Teflon filters (SKC, Eighty Four, PA, USA) to calibrate and verify the DataRAM readings after each exposure run. During a typical exposure period, the aerosol was sprayed once every 4–25 s for 0.025–0.15 s. A previously described (McKinney et al., 2009) feedback control algorithm was adapted to control the on/off time and achieved stable and consistent exposure concentrations. The performance of the automated computer control software can be seen in Figure 2. This figure displays a 2 h exposure run with a target exposure concentration of 2.0 mg/m3 and an achieved median concentration of 1.98 mg/m3. After the particulate aerosol exited the exposure chamber, it was passed through a HEPA filter, and the air was exhausted through a second mass flow controller to a vacuum system. The pressure inside the exposure chamber was measured continuously with a pressure transducer (Setra, model # 264). The exposure system’s control software was designed to automatically make adjustments to the exhaust flow controller to keep the exposure chamber at a negative pressure of −0.02 inches of H2O with respect to ambient. This slight negative pressure was maintained to minimize air leaks, thus, preventing the aerosol from escaping the exposure chamber into the ambient environment.
Figure 1.
Diagram of the computer-controlled spray can aerosol generation/exposure system.
Figure 2.
Time dependence of the mass concentration of TiO2 particles produced by the automated spray can generation system within the animal exposure chamber.
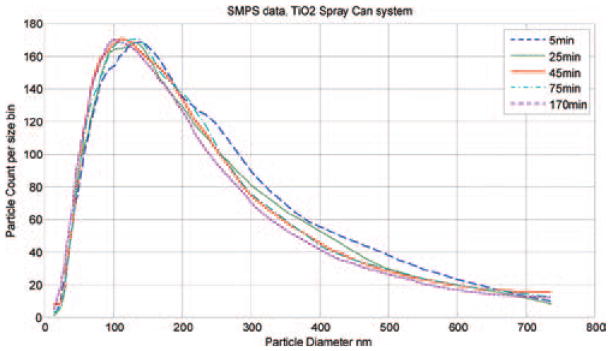
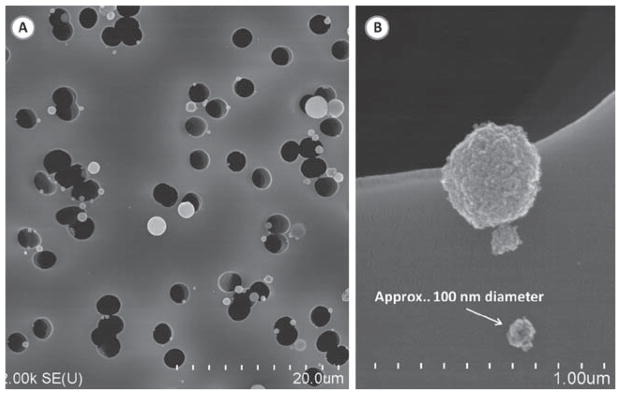
The temperature and humidity of the air inside the exposure chamber was continuously measured with a temperature/humidity sensor (Vaisala, model # 234). Clean water was placed in the bottom of the exposure chamber before each exposure period, which resulted in a stable relative humidity of about 50% over a 2–4 h period. Particle distribution and morphology of the TiO2 aerosol inside the exposure chamber were determined with a Scanning Mobility Particle Sizer (TSI, SMPS model 3034), and a scanning electron microscope (SEM; JEOL 6400, JEOL, Inc.). The particle size distribution is represented in Figure 3. SMPS readings were taken at several different time points as the exposure system operated over a 3 h test run. The median count size diameter was about 110 nm at all time points. These data indicated that the output from the spray can remained consistent and well mixed as the exposure system emptied each spray can. This size distribution was similar to that measured during personal use of this type of spray product (Chen et al., 2010). Polycarbonate filter (Whatman, Clinton, PA, USA) samples of the exposure chamber aerosol were taken. The loaded filters were sectioned and mounted with silver paste onto aluminum stubs for analysis under a scanning electron microscope (JOEL, Inc.). A typical SEM micrograph shows the well-dispersed, nano, and fine size morphology of dry particles within the exposure chamber (Figure 4).
Figure 3.
Size distribution of TiO2 particles within the exposure chamber at 5, 25, 45, 75, and 170 min of operation of the spray can generation system. Measurements were taken with a scanning mobility particle sizer (SMPS). The median particle size was approximately 110 nm for all measurements.
Figure 4.
Scanning electron micrograph of TiO2 particles collected within the exposure chamber using a polycarbonate filter. (A) Large field of view showing TiO2 particles of varying sizes. (B) Image of nanosized TiO2 particles. The majority of particles were between 80 and 130 nm in physical diameter.
The automated spray can aerosol generator
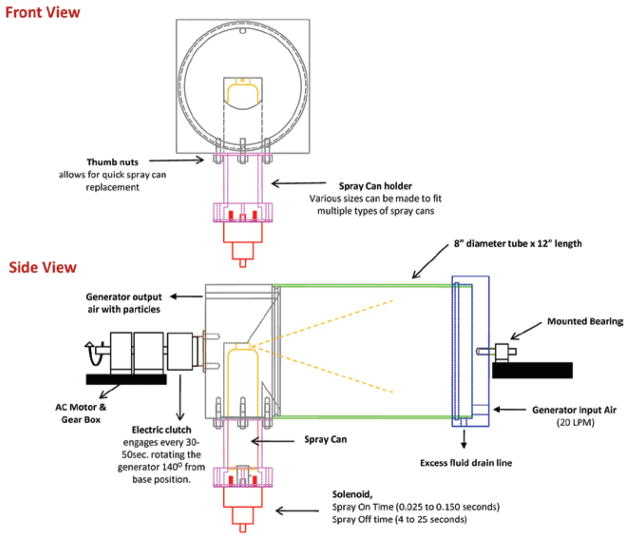
Figure 5 illustrates the components of the spray can aerosol generator. The generator’s main chamber consisted of an 8 inch diameter by 12 inch long clear polycarbonate tube. Filtered and dried air was introduced into the chamber (20 L/min) through a custom built end cap machined from 6061 aluminum. The cap was used to seal one side of the main chamber body. A solid rod was mounted to the center of the external surface of the cap and was supported by a bearing so that the generator could be easily rotated. A drain line was provided in the lower region of the cap to allow excess fluid to drain from the main body of the generator during long exposure runs. The opposite end of the generator’s main chamber was sealed with a second custom built end cap machined from 6061 aluminum. This end cap housed the spray can and contained a removable spray can holder. The spray can holder was attached with four thumb nuts to allow for quick and easy replacement of an emptied spray can. The spray can was free to move up and down with movement controlled by a linear solenoid (Ledex model 6EP Part number 192907-023). The solenoid was used to activate the spray by pushing the body of the can upward until the spray can nozzle pressed against the solid surface of the end cap. Locating the solenoid to push on the bottom of the spray can had several advantages: (1) the solenoid remained out of the aerosol and was less likely to get contaminated, and (2) the solenoid was not in direct contact with potentially flammable sprays should it produce a spark. During a typical exposure period, the solenoid was activated by custom computer software, and the can was sprayed once every 4–25 s for 0.025–0.15 s. As depicted in Figure 5, the end cap holding the spray can was attached to an electromechanical clutch (Reell Precision Manufacturing model EC75LL). When the clutch received a signal from the computer it connected the spray chamber and end caps to a shaft driven by a 120 V AC motor and gear box (Rex Engineering AC gearmotor CL model). This rotated the spray can from its vertical position at a rate of 60°/s for approximately 2.8 s. At this time, the computer deactivated the clutch and allowed the spray can to fall back freely to its initial position. The partial rotations were used to remix the contents of the spray can every 30–50 s. When the spray can was activated, aerosol left the spray can nozzle and traveled about 14 inches before impacting the flat surface of the end cap on the opposite side of the generator chamber. Particles that remained in the air stream moved from that end cap back toward their point of origin at the opposite end of the chamber. These aerosolized particles exited the generator chamber through a one-fourth inch port located at the top of the end cap that housed the spray can and were delivered to the animal exposure chamber. The reversal in the aerosol flow pattern was used to mimic exposure conditions of the user when applying the spray can product to a surface (Chen et al., 2010).
Figure 5.
Diagram of the automated spray can generator.
Animals
Sprague-Dawley (Hla: (SD) CVF) male rats weighing 200–300 g (~10-week-old at arrival) were obtained from Hilltop Lab Animals (Scottdale, PA, USA). All animals were housed in an AAALAC-accredited, specific pathogen-free, environmentally controlled facility. The animals were acclimated in the animal holding facility for 1 week prior to inhalation exposure and were monitored to be free of endogenous viral pathogens, parasites, mycoplasms, Helicobacter and CAR Bacillus. Animals were housed in ventilated cages which were provided HEPA-filtered air, with Alpha-Dri virgin cellulose chips and hardwood Beta-chips used as bedding. The rats were maintained on irradiated Teklad 2918 diet and tap water, both of which were provided ad libitum. All animal protocols were approved by the NIOSH Animal Care and Use Committee.
Rat exposures
Rats were exposed by inhalation at three exposure levels (Table 1). Animals were placed in whole body inhalation chambers for their respective exposures. Total exposure was varied by changing chamber particulate concentration (1.72–3.79 mg/m3), daily exposure duration (2–4 h), and number of days exposed (1–4 days). Therefore, the three total exposure levels of 314 mg/m3 min (low dose), 826 mg/m3 min (medium dose), and 3638 mg/m3 min (high dose) were achieved as described in Table 1. Control animals were exposed to filtered air in companion full body exposure chambers for equal times.
Table 1.
Animal exposure conditions.
| Total Exposure Dose | |||
|---|---|---|---|
| Exposure conditions | (mg/m3 min) | Spray cans used | No. of rats exposed |
| 2.62 mg/m3, 2 h, 1 day | 314 (low dose) | ½ | 12 |
| 1.72 mg/m3, 4 h/day, for 2 days | 826 (medium dose) | 2 | 9 |
| 3.79 mg/m3, 4 h/day, for 4 days | 3638 (high dose) | 8 | 9 |
Bronchoalveolar lavage (BAL)
At 24 h post-exposure, rats (six–nine rats/group) were euthanized with an intraperitoneal (i.p.) injection of sodium pentobarbital (>100 mg/kg body weight) and exsanguinated by cutting the abdominal aorta. BAL was conducted as described previously (Porter et al., 2002). Briefly, a tracheal cannula was inserted. A 6-mL aliquot of cold Ca+2- and Mg+2-free phosphate–buffered saline (PBS) was used for the lavage wash. The cold PBS was flushed into and out of the lungs two times before the lavage fluid was collected. This lavage fluid was termed “first lavage”. After the first lavage wash was collected, the BAL continued with 8-mL aliquot of cold Ca+2- and Mg+2- free PBS until an additional 80 mL of BAL fluid (BALF) was collected. The BALF from all rats was then centrifuged at 600×g for 10 min using a Sorvall RC 3B Plus centrifuge (Sorvall Thermo Electron Corporation, Asheville, NC, USA). After centrifugation, the supernatant from the first lavage wash was decanted into a clean conical vial and was stored on ice to be used for cytotoxicity analysis. The remaining lavage wash supernatant was discarded and the cells were pooled, washed with cold Ca+2- and Mg+2-free PBS, and centrifuged again at 600×g for 10 min. After this, the supernatant was discarded, and the cells were resuspended in 1 mL of 4-(2-hydroxyethyl)-1-piperazineethanesulfonic acid (HEPES)-buffered medium (10 mM HEPES, 145 mM NaC1, 5 mM KC1, 1 mM CaC12 and 5.5 mM d-glucose; pH = 7.4). Using these lavage samples, cell counts [polymorphonuclear neutrophils (PMNs) and alveolar macrophages (AMs)] were conducted to assess inflammation. The number of AMs and PMNs was determined as described by Porter et al. (2007). Total BAL cell counts were obtained according to their unique cell diameters, using an electronic cell counter equipped with a cell sizer (Beckman Coulter Multisizer 3 Counter, Hialeah, FL, USA). Cytospin preparations of BAL cells were made using a cytocentrifuge (Shandon Elliot Cytocentrifuge, London, UK). The cytospin preparations were stained with modified-Wright-Giemsa stain, and cell differentials were determined by light microscopy. AM and PMN counts were calculated as the product of total counts and percent AMs or PMNs, respectively.
BALF lactate dehydrogenase activity and albumin concentration
The degree of lung cell injury due to inhalation of the TiO2 spray product was determined by measuring lactate dehydrogenase (LDH) activity in the BALF. LDH activity was measured using Roche COBAS MIRA Plus chemical analyzer (Roche Molecular Systems Inc., Branchburg, NJ, USA) as described previously by our laboratory (Porter et al., 2002, 2007). Albumin concentrations in BALF were assessed to evaluate damage to the alveolar air/blood barrier. Albumin concentrations were also measured using a Cobas MIRA Plus analyzer (Roche Molecular Systems, Inc., Branchburg, NJ, USA) as previously described by our laboratory (Porter et al., 2002, 2007).
Enhanced-dark field microscopy of exposed lung tissue
To visualize deposition of nano TiO2 in lung tissue of exposed rats, high signal-to-noise, dark field microscopy was employed as previously described by Mercer et al. (2011) as well as standard light microscopy. Briefly, rats were euthanized with an overdose of sodium pentobarbital (>100 mg/kg body weight, i.p.) exsanguinated by transection of the abdominal aorta, and lungs fixed by intratracheal perfusion with 5 mL of 10% neutral–buffered formalin. After 30 min, lungs were removed from the chest cavity, trimmed, and processed overnight. Left lung lobes were embedded for mid-lobe sagital sections in paraffin and microtomed, and tissue slices collected on ultrasonically cleaned, laser-cut slides (Schott North American Inc., Elmsford, NY, USA). Slides were stained with Sirius red-hematoxylin and coverslipped with Permount. Enhanced darkfield images were observed using an Olympus BX-41microscope (CytoViva, Auburn, AL, USA) and images taken with a 2048 × 2048 pixel digital camera (Dage-MTI Excel digital camera XLMCT, Michigan City, IN, USA). Since the refractive index of TiO2 particles is much greater than lung tissue or the mounting medium, the nanoparticles scatter light and appear white on a dark field.
Morphometric counting of lung sections was used to assess the distribution of lung burden from apex, middle and base regions of the left lobe. For this measurement each mid-sagittal section of the left lobe was divided into three equal height regions (apex to base) and the volume density of TiO2 nanoparticles determined for each region by point counting. Particle counts were made from five lungs of rats exposed at the highest inhalation concentration. Particles were counted in apex, middle and base regions using the enhanced dark field mode and 100× oil immersion objective. Twenty uniformly distributed throws of the eyepiece grid were made for each region (apex, hilar and base region) and counts of TiO2 nanoparticles per field determined. Results for each region were expressed as a percentage of total lung counts.
In vitro microvessel measurements
Tails were dissected from anesthetized rats (six rats/group) after exsanguination and placed in cold Dulbecco’s Modified Eagle’s Medium with glucose (Invitrogen/Gibco, Carlsbad, CA, USA). Ventral tail arteries from the C14–15 region of the tail were dissected shortly after euthanasia, mounted on glass pipettes in a microvessel chamber (Living Systems, Burlington, VT, USA), and perfused with biocarbonated–HEPES buffer warmed to 37°C. Arteries were pressurized to 60 mmHg and allowed to equilibrate for approximately 1 h. After an hour, the chamber buffer was changed and phenylephrine (PHEN, α-1 adrenoreceptor agonist)-mediated vasoconstriction and acetylcholine (Ach)-mediated redilation were assessed. PHEN was applied to the chamber in half-log increments (−8.5 to −6.0 M) and the internal diameter was recorded after vessels stabilized (approximately 5 min between application of doses). Because ventral tail arteries usually display little basal tone (Krajnak et al., 2011), endothelial-mediated redilation was assessed after constriction by adding Ach in half-log increments (−8.5 to −5.0) using the same procedures that were used to apply PHEN.
Lung function
Breathing rates and specific airway resistance were evaluated in rats at 1 h and 24 h post-exposure following inhalation exposure to TiO2 spray and air (n = 9 rats/group). Breathing rates were measured using whole-body plethysmography. Briefly, animals were placed in a closed chamber, and pressure changes due to respiration were measured with a low range differential pressure transducer (Setra, Model 239, ±0.25 inches H2O) and digitally recorded at a sampling rate of 1000 Hz. Recordings were measured using a National Instruments 16-bit DAQ card (National Instruments, Model NI-6063) in a personal computer running custom written software (National Instruments, LabVIEW 6i). Bias flow (2 L/min of 10% CO2 in air) was continuously supplied through the chamber via high impedance tubing. Note that the use of 10% CO2 in air has been used in the past (Schaper et al., 1985) as a pulmonary stress test. Using 10% CO2 increases the work of breathing and reduces or eliminates animal motion, grooming, and sniffing after a short period of time (2–3 min). Therefore, animals were acclimated for a 3-minute period, followed by measurement of breathing intervals for an additional 2–3 min on a breath-by-breath basis. The recorded breath interval data formed a statistical distribution with a clear peak at the median breath interval when plotted in histogram form. This median breath interval was taken as the measurement for that animal. The breathing rate was then found as the reciprocal of the measured interval.
Specific airway resistance was estimated using double chamber plethysmography. Animals were placed in a double chamber plethysmograph (Hugo Sachs Elektonik-Harvard Apparatus), and a bias flow of 1 L/min of 10% CO2 in air was supplied through the head chamber via high impedance tubing. Flow produced from both the head and body chambers were found by measuring the pressure drop across the manufacturer supplied screen with a differential pressure transducer (Setra, Model 239, ±0.25 inches H2O). Recordings were measured at 1000 Hz using a National Instruments 16-bit DAQ card (National Instruments, Model NI-6063) in a personal computer running custom written software (National Instruments, LabVIEW 6i). Specific airway resistance was estimated from the phase shift between the two flow signals (Pennock et al., 1979). The respiratory frequency is accounted for in the calculations (Pennock et al., 1979), therefore it is not important that the animals be fully acclimated for this measurement.
Statistics
Statistical differences between control groups and treatment groups for the inhalation experiments examining the toxicity of the commercial antimicrobial spray product were determined using an analysis of variance (ANOVA) with significance set a p ≤ 0.05. Dose-response microvessel data were analyzed using two-way (treatment × dose) ANOVA. Individual means were compared using the Student–Newman-Keuls Method multiple comparison procedure with an overall significance level of 0.05.
Results
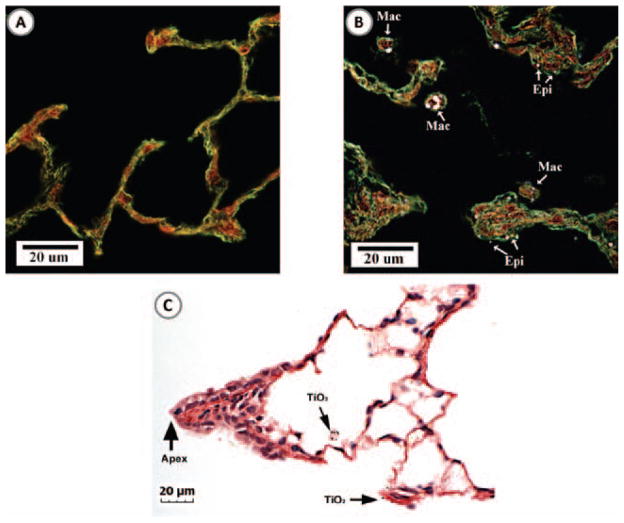
Enhanced darkfield imaging (Figure 6) of lung tissue demonstrated that inhalation exposure of rats to a commercial spray containing TiO2 nanoparticles resulted in particle deposition throughout the alveolar region of the lungs. At 1 day following the high dose exposure, particles were found within alveolar macrophages as well as associated with the alveolar epithelium (Figure 6B). No particles were observed in lung tissue from rats exposed to filtered air (Figure 6A). Though TiO2 nanoparticles were found throughout the alveolar region of the lung, there were relatively few particles found in the airways or ridges of airway bifurcations. For instance, Figure 6C shows the typical pattern of TiO2 nanoparticles in the region of the terminal bronchiole to alveolar duct transition. In this figure, TiO2 nanoparticles can be seen in alveolar macrophages and on the alveolar epithelium near the apex of the terminal bronchiole bifurcation but not on the apex or airway epithelium of the bifurcation ridge.
Figure 6.
Enhanced darkfield and light microscopy images of TiO2 nanoparticles in the lung at 24 h after the high dose inhalation exposure. (A) Image of the alveolar region of an air-exposed (control) rat lung. B) Image of the alveolar region of a rat lung exposed to the high dose of TiO2 spray product. The majority of the particles (appearing bright in the darkfield image) were within alveolar macrophages (Mac), while the remainder of the particles were found on the alveolar epithelium (Epi). (C) Image of TiO2 nanoparticles in the bronchiole to alveolar duct region of a rat lung exposed to TiO2. Arrows indicate TiO2 nanoparticles in an alveolar macrophage and on the nearby alveolar epithelium.
The average density of TiO2 nanoparticles in apex, middle and base regions (expressed as a percentage of the whole lobe) were 112.1 ± 22, 100.4 ± 15.4 and 87.5 ± 7.8 (mean ± SE, N = 5). The slight gradient of particle counts between apex and base is consistent with the general pattern of greater particle deposition in areas of greater ventilation (Sweeney et al., 1987).
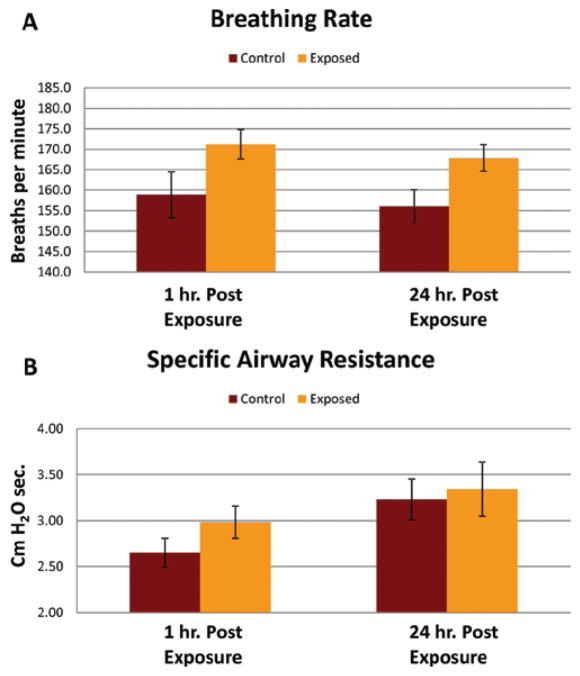
Pulmonary function, i.e. breathing rate and specific airway resistance, was not significantly altered at either 1 or 24 h post-exposure to the low (2.62 mg/m3, 2 h, for 1 day) or middle (1.72 mg/m3, 4 h/day, for 2 days) dose of spray. The median breathing rate measured after the low and medium dose exposures were between 150 and 160 breaths/min which fell in the same range as the control air-exposed animals. However, breathing rate was significantly increased at 1 and 24 h after exposure to the high dose of antimicrobial spray (3.79 mg/m3, 4 h/day, for 4 days) as shown in Figure 7A. The exposure-induced increases in breathing rates (breaths/min) were 171.2 ± 3.6 verses 158.8 ± 5.6 for controls (1.65-fold increase) at 1 h post-exposure, and 167.9 ± 3.3 verses 156 ± 4.0 for controls (1.73-fold increase) at 24 h post-exposure (mean ± SD, N = 9). Specific airway resistance was not significantly increased after any of the exposures levels even the high dose exposure (Figure 7B). The values for specific airway resistance while breathing 10% CO2 ranged from 2.2 to 3.8 for all the exposed groups and control groups.
Figure 7.
Effect of the high dose exposure to an antimicrobial spray product on pulmonary function. (A) Breathing rates, measured via single chamber plethysmograph with 10% CO2 bias air, of control (air) or TiO2 spray exposed rats 1 and 24 h post-exposure. (B) Specific airway resistance, measured via double chamber plethysmograph with 10% CO2 bias air, of control (air) or TiO2 spray exposed rats 1 and 24 h post-exposure.*indicates a significant increase from control (p < 0.05).
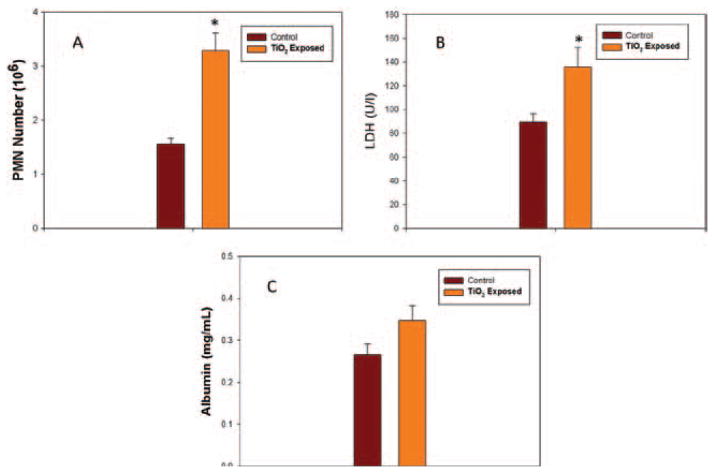
Pulmonary inflammation and damage was determined 24 h after inhalation of antimicrobial spray by measuring PMN counts and LDH activity or albumin levels in BALF samples (Figure 8). Exposure to the low or middle dose of antimicrobial spray resulted in non-significant increases in PMN counts (1.19- and 1.25-fold, respectively). Similarly, low and middle dose exposure to the antimicrobial spray did not increase LDH activity or albumin concentration in BALF at 24 h post-exposure. In contrast, the high dose exposure resulted in significant (2.09-fold) infiltration of PMNs into the alveolar airspaces at 24 h post-exposure (Figure 8A). LDH activity in BALF was also significantly increased (1.5-fold) 24 h after high dose exposure (Figure 8B), while BALF albumin levels were non-significantly increased (1.29-fold) as shown in Figure 8C. Cell differentials conducted by microscopic evaluation of cytospins indicated that BAL cells in control rats contained 88.3% AMs and 11.7% PMNs.
Figure 8.
Pulmonary response of the high dose inhalation exposure of the antimicrobial spray product. (A) Pulmonary inflammation measured as number of polymorphonuclear neutrophils (PMNs) harvested by bronchoalveolar lavage (BAL) 24 h after exposure of rats to air (control) or TiO2 spray. Exposed rats received an estimated lung burden of 43 μg of TiO2. (B) Lung cell damage measured as lactate dehydrogenase (LDH) activity in bronchoalveolar lavage fluid (BALF). (C) Alveolar air/blood barrier injury measured as albumin concentration in BALF. * indicates a significant increase from control (p < 0.05).
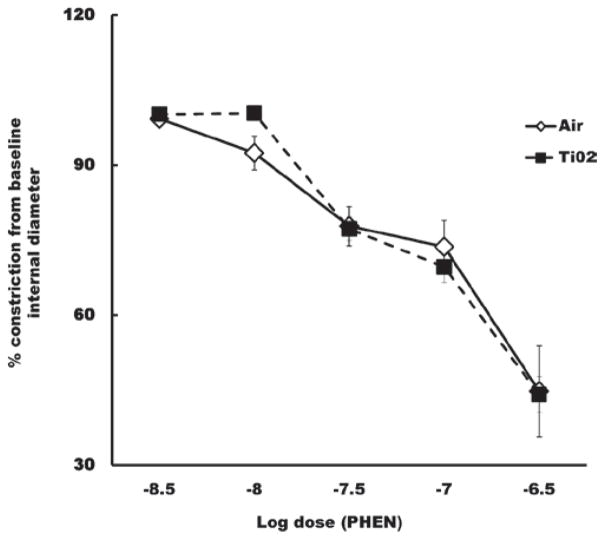
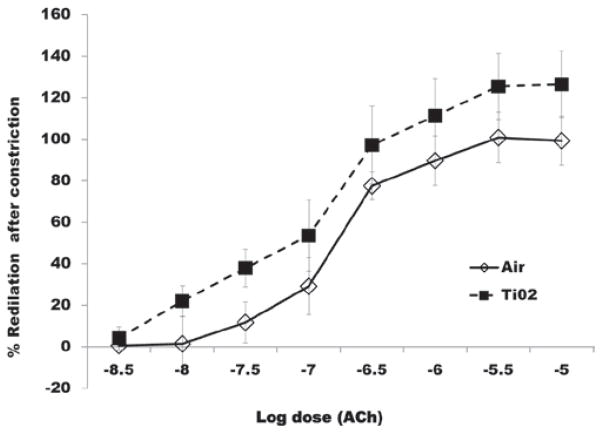
The responsiveness of the tail artery to phenylephrine- induced vasoconstriction or acetylcholine-induced redilation was not significantly affected 24 h after inhalation exposure to any of the exposure levels. These data for the high dose are shown in Figures 9 and 10, respectively.
Figure 9.
Percent change in the internal diameter of ventral tail arteries in response to phenylephrine (PHEN), 24 h after the high dose inhalation exposure. Dose-dependent vasoconstriction of arteries after inhalation of air was not significantly different from constriction after inhalation of TiO2.
Figure 10.
Percent redilation of ventral tail arteries in response to Ach, 24 h after completion of the high dose inhalation exposure. Dose-dependent redilation in response to Ach was not affected by TiO2 exposure.
Discussion
In a previous publication, our laboratory determined that human exposure to TiO2 nanoparticles was likely (3.4 mg/m3 TiO2 or 1.2 × 10⁵ nanoparticles/cm3) during application of a commercially available antimicrobial spray onto a vertical surface (Chen et al., 2010). In the present study, rats were exposed by whole body inhalation to an aerosol of this antimicrobial spray at an aerosol concentration and particle size distribution similar to that measured during the simulated human application. Rats were exposed to three different doses of spray particles, i.e. low, middle, and high as described in Table 1, which yielded exposures of 314, 826, or 3638 mg/m3 min, respectively. At the low and middle exposure levels, no significant effects on breathing rate, specific airway resistance, pulmonary inflammation, lung injury, or systemic vascular responsiveness were noted. At the high dose of 3638 mg/m3 min (3.79 mg/m3, 4 h/day, for 4 days), significant increases in breathing rate, lavageable PMNs (inflammation) and BALF activity of LDH (lung cell injury) were noted. However, specific airway resistance and systemic vascular responsiveness remained unaffected.
In the previous simulation of application of this commercial antimicrobial product onto a vertical surface, alveolar deposition of TiO2 particles was estimated per minute of application (Chen et al., 2010). In addition, concentration dependent deposition of this aerosol was also estimated for a rat inhalation model. Using these calculations, the three exposure doses used in the present study would result in TiO2 alveolar depositions of 3.74 (low dose), 9.83 (medium dose), and 43.31 μg (high dose) per rat. If one normalized lung burden per alveolar epithelial surface area using morphometric data from Stone et al. (1992), one can estimate the duration of exposure required for an individual applying this spray to achieve an alveolar lung burden equivalent to that achieved in this rat model study. In the present study, it is estimated that for the low, middle, and high dose used in the present rat study, equivalent human lung burdens would be achieved after application of this antimicrobial spray for 2 h, 5½ h and 24 h, respectively. Such exposure durations could be achieved if one were applying this spray on bathroom tile in a large hospital facility, hotel, or office building.
Pulmonary exposure to fine or nanosized TiO2 has been reported to result in substantial pulmonary inflammation (Ferin et al., 1992; Oberdorster, 1996; Duffin et al., 2007). In contrast, pulmonary responses after inhalation of an antimicrobial spray containing nano TiO2 were relatively small. This is due to the relatively low lung burdens employed in the present study. For example, Sager et al. (2008) reported the dose and time dependence of pulmonary inflammation and lung damage after intratracheal instillation of nano or fine TiO2. The rat strain and assay methods used by Sager et al. (2008) were identical to those used in the present study. The lowest lung burden employed in the Sager et al. (2008) study of 260 μg/rat resulted in an 11-fold increase in PMNs harvested by BAL 1 day post-exposure. In the present study, a 43.3 μg burden of TiO2 resulted in a two-fold increase in PMNs 1 day post-exposure. If one extrapolated the lung burden used in the present study to that used by Sager et al. (2008), one would predict a 12-fold increase in PMNs. Therefore, the relatively low pulmonary responses reported after inhalation of a TiO2 containing spray are in line with the lung burdens achieved.
An issue in pulmonary toxicology is the relevance of bolus pulmonary exposure achieved by pharyngeal aspiration or intratracheal instillation to exposure over time by inhalation. The results of the present study and those of Sager et al. (2008), being from the same laboratory, may be used to partially address this issue. Intratracheal instillation of 260 μg of nano TiO2 caused an 11-fold increase in PMNs 1 day post-exposure. In comparison, inhalation of 3.79 mg/m3 of nano TiO2, 4 h/day for 4 days, achieved a lung burden of 43 μg and caused PMNs to increase two-fold at 1 day post-exposure. Extrapolating to a 260 μg lung burden, one would predict that this inhalation study would cause a 12-fold increase in PMN. Therefore, the inflammatory responses to intratracheal instillation or inhalation of nano TiO2 were similar. It should be noted that the burden in the inhalation study was achieved over a short period of time (4 days). It is to be determined if the similarity in response would be achieved if a lower dose rate over a longer time were employed.
In the present study, microscopic evaluation clearly demonstrated that the high dose inhalation resulted in TiO2 particles within alveolar macrophages and on the alveolar epithelial surface. This high dose also resulted in a low level of pulmonary inflammation and an elevation in breathing rate. Alarie (1981) reported that pulmonary irritation would result in an elevation in breathing rate. This response is believed to involve excitation of sensory nerves in the airways and alveolar walls, which sense production of inflammatory mediators and transmit an excitatory signal to the respiratory center in the medulla (Castranova et al., 2002). The level of inflammation reported in the present study was apparently insufficient to affect specific airway resistance, which has been associated with large inflammatory responses to single-walled carbon nanotube exposure (Shvedova et al., 2005).
Inhalation of nano TiO2 in a rat model has been shown to decrease the dilatory responsiveness of microvessels in the shoulder muscle and the heart (Nurkiewicz et al., 2008; LeBlanc et al., 2009). In the present study, inhalation of a spray product containing nano TiO2 failed to alter the responsiveness of the tail artery to either constrictor or dilatory agents. The TiO2 lung burden in the present study was 43 μg, while Nurkiewicz et al. (2008) and LeBlanc et al. (2009) noted microvascular dysfunction at nano TiO2 lung burdens as low as 10 μg in systemic muscle and the heart, respectively. Although the tail artery model has been shown to be responsive to inhalation of irritants such as oil dispersant, and that these changes in microvessel responsiveness were accompanied by changes in heart rate and blood pressure (Krajnak et al., 2011), it may not be as sensitive as microvessel from other vascular beds. Indeed, coronary arterioles have been reported to be more sensitive to pulmonary exposure to nanoparticles than arterioles from the shoulder muscle of rats (LeBlanc et al., 2009).
In summary, several pulmonary and cardiovascular biomarkers were analyzed in rats that were exposed via inhalation to a commercial antimicrobial spray product containing nanosized TiO2 particles. Results indicate that at lung burdens likely to be achieved by occasional consumer use leads to no significant pulmonary or cardiovascular alterations. However, at a lung burden of 43 μg/rat lung increased breathing rate and elevation of BAL markers of inflammation and damage were found, indicating acute pulmonary irritation. Equivalent lung burdens may be achieved in a worker applying this antimicrobial spray on a routine basis to bathroom surfaces in large hospital, hotel, or office buildings. Therefore, care should be taken to minimize exposure by increasing ventilation and employing respiratory protection as needed during the application of this product. It would be prudent to avoid exposure to susceptible populations, such as children or those with pre-existing respiratory disease.
Supplementary Material
Acknowledgments
The authors thank the US Consumer Product Safety Commission for partial financial support of this product through an Interagency Agreement.
Footnotes
Declaration of interest
The findings and conclusions in this article are those of the author and do not necessarily represent the views of the National Institute for Occupational Safety and Health (NIOSH) or the US Consumer Product Safety Commission (CPSC). The mention of any company names or products does not imply an endorsement by NIOSH or CPSC, nor does it imply that alternative products are unavailable or unable to be substituted after appropriate evaluation.
References
- Alarie Y. Toxicological evaluation of airborne chemical irritants and allergens using respiratory reflex reactions. In: Leong BKD, editor. Proceeding of inhalation toxicology and technology symposium. Ann Arbor: Ann Arbor Science Publisher; 1981. pp. 207–231. [Google Scholar]
- Castranova V, Frazer DG, Manley LK, Dey RD. Pulmonary alterations associated with inhalation of occupational and environmental irritants. Int Immunopharmacol. 2002;2:163–172. doi: 10.1016/s1567-5769(01)00169-2. [DOI] [PubMed] [Google Scholar]
- Chen BT, Afshari A, Stone S, Jackson M, Schwegler-Berry D, Frazer DG, Castranova V, Thomas TA. Nanoparticles-containing spray can aerosol: characterization, exposure assessment, and generator design. Inhal Toxicol. 2010;22:1072–1082. doi: 10.3109/08958378.2010.518323. [DOI] [PubMed] [Google Scholar]
- Duffin R, Tran L, Brown D, Stone V, Donaldson K. Proinflammogenic effects of low-toxicity and metal nanoparticles in vivo and in vitro: highlighting the role of particle surface area and surface reactivity. Inhal Toxicol. 2007;19:849–856. doi: 10.1080/08958370701479323. [DOI] [PubMed] [Google Scholar]
- Ferin J, Oberdörster G, Penney DP. Pulmonary retention of ultrafine and fine particles in rats. Am J Respir Cell Mol Biol. 1992;6:535–542. doi: 10.1165/ajrcmb/6.5.535. [DOI] [PubMed] [Google Scholar]
- Krajnak K, Kan H, Waugh S, Miller GR, Johnson C, Roberts JR, Goldsmith WT, Jackson M, McKinney W, Frazer D, Kashon ML, Castranova V. Acute effects of COREXIT EC9500A on cardiovascular functions in rats. J Toxicol Environ Health Part A. 2011;74:1397–1404. doi: 10.1080/15287394.2011.606795. [DOI] [PubMed] [Google Scholar]
- LeBlanc AJ, Cumpston JL, Chen BT, Frazer D, Castranova V, Nurkiewicz TR. Nanoparticle inhalation impairs endothelium-dependent vasodilation in subepicardial arterioles. J Toxicol Environ Health Part A. 2009;72:1576–1584. doi: 10.1080/15287390903232467. [DOI] [PMC free article] [PubMed] [Google Scholar]
- McKinney W, Chen B, Frazer D. Computer controlled multi-walled carbon nanotube inhalation exposure system. Inhal Toxicol. 2009;21:1053–1061. doi: 10.1080/08958370802712713. [DOI] [PubMed] [Google Scholar]
- Mercer RR, Hubbs AF, Scabilloni JF, Wang L, Battelli LA, Friend S, Castranova V, Porter DW. Pulmonary fibrotic response to aspiration of multi-walled carbon nanotubes. Part Fibre Toxicol. 2011;8:21. doi: 10.1186/1743-8977-8-21. [DOI] [PMC free article] [PubMed] [Google Scholar]
- Nurkiewicz TR, Porter DW, Hubbs AF, Cumpston JL, Chen BT, Frazer DG, Castranova V. Nanoparticle inhalation augments particle-dependent systemic microvascular dysfunction. Part Fibre Toxicol. 2008;5:1. doi: 10.1186/1743-8977-5-1. [DOI] [PMC free article] [PubMed] [Google Scholar]
- Oberdorster G. Significance of particle parameters in the evaluation of exposure-dose-response relationships of inhaled particles. Inhal Toxicol. 1996;8(Suppl):73–89. [PubMed] [Google Scholar]
- Pennock BE, Cox CP, Rogers RM, Cain WA, Wells JH. A noninvasive technique for measurement of changes in specific airway resistance. J Appl Physiol. 1979;46:399–406. doi: 10.1152/jappl.1979.46.2.399. [DOI] [PubMed] [Google Scholar]
- Porter DW, Hubbs AF, Robinson VA, Battelli LA, Greskevitch M, Barger M, Landsittel D, Jones W, Castranova V. Comparative pulmonary toxicity of blasting sand and five substitute abrasive blasting agents. J Toxicol Environ Health Part A. 2002;65:1121–1140. doi: 10.1080/152873902760125363. [DOI] [PubMed] [Google Scholar]
- Porter DW, Hubbs AF, Baron PA, Millecchia LL, Wolfarth MG, Battelli LA, Schwegler-Berry DE, Beighley CM, Andrew ME, Castranova V. Pulmonary toxicity of Expancel microspheres in the rat. Toxicol Pathol. 2007;35:702–714. doi: 10.1080/01926230701481915. [DOI] [PubMed] [Google Scholar]
- Sager TM, Kommineni C, Castranova V. Pulmonary response to intratracheal instillation of ultrafine versus fine titanium dioxide: role of particle surface area. Part Fibre Toxicol. 2008;5:17. doi: 10.1186/1743-8977-5-17. [DOI] [PMC free article] [PubMed] [Google Scholar]
- Schaper M, Thompson RD, Alarie Y. A method to classify airborne chemicals which alter the normal ventilatory response induced by CO2. Toxicol Appl Pharmacol. 1985;79:332–341. doi: 10.1016/0041-008x(85)90355-2. [DOI] [PubMed] [Google Scholar]
- Rocco MC. Science and technology integration for increased human potential and societal outcomes. Ann NY Acad Sci. 2004;1013:1–6. doi: 10.1196/annals.1305.001. [DOI] [PubMed] [Google Scholar]
- Shvedova AA, Kisin ER, Mercer R, Murray AR, Johnson VJ, Potapovich AI, Tyurina YY, Gorelik O, Arepalli S, Schwegler-Berry D, Hubbs AF, Antonini J, Evans DE, Ku BK, Ramsey D, Maynard A, Kagan VE, Castranova V, Baron P. Unusual inflammatory and fibrogenic pulmonary responses to single-walled carbon nanotubes in mice. Am J Physiol Lung Cell Mol Physiol. 2005;289:L698–L708. doi: 10.1152/ajplung.00084.2005. [DOI] [PubMed] [Google Scholar]
- Stone KC, Mercer RR, Gehr P, Stockstill B, Crapo JD. Allometric relationships of cell numbers and size in the mammalian lung. Am J Respir Cell Mol Biol. 1992;6:235–243. doi: 10.1165/ajrcmb/6.2.235. [DOI] [PubMed] [Google Scholar]
- Sweeney TD, Brain JD, Leavitt SA, Godleski JJ. Emphysema alters the deposition pattern of inhaled particles in hamsters. Am J Pathol. 1987;128:19–28. [PMC free article] [PubMed] [Google Scholar]
Associated Data
This section collects any data citations, data availability statements, or supplementary materials included in this article.


