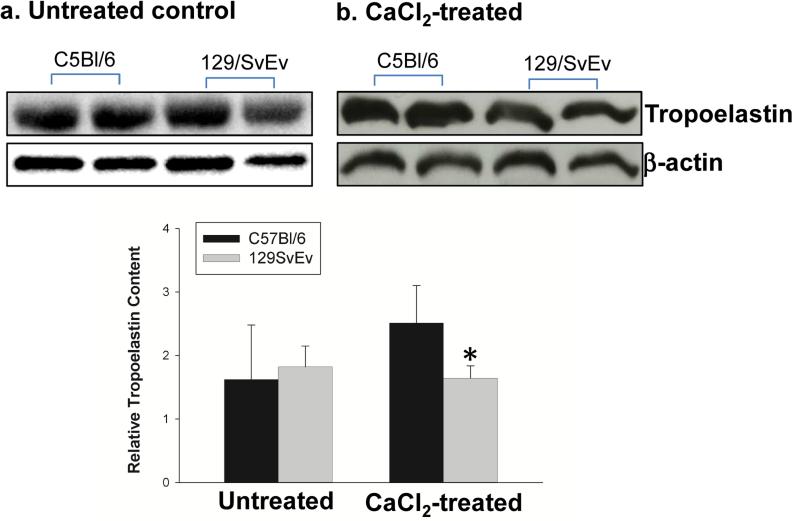
Figure 3. Aortic tropoelastin content.
Western blot analysis was used to determine tropoelastin content from C57Bl/6 and 129/SvEv mice before (a) and after (b) AAA induction. Relative levels of tropoelastin content in mouse aortas were quantified as shown in bar graphs (* P < .05 compared to CaCl2-treated C57Bl/6 mice) (n = 5-7/group).

