Abstract
Charasomes are convoluted plasma membrane domains in the green alga Chara australis. They harbor H+-ATPases involved in acidification of the medium, which facilitates carbon uptake required for photosynthesis. In this study we investigated the distribution of cortical microtubules and cortical actin filaments in relation to the distribution of charasomes. We found that microtubules and actin filaments were largely lacking beneath the charasomes, suggesting the absence of nucleating and/or anchoring complexes or an inhibitory effect on polymerization. We also investigated the influence of cytoskeleton inhibitors on the light-dependent growth and the darkness-induced degradation of charasomes. Inhibition of cytoplasmic streaming by cytochalasin D significantly inhibited charasome growth and delayed charasome degradation, whereas depolymerization of microtubules by oryzalin or stabilization of microtubules by paclitaxel had no effect. Our data indicate that the membrane at the cytoplasmic surface of charasomes has different properties in comparison with the smooth plasma membrane. We show further that the actin cytoskeleton is necessary for charasome growth and facilitates charasome degradation presumably via trafficking of secretory and endocytic vesicles, respectively. However, microtubules are required neither for charasome growth nor for charasome degradation.
Keywords: Chara australis, Charasome, Cytoskeleton, Internodal cell, pH banding, Plant
Introduction
The plasma membrane is composed of various domains which differ in the composition of lipids, sterols or sterol-like substances and sphingolipids, as well as in the composition of proteins (e.g. Malinsky et al. 2013, Jarsch et al. 2014). The size of plasma membrane domains varies between a few nanometers (‘lipid rafts’), probably present in the plasma membrane of every cell (Sonnino and Prinetti 2013), up to several micrometers as reported from the plasma membrane of yeast (Malinsky et al. 2013) and higher plants (e.g. Roppolo et al. 2011, Oda and Fukuda 2013a, Boutte and Moreau 2014). In addition to this lateral compartmentation of the plasma membrane, cells specialized for the transport of ions, carbohydrates or proteins may locally increase the area of the plasma membrane in order to accommodate a high number of transport proteins, adding an additional dimension in plasma membrane complexity. Animal cells with high transport activities across the plasma membrane often develop extensions towards the outside like microvilli (Lange 2011). The walled plant cells involved in extensive absorption or secretion of solutes increase their surface-to-volume ratio by convoluted plasma membrane domains (invaginations) which are stabilized by ingrowths of the secondary wall. Such ‘transfer cells’ are widespread over the whole plant kingdom including mosses, ferns and higher plants (Gunning and Pate 1969, Offler et al. 2003). Convoluted plasma membrane domains are also frequent in epidermal cells of submerged leaves of water plants (Prins et al. 1982). Their amplified plasma membrane area harbors numerous H+-ATPases which acidify their surroundings (Ligrone et al. 2011). The exported protons are used to reduce the poorly membrane-permeable hydrogen carbonate (HCO3−, bicarbonate) to CO2 which diffuses into the cell where it is used for photosynthesis.
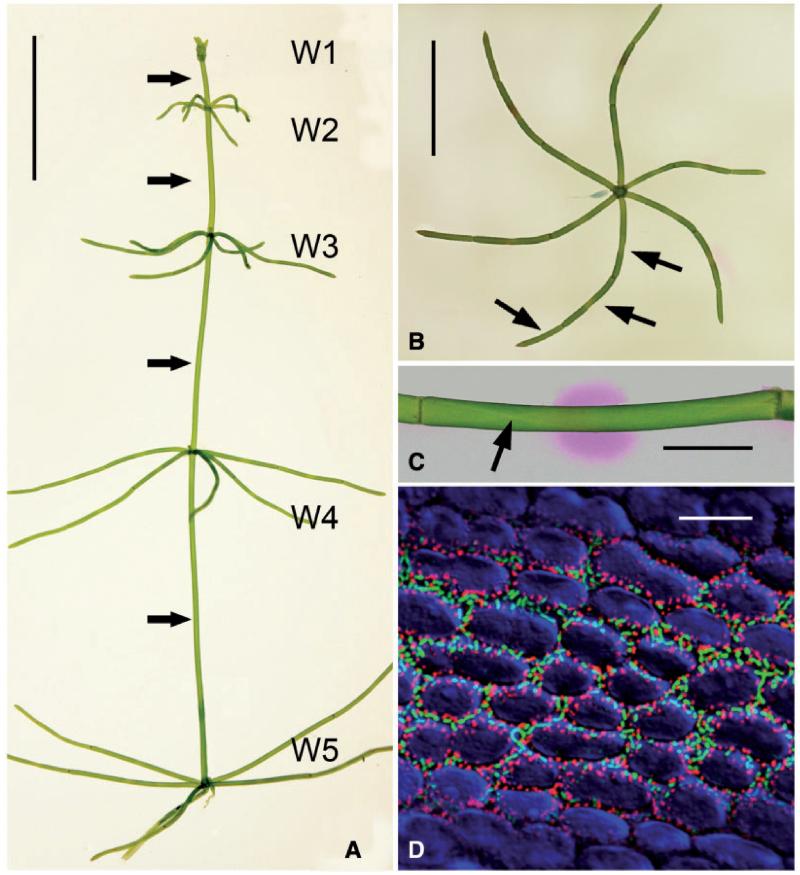
The highly evolved characean green algae use a similar strategy for carbon assimilation via acidification of the medium. Within their thallus, huge, cylindrical internodal cells alternate with groups of smaller, roundish or flat nodal cells (Fig. 1A, B). Their internodal cells show a conspicuous pattern of alkaline and acid bands which can be visualized by phenol red (Fig. 1C; Spear et al. 1969). The outward-directed proton fluxes at the acid bands are involved in photosynthetic carbon assimilation (Price et al. 1985, Bisson et al. 1991). The alkaline zones, probably regions of proton influx, are required for maintaining cellular pH homoeostasis (Bisson and Walker 1980). In internodal cells of the genus Chara and under steady-state conditions, the pH banding pattern correlates with the spatio-temporal distribution of elaborate plasma membrane invaginations called charasomes (Franceschi and Lucas 1980) (Fig. 1D, 4; Supplementary Fig. S1). These charasomes can be identified in living cells by fluorescent plasma membrane dyes due to the increased signal caused by the superimposed plasma membrane infoldings (Fig. 1D; Schmoelzer 2011). Unlike the infoldings in transfer cells of higher plants, ferns and mosses, however, charasomes are not stabilized by a secondary wall but by a dense, as yet unidentified protein or proteoglycan coat (Pesacreta and Lucas 1984). At the acid regions, charasomes are large and abundant (Fig. 1D) whereas at alkaline bands only few and small charasomes are present (Franceschi and Lucas 1980, Schmoelzer et al. 2011). In a previous study, we were able to confirm earlier findings about H+-ATPase activity (Price and Whitecross 1983) and showed that H+-ATPases are distributed along the whole plasma membrane, being more concentrated at charasomes due to the increase in plasma membrane area (Schmoelzer et al. 2011), underpinning the idea of a positive correlation between the distribution of charasomes and pH banding in Chara at least in internodal cells of the branchlets. A prerequisite for charasome development is photosynthesis (Bisson et al. 1991). The formation of acid and alkaline bands has also been described to depend on photosynthesis and, additionally, on cytoplasmic streaming (Bulychev et al. 2001b). The latter occurs via interaction of myosin-associated endoplasmic organelles with subcortical actin bundles attached to the inner surface of the stationary chloroplast files (Supplementary Fig. S1; Shimmen 2007).
Fig. 1.
The characean thallus, pH banding and cortical cytoplasm of branchlet internodal cells. (A) Thallus of Chara australis with five whorls (W1–W5) separated by internodal cells of the main axis (arrows). (B) Isolated whorl corresponding to W4 in (A). Arrows indicate positions of branchlet internodal cells. (C) Internodal cell of a branchlet incubated in phenol red to show the pH banding pattern (the pink region indicates alkaline pH). The arrow points to the neutral line. (D) Fluorescence micrograph showing charasomes at an acid region stained with green fluorescent FM1-43 and mitochondria stained with red fluorescent mitotracker orange. Chloroplasts are false colored blue. Scale bars = 1 cm (A, B), 1 μm (C) and 10 μm (D).
In general, plasma membrane domains are characterized by a specific set of lipids and proteins (e.g. Mongrand et al. 2010, Malinsky et al. 2013). During the course of this study we investigated whether there is a relationship between the distribution of charasomes and that of the cortical cytoskeleton components. We focused on the cortical microtubule and actin cytoskeleton which forms a structural and physiological unit with the plasma membrane, being involved in signal transduction, endo- and exocytosis and other transport processes (e.g. de Curtis and Meldolesi 2012, McKenna et al. 2014). Several findings already revealed a close relationship between cytoskeleton and plasma membrane domains. In animal cells, proteins enriched in small plasma membrane domains (lipid rafts) were shown to be involved in the organization of the actin and microtubule cytoskeleton (e.g. Head et al. 2014). In higher plant cells, microtubules have been shown to be excluded from plasma membrane domains enriched in Rho-GTPases (Oda and Fukuda 2013b). The results of the present study showed that microtubules and actin filaments were largely excluded from the cytoplasmic surface of charasomes, indicating local absence of nucleating and/or anchoring proteins. We also confirmed earlier findings (Pesacreta and Lucas 1984) indicating that coated pits were largely absent from the membrane of mature charasomes. We found further that microtubules were not required for the formation and degradation of charasomes, whereas the disturbance of the actin cytoskeleton had significant effects on charasome growth and degradation. These data suggest that actin and the microtubule cytoskeleton are not equally important for charasome development.
Results
Microtubules largely excluded from charasomes
During the course of this study, we used internodes of the branchlets collected from the second to the fifth upper whorl of a thallus (Fig. 1A). Each whorl consisted of five or six branchlets and each branchlet consisted of 2–3 internodal cells which varied in length between 5 and 30 mm (Fig. 1B, C). Following incubation in the pH indicating dye phenol red, cells formed one to several alkaline bands flanked by acid zones (Fig. 1C). Charasomes visualized by staining with FM dyes were preferentially located at the acid regions, as described earlier (Fig. 1D; Schmoelzer et al. 2011). The size and abundance of charasomes formed under similar growth conditions depended on the developmental stage of internodal cells (Chau et al. 1994, Schmoelzer et al. 2011; see below). Charasomes were smaller and less abundant in young, elongating internodes (W1–W3) than in mature cells (W4–W5). Furthermore, charasomes in young internodal cells were usually roundish (Fig. 2A) whereas those in mature cells often had an elongate, branched shape (Figs. 1D, 2I). In the mature internodal cells of branchlets used for this study, the charasome area fraction, i.e. the percentage of charasomes covering the cell surface amounted up to 45% at the acid regions of the cells. At the alkaline zones, where only few, minute charasomes were present, the charasome area fraction was always <5% and this percentage was independent of the developmental stage (Schmoelzer et al. 2011).
Fig. 2.
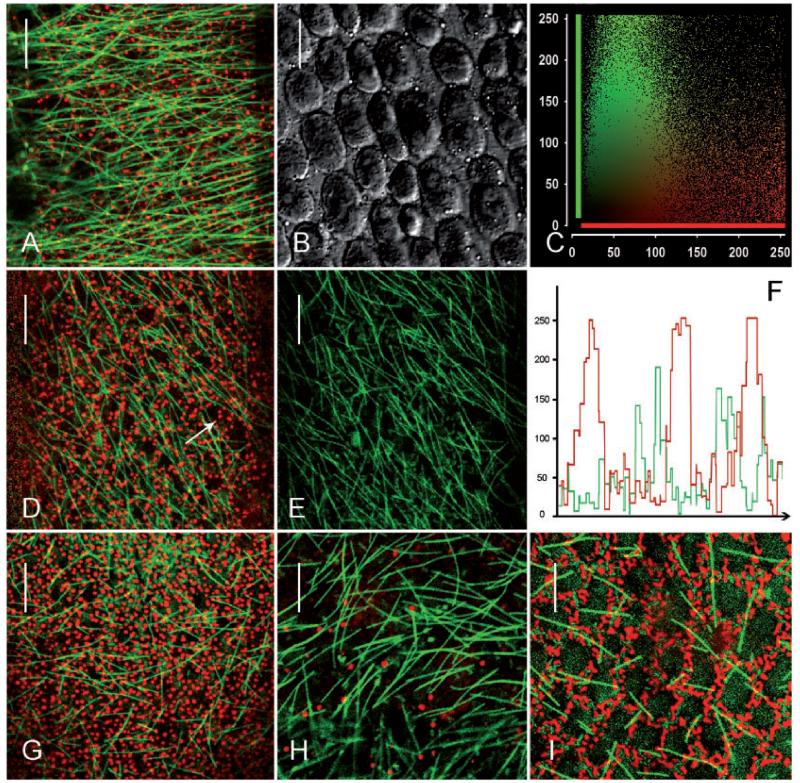
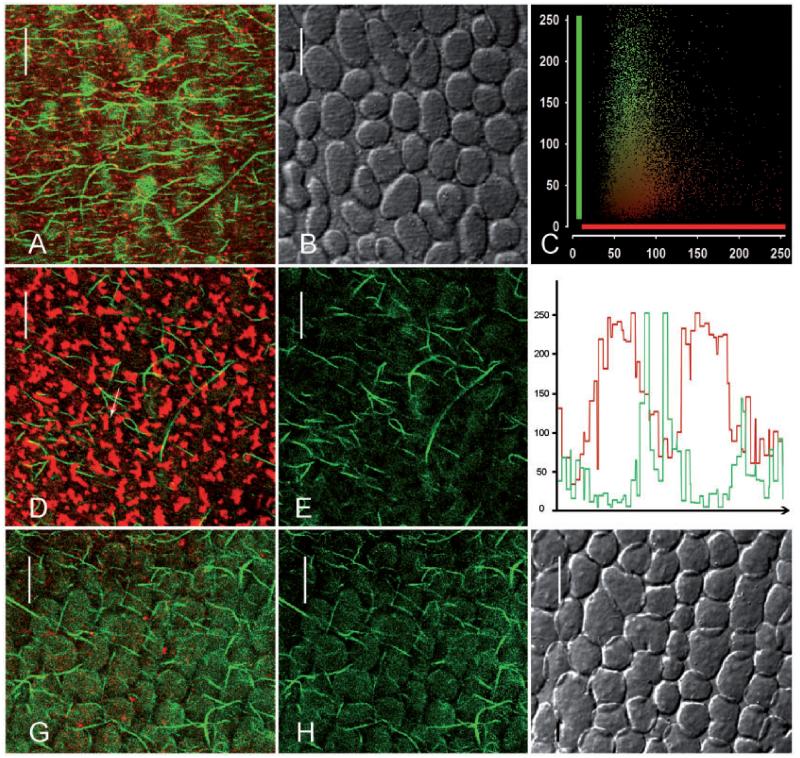
Charasomes (stained with red fluorescent AM4-64) and microtubules (labeled with green fluorescent paclitaxel) in branchlet internodal cells of C. australis. (A–C) Images from an acid region of an elongating cell. Charasomes are small (A) and microtubules are oriented predominantly transverse to the longitudinal axis of the cell. (A is the merged image; B is the corresponding DIC image.) The scatterplott (C) shows the fluorescence intensities (0–250) for each pixel in (A) (y axis = green microtubule fluorescence, x axis = red charasome fluorescence). Note the virtual absence of co-localization (yellow pixels). (D–F) Microtubules and charasomes in an acid region of a nearly mature cell (D is the merged image; E illustrates the microtubules only). The intensity profile in (F) corresponds to the arrow in (D) and shows that microtubules are predominantly located between charasomes. (G and H) Charasomes and microtubules at an acid (G) and an alkaline region (H) of a cell which has completed growth. (I) Charasomes and microtubules at the acid region of a mature cell. Note branched charasomes and short microtubules. Scale bars = 10 μm.
In order to visualize charasomes together with microtubules, FM-stained internodal cells were either perfused with fluorescent paclitaxel (Fig. 2) or fixed and processed for immunofluorescence with an antibody against tubulin (Supplementary Fig. S2A, B). Both methods yielded similar images, ruling out the possibility that perfusion with the microtubule-stabilizing paclitaxel induced changes in microtubule length and/or orientation or that FM staining prior to perfusion with fluorescent paclitaxel or immunolabeling changed the distribution of microtubules in relation to charasomes. For our study, we preferred perfused cells because the uneven surface of the shrunken cytoplasm in chemically fixed cells impaired the analysis of co-localization. Furthermore, FM-stained charasomes were often less distinct in fixed cells, probably due to dye leakage.
The density, length and orientation of cortical microtubules in characean internodal cells of the main axis depend on the developmental stage (Wasteneys and Williamson 1987), and this was also true for the internodal cells of branchlets investigated during this study. Cells collected from the second whorl had abundant and long cortical microtubules which were oriented predominantly transverse to the long axis, indicating that cells were rapidly elongating (Fig. 2A–C). These cells usually contained small and roundish charasomes with a diameter not exceeding 1 μm (Fig. 2A), often being homogeneously distributed along the cell surface, which is consistent with the absence of a detectable pH banding pattern. The microtubules of internodal cells collected from the third whorl were mostly oriented in an oblique direction relative to the cell’s long axis, as typical for internodes which had just completed growth (Fig. 2D, E; Wasteneys and Williamson 1987). Charasomes at the acid regions of these cells were more numerous than in younger cells and had a roundish or elongate shape (Fig. 2D). Cells from the fourth and older whorls had fewer and shorter microtubules without preferred orientation (Fig. 2G–I) and contained elongate and branched charasomes at the acid zones (Fig. 2G, I; Supplementary Fig. S2A). At the alkaline zones, charasomes were small or even absent (Fig. 2H; Supplementary Fig. S2B). To summarize, during maturation of branchlet internodal cells, microtubules became shorter and less abundant, whereas charasomes became larger and more abundant at the acid regions.
A comparison between the distribution of cortical microtubules and that of charasomes showed that microtubules were preferentially located between charasomes, even in regions with a high abundance of charasomes and/or microtubules. The long and slender microtubules in younger cells of the second and the third whorls often appeared to curve around the small, punctate charasomes and were rarely seen along the cytoplasmic surface of charasomes (Fig. 2A, C, D, F). The shorter and thicker microtubules of older cells (probably microtubule bundles, see below) appeared to be stiffer but were also largely excluded from the charasomes (Fig. 2G, I). No microtubules were observed beneath the few, small and widely spaced charasomes present at the alkaline zones (Fig. 2H; Supplementary Fig. S2B).
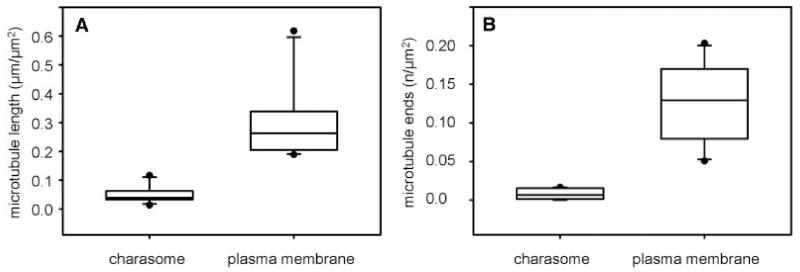
For the statistical analysis, we measured the relative lengths of microtubules beneath smooth plasma membrane and beneath charasomes at the acid regions (charasome area fraction between 15% and 45%) of cells. These data revealed that the median value for microtubule length per μm2 smooth plasma membrane was significantly higher than the median value for microtubule length per μm2 charasome area (Fig. 3A). The ratio between these two values was 5.7, meaning that on average up to 5.7-fold more microtubules were present at the smooth than at the convoluted plasma membrane regions (charasomes). The ratios in individual cells varied between 1.5 and 9.6 and were independent of charasome area fraction (reflecting the growth of charasomes during cell maturation) or microtubule density (total microtubule length in μm per μm2 measured area; reflecting ageing of internodal cells) (Supplementary Fig. S3A).
Fig. 3.
(A) Relative microtubule lengths and (B) relative number of microtubule ends and branchings at the smooth plasma membrane and at charasomes are compared in box-and-whisker plots. Shown are median values with upper and lower quartiles (boxes), whiskers indicating the 10th and 90th percentiles, and outliers (dots) with n = 15 for each plot. Differences between median values are significant (Mann–Whitney rank sum test, P≤0.001).
Cortical microtubules are nucleated from γ-tubulin complexes localized at other microtubules or at the plasma membrane (e.g. Murata et al. 2005, Nakamura et al. 2010). Therefore, branches or ends of microtubules are likely to indicate the position of a nucleating complex. We therefore investigated the distribution of microtubule ends or branchings in relation to the distribution of charasomes. Differences between median values of microtubule ends and branchings per μm2 charasome area and smooth plasma membrane area were highly significant (Fig. 3B). The ratio of the median values was 13.8, i.e. up to 13.8-fold more microtubule ends and branchings were observed at the smooth plasma membrane as compared with the charasome cytoplasmic surface. The individual values (ranging between 8.7 and 88.6) were independent of charasome area fraction or microtubule density (Supplementary Fig. S3B).
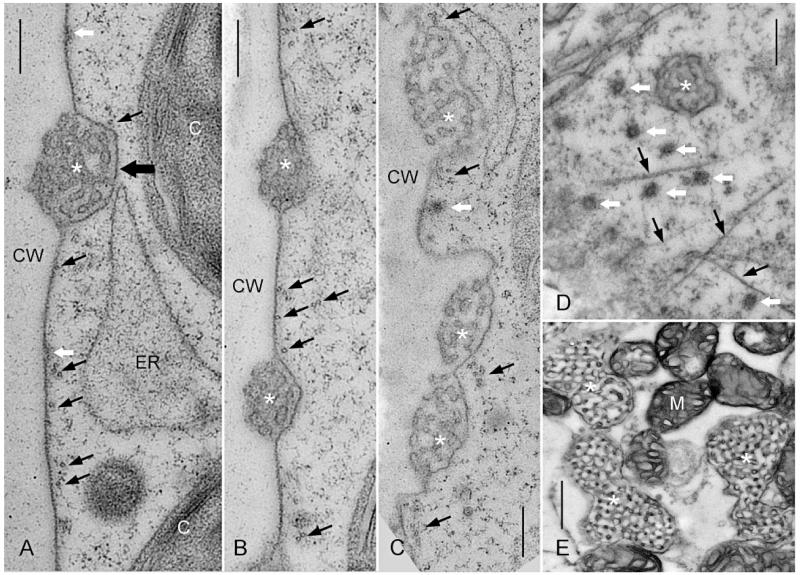
The fine structure of the cortical cytoplasm of branchlet internodal cells is shown in Fig. 4. In rapidly elongating branchlet internodal cells, microtubules were oriented perpendicular to the cell’s long axis and preferentially located between charasomes (Fig. 4A, B, D), confirming the data obtained by confocal laser scanning microscopy (see above). The distances between the plasma membrane and microtubules varied between 5 and 300 nm, suggesting that cortical microtubules are anchored at one end only and consistent with an earlier study which showed an oblique orientation of microtubules relative to the plasma membrane (Foissner and Wasteneys 1999; see also Sainsbury et al. 2008 for microtubules in higher plant cells). Beneath charasomes, microtubules were only occasionally observed and their distance from the charasome membrane was always >5 nm (e.g. Fig. 4A). In older internodal cells which contained larger charasomes or charasome meshworks (Fig. 4C, E), microtubule bundles were found between charasomes or at the boundary between ‘fusing’ charasomes and at a considerable distance from the charasome cytoplasmic surface (Fig. 4C). The electron micrographs of high-pressure frozen and cryosubstituted cells also confirmed earlier studies from chemically fixed cells which showed that the cytoplasmic surface of non-growing charasomes is largely devoid of coated pits (Pesacreta and Lucas 1984; Fig. 4A, B).
Fig. 4.
Electron microscopical sections through the cortex of branchlet internodal cells of C. braunii (A, B) and C. australis (C–E). Asterisks indicate charasomes, thin black arrows indicate microtubules and white arrows indicate coated pits or coated vesicles; C, chloroplast; ER, endoplasmic reticulum; CW, cell wall. (A and B) Longitudinal sections of high-pressure frozen and cryosubstituted cells. The thick black arrow points to the cytoplasmic surface of the charasome. (C–E) Longitudinal (C) and tangential sections (D, E) of chemically fixed cells. (C) Detachment of charasomes and smooth plasma membrane from the cell wall is an artifact. (D) Tangential section near the plasma membrane of an elongating cell. (E) Deeper tangential section through the cortex of a mature cell showing large charasomes in close contact with mitochondria (M). Scale bars = 300 nm (A–D) and 500 nm (E).
It has been reported that the relative number of cortical microtubules at acid bands is higher than the relative number of microtubules at alkaline regions in internodal cells of the main axis of Chara corallina (Wasteneys and Williamson 1992). Accordingly, charasome-rich, acid zones should have more microtubules than charasome-poor, alkaline areas. In branchlet internodal cells of Chara australis investigated during the course of this study, the total number of microtubules per μm2 (at the charasome cytoplasmic surface and between charasomes) was independent of the charasome area fraction and thus independent of the pH banding pattern. A pair-wise comparison of microtubule density (number of microtubules counted along a 20 μm line positioned at various angles according to Wasteneys and Williamson (1992)) at charasome-rich and charasome-poor zones of the same cells showed that microtubule numbers per micrometer varied slightly but did not correlate with the charasome area fraction (data not shown).
Cortical actin filaments preferentially between charasomes
The actin cytoskeleton of branchlet internodal cells was visualized by perfusion with fluorescent phalloidin (Foissner and Wasteneys 2007). It consists of subcortical parallel bundles along the inner surface of the stationary chloroplast files which are responsible for cytoplasmic streaming via interaction with myosin-coated, endoplasmic organelles (Shimmen 2007). These bundles extend towards the cell periphery, especially in elongating cells where there is ample space between growing chloroplasts. In addition, single or less bundled actin filaments are present at the plasma membrane (Foissner and Wasteneys 2000, and references therein; Supplementary Fig. S1). During cell elongation, the orientation of these cortical actin filaments changes from near transverse to the cell’s long axis to random (Wasteneys et al. 1996) just like the orientation of microtubules. Fig. 5A–C shows small punctate charasomes and abundant, transversely oriented cortical actin filaments in a young, rapidly elongating branchlet internodal cell. The acid regions of mature cells contained larger charasomes with an irregular shape and randomly oriented cortical actin filaments (Fig. 5D–F). In both young and older cells, cortical actin filaments extended mainly between charasomes (Fig. 5A, C, D, F). Cortical actin filaments were never found beneath the few and small charasomes present at the alkaline zones (Fig. 5G–I).
Fig. 5.
Charasomes (labeled with red fluorescent FM4-64) and cortical actin filaments (stained with green fluorescent phalloidin) in branchlet internodal cells of C. australis. (A–C) Images from an acid region of an elongating cell. Charasomes are small and actin filaments are oriented predominantly transverse to the longitudinal axis of the cell. (A is the merged image, B is the DIC image and C is the scatterplot corresponding to A.) (D–F) Actin filaments and charasomes in an acid region of a mature cell. Note abundant and large charasomes; actin filaments are less abundant and randomly oriented (D is the merged image; E shows the actin filaments only). The intensity profile in (F) corresponds to the arrow in (D) and shows that actin filaments are predominantly located between charasomes. (G–I) Charasomes and actin filaments in an alkaline region adjacent to the acid zone in (D). (G is the merged image, H shows the actin filaments only, I is the corresponding DIC image.) Scale bars = 10 μm.
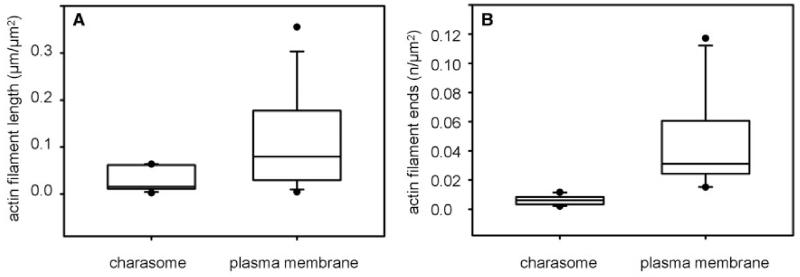
The statistical analysis of actin filament distribution and density was made at (acid) regions where the charasome area fraction was between 16% and 51%. The differences in relative actin filament length at smooth plasma membrane regions and at charasomes were not as pronounced as shown for microtubules, but medians were significantly different (Fig. 6A). The ratio between these two values was 4.4, i.e. on average up to 4.4-fold more actin filaments were present at the smooth plasma membrane as compared with the charasome area. The ratios in individual cells varied between 1.1 and 9.8, and were independent of charasome area fraction and of actin filament density (total actin filament length in μm per μm2 measured area; Supplementary Fig. S4A).
Fig. 6.
(A) Relative actin filament lengths and (B) relative number of actin filament ends at charasomes and at the smooth plasma membrane are compared in box-and-whisker plots. Shown are median values with upper and lower quartiles (boxes), whiskers indicating the 10th and 90th percentiles, and outliers (dots) with n = 11 (A) and 10 (B). Differences between median values are significant (Mann–Whitney rank sum test, P = 0.027 and P≤0.001, respectively).
Actin filaments are often nucleated from protein complexes associated with the cell membrane (e.g. van Gisbergen and Bezanilla 2013). We therefore counted the number of actin filament ends per μm2 smooth plasma membrane and per μm2 charasome in the acid regions (charasome area fractions varied between 14% and 36%). Actin filament ends were more abundant at the smooth plasma membrane as compared with the cytoplasmic surface of charasomes. The difference between the mean values 0.031 and 0.006 per μm2 was highly significant (P ≤ 0.001; Fig. 6B). The ratio between these two values was 5, i.e. on average up to 5-fold more actin filament ends were present at the smooth plasma membrane as compared with the charasome area. The ratios in individual cells varied between 2.2 and 15.1, and were independent of charasome area fraction and of actin filament density (Supplementary Fig. S4B).
No significant differences in the density or length of cortical actin filaments were found between charasome-containing acid and charasome-free alkaline regions (compare Fig. 5E, H) of branchlet internodal cells. We also found no correlation between the distribution of cytochalasin-induced cortical actin rods and the distribution of charasomes. Such actin rods were induced by 1 h treatment with 5 μM cytochalasin D, a concentration which reorganizes cortical actin filaments but which does not arrest cytoplasmic streaming (Supplementary Fig. S5; Foissner and Wasteneys 2007). The actin rods were not homogeneously distributed in the cortex of internodal cells and it had been suggested that this patchy pattern might correspond to the pH banding pattern and/or the distribution of charasomes (Foissner and Wasteneys 1997a). The images obtained after staining cells with FM1-43 and perfusion with fluorescent phalloidin, however, revealed that the distribution of cytochalasin D-induced cortical actin rods was independent of the distribution of charasomes. On the one hand, we observed that the length and abundance of actin rods was similar in charasome-rich (Supplementary Fig. S5A, B) and neighboring charasome-poor regions (Supplementary Fig. S5C, D), and, on the other hand, differences in actin rod length and abundance occurred within regions with homogeneously distributed charasomes (Supplementary Fig. S5E, F; note short actin rods at the left side of the image and long actin rods at the right side of the image). Cortical actin rods were also present in cells treated with 25 μM cytochalasin D (Supplementary Fig. S5G, H).
Charasome growth requires a functional actin cytoskeleton but not microtubules
During the course of this project, we also wanted to find out whether the depolymerization of microtubules or the disturbance of the actin cytoskeleton affected the development of charasomes. For that purpose, branchlet internodal cells were treated with inhibitors or the appropriate concentration of the solvent (controls) and exposed to a 14/10 h light/dark regime. After 7–14 d the pH banding pattern, the velocity of cytoplasmic streaming and the PSII quantum efficiency (photosynthesis) were documented. After staining with FM1-43, maximum charasome area fractions were determined for each cell.
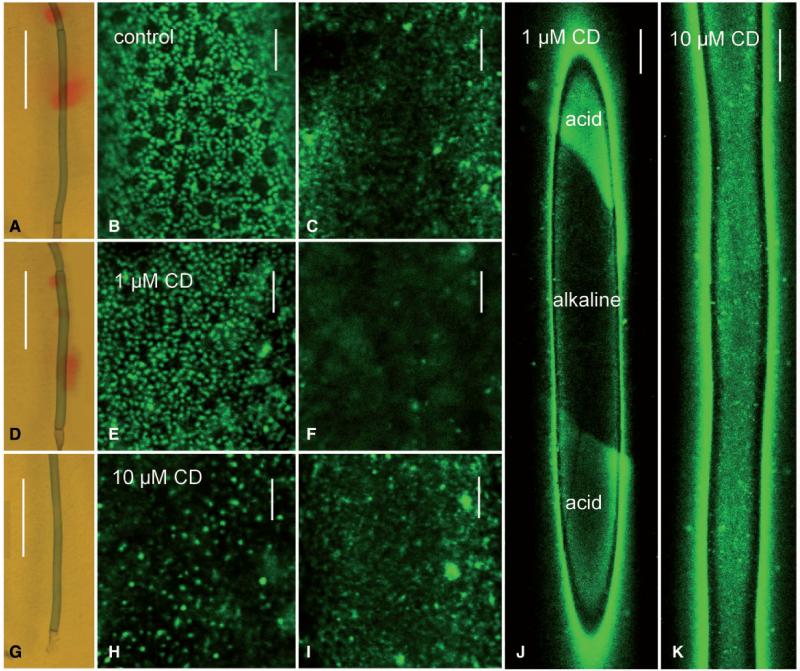
The role of the actin cytoskeleton in pH banding and charasome growth was studied with cytochalasin D which affects cortical actin filaments and subcortical bundles (cytoplasmic streaming) in a concentration-dependent matter (Foissner and Wasteneys 2007). The concentration of cytochalasin D required for reversible arrest of cytoplasmic streaming depends on the type of cells, their physiological status and their age. In branchlet internodal cells used for the study of pH banding and charasome growth, cytoplasmic mass streaming was inhibited by 10 μM cytochalasin D (Table 1). At lower concentrations (1 and 5 μM) cytochalasin D reversibly remodeled the cortical actin filaments into stable rods (see above and Supplementary Fig. S5) while cytoplasmic mass streaming continued at lower rates (Table 1). The effect of cytochalasin D on pH banding was as described in earlier papers for cytochalasin B (Lucas and Dainty 1977, Bulychev et al. 2001b). After 7 d treatment with 1 μM cytochalasin D, the number of alkaline regions was enhanced as compared with the control cells and, after 7 d treatment with 10 μM cytochalasin D, pH banding was completely inhibited just as cytoplasmic mass streaming (Table 1; Fig. 7A, D, G). The shape, size and distribution of charasomes formed over a period of 7 d in the presence of 1 μM cytochalasin D (Fig. 7D–F) were similar to those in control cells (Fig. 7A–C), i.e. regions with a high abundance of charasomes alternated with regions where charasomes were less abundant and often smaller. Fewer and smaller charasomes were observed in cells treated with 10 μM cytochalasin D (Fig. 7G–I). The inhibitory effect of 10 μM cytochalasin D on charasome development was obvious even at low magnifications of FM-stained cells. In untreated cells and in cells treated with 1 μM cytochalasin D (Fig. 7J), regions with high abundances of charasomes (acid regions) alternated with zones where charasomes were less abundant (alkaline regions). In cells treated with 10 μM cytochalasin D, charasome size and distribution were similar along the whole cytoplasmic surface of cells, resulting in a more or less uniform fluorescence of plasma membrane dyes (Fig. 7K).
Table 1.
Effect of cytochalasin D (CD) on the velocity of cytoplasmic streaming and on the pH banding pattern of branchlet internodal cells of Chara australis
| Control (0.5% DMSO) | 1 μM CD | 10 μM CD | |
|---|---|---|---|
| Velocity of cytoplasmic streaming in μm s−1; means ± SD (n) | 81.4 ± 3.8 (6) | 40.8 ± 15.7 (12)* | 0 ± 0 (8)* |
| Number of pH bands per cell; means ± SD (n) | 1± 0 (12) | 2.4 ± 1.0 (12)* | 0 ± 0 (12)* |
Cells were treated with CD for 7 d under light/dark conditions. For measuring the pH banding activity, 4 μM phenol red was added and cells were exposed to light until a constant number of alkaline bands could be detected (30 min).
Significant differences between means of control and treatments are indicated by asterisks (Mann–Whitney rank sum test, P<0.01); n = number of cells investigated.
Fig. 7.
Effect of cytochalasin D (CD) on pH banding and charasome growth in branchlet internodal cells of C. australis. (A–C) Control cell treated with AFW + 0.5% DMSO for 7 d. One alkaline band is seen in medium supplemented by phenol red (A). Charasomes (stained with green fluorescent FM1-43) are abundant at the acid zone (B) and largely absent from the alkaline band (C). (D–F) Cell treated with 1 μM CD for 7 d. Note several weak alkaline bands in (D). Charasome size and abundance at the acid (E) and alkaline zone (F) are similar to those in control cells. (G–I) Cell treated with 10 μM CD for 7 d. pH banding is inhibited (G); no obvious differences in charasome distribution along the cell can be detected (H, I two different regions of the cell illustrated in G). (J) Overview of charasome distribution in the cell illustrated in (D). Note distinct differences in charasome density according to the pH banding pattern. (K) Overview of charasome distribution in the cell illustrated in (G) (10 μM CD). Charasomes are evenly distributed. Scale bars are 1 cm (A, D, G), 250 μm (J, K) and 10 μm (B, C, E, F, H, I).
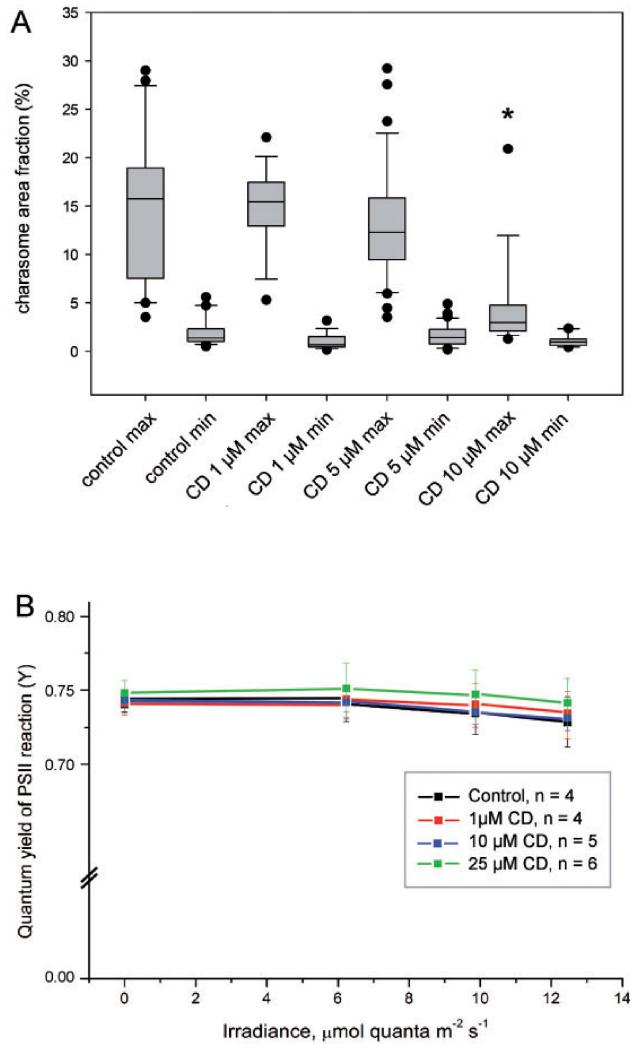
The statistical analysis confirmed significantly lower median values for maximum charasome area fractions in cells where cytoplasmic streaming was arrested with 10 μM cytochalasin D (Fig. 8A). In contrast, minimum charasome area fractions were similar in control and cytochalasin D-treated cells (Fig. 8A). Photosynthesis, measured as effective quantum yield of electron flow in PSII, was not significantly affected after 7 d treatment with cytochalasin D under the conditions used during this study (Fig. 8B), indicating that the inhibitory effect of this drug on charasome development was not due to an unspecific side effect.
Fig. 8.
Effect of cytochalasin D (CD) and DMSO (0.1%; control) on charasome growth and photosynthetic activity in Chara internodal cells. Cells were incubated in darkness for 2 weeks in order to degrade existing charasomes (data not shown) and subsequently exposed to light in media containing DMSO (control) or cytochalasin, respectively. (A) Maximum and minimum charasome area fractions after a 7 d treatment are compared in box-and-whisker plots. Shown are median values with upper and lower quartiles (boxes), whiskers indicating the 10th and 90th percentiles, and outliers (dots) with n≥16 for each plot. Charasome formation was significantly inhibited in cells treated with 10 μM CD (*P < 0.05, Kruskal–Wallis one-way analysis of variance on ranks). (B) Photosynthetic efficiency ΔF/Fm (ΔF/Fm′) of cells treated with various concentrations of CD and with 0.25% DMSO. Data are presented as mean values ± SD (n is the number of cells examined). Differences in photosynthetic activity between untreated and CD-treated cells were insignificant.
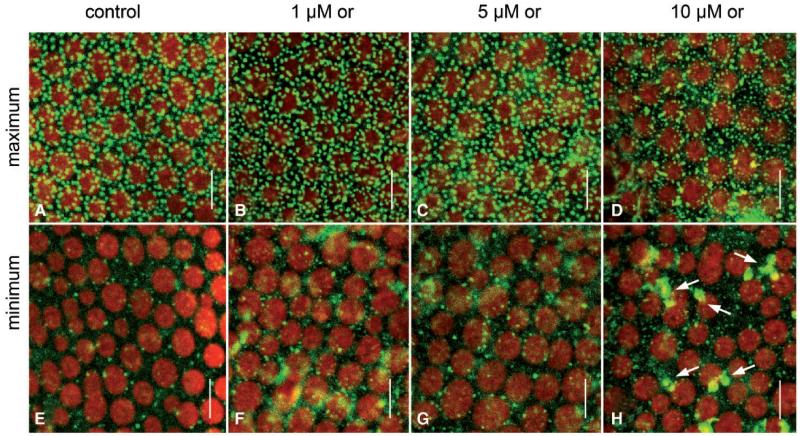
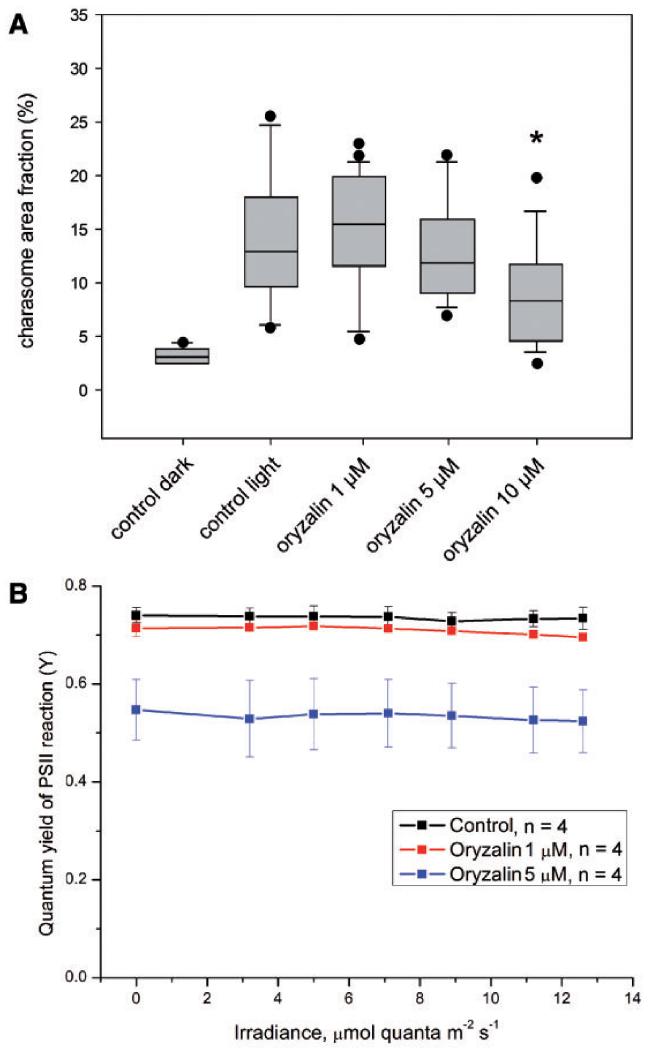
The microtubule-depolymerizing drug oryzalin was used at concentrations of 1, 5, and 10 μM (Figs. 9, 10). The concentration of 1 μM was sufficient to disassemble microtubules in branchlet internodal cells within 30 min (Supplementary Fig. S6), but affected neither the velocity of cytoplasmic streaming (Table 2) nor PSII quantum efficiency (Fig. 10B). The pH banding pattern and the maximum and minimum charasome area fractions in cells treated with 1 μM oryzalin were similar to those in control cells (Table 2; Figs. 9A, B, E, F, 10A). Charasome area fractions similar to those in controls were also observed in cells incubated in 5 μM oryzalin in spite of a significant decrease in pH bands (Table 2; Figs. 9C, G, 10A). A significant decrease in the pH banding activity and in maximum charasome area fraction occurred at 10 μM oryzalin (Figs. 9D, H, 10A). At this concentration, oryzalin also affected the morphology and anchoring of chloroplasts (Fig. 9D, H). In control cells, as well as in cells treated with 1 or 5 μM oryzalin (Fig. 9A–C, E–G) the chloroplasts were often elongate and arranged in helical files. Cells treated with 10 μM oryzalin for several days always had roundish and less regularly arranged chloroplasts (Fig. 9D, H), and, occasionally, areas without any chloroplasts (not shown). This and the presence of wound walls, which are also brightly stained by FM dyes (Fig. 9H, arrows), indicates considerable but unspecific damage by long-term treatment with this concentration of the inhibitor (compare Langhans et al. 2009). This unspecific effect is also reflected by the significant decrease in PSII quantum efficiency at concentrations of ≥5 μM (Fig. 10B).
Fig. 9.
Effect of microtubule depolymerization on charasome formation in branchlet internodal cells of C. australis. Charasomes were visualized by green fluorescent FM1-43 in the acid (A–D) and in the adjacent alkaline regions (E–H). Cells were treated with 0.1% DMSO (controls; A,E), and with 1 (B, F), 5 (C, G) and 10 μM oryzalin (or; D, H). Note FM1-43-stained wound walls (arrows) and irregularly arranged chloroplasts (red) in (H). Scale bars = 10 μm.
Fig. 10.
Effect of oryzalin and DMSO (0.1%; control) on charasome growth and photosynthetic activity in Chara internodal cells. Cells were incubated in darkness for 2 weeks and subsequently exposed to light in medium containing DMSO or oryzalin, respectively. (A) Maximum charasome area fractions per cell were measured before (control dark) and after a 7 d light treatment. Shown are median values with upper and lower quartiles (boxes), whiskers indicating the 10th and 90th percentiles, and outliers (dots) with n≥9 for each plot. Charasome formation is significantly inhibited in cells treated with 10 μM oryzalin (P < 0.02; Kruskal–Wallis one-way analysis of variance on ranks). (B) Photosynthetic efficiency ΔF/Fm (ΔF/Fm′) of cells treated with oryzalin and DMSO (0.1%; control). Data are presented as mean values ± SD (n is the number of cells examined). Note that the charasome area fraction is similar to that of controls in cells treated with 1 μM oryzalin, a concentration sufficient to disassemble microtubules in Chara internodal cells. The significant reduction in charasome area fraction observed at 10 μM oryzalin is considered to be unspecific because of the pronounced inhibition of PSII activity at 5 μM oryzalin and higher concentrations.
Table 2.
Effect of oryzalin on the velocity of cytoplasmic streaming and on the pH banding pattern of branchlet internodal cells of Chara australis
| Control (0.5% DMSO) | 1 μM oryzalin | 5 μM oryzalin | 10 μM oryzalin | |
|---|---|---|---|---|
| Velocity of cytoplasmic streaming in μm s−1; means ± SD (n) | 74.9 ± 7.9 (12) | 75.5 ± 8.8 (19) | 74.8 ± 8.4 (18) | 79.6 ± 6.7 (8) |
| Number of pH bands per cell; means ± SD (n) | 1.4 ± 0.5 (11) | 1.1 ± 0.3 (13) | 0.7 ± 0.5 (15)* | 0.5 ± 0.5 (13)* |
Cells were treated with the inhibitor for 7 d under light/dark conditions. For measuring the pH banding activity 4 μM phenol red was added and cells were exposed to light until a constant number of alkaline bands could be detected (30 min).
Significant differences between means of control and treatments are indicated by asterisks (Mann–Whitney rank sum test, P<0.01); n = number of cells investigated.
We also applied 10 μM paclitaxel in order to find out whether stabilization of microtubules had an effect on charasome growth. This concentration is sufficient to arrest microtubule turnover in characean internodes (Foissner and Wasteneys 1997b) but had no significant effect on charasome development (data not shown).
Inhibition of cytoplasmic streaming delays charasome degradation
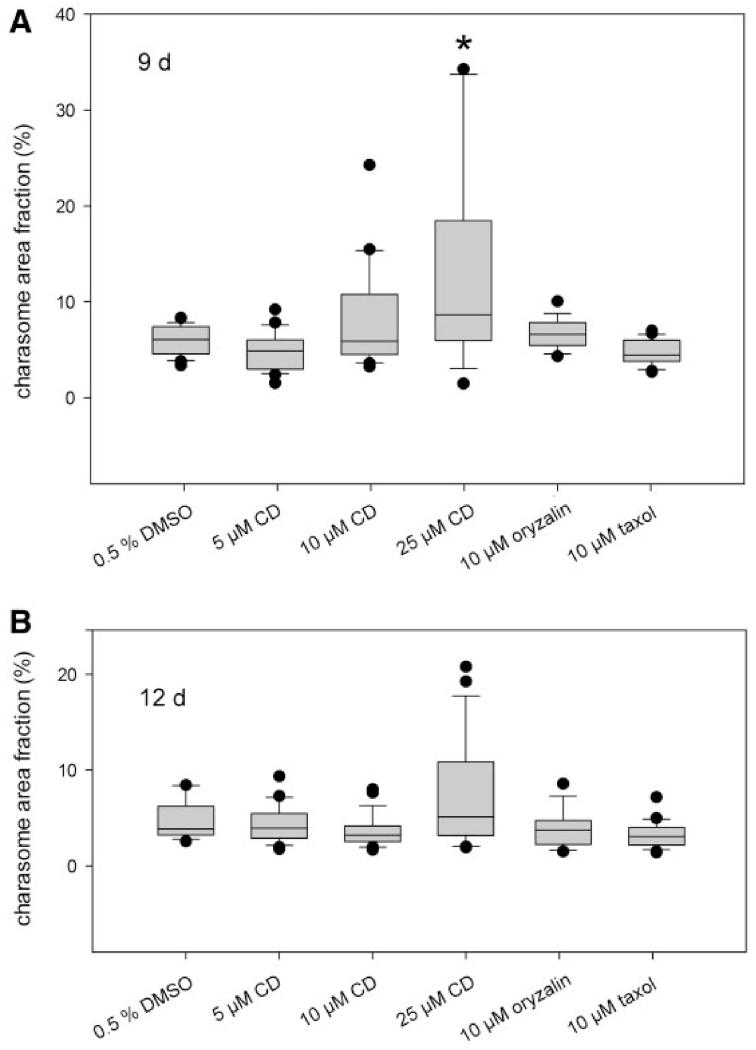
Finally, we wanted to know whether the cytoskeleton is required for charasome degradation which occurs when cells are no longer exposed to light. Therefore, cells with distinct alternating patterns of high and low charasome abundance (similar to that shown in Fig. 7B, C, J) were dark treated in the absence and presence of inhibitors of the microtubule (oryzalin and paclitaxel) and of the actin cytoskeleton (cytochalasin D). During an incubation period of 9 d the median values for maximum charasome area fractions in cells treated with the solvent only declined to about 5% (Fig. 11A), and charasome size and density were even along the whole surface of cells. This percentage was similar in cells treated with oryzalin (1 μM), paclitaxel (10 μM) and 1 and 10 μM cytochalasin D, concentrations which reduced but did not fully inhibit cytoplasmic streaming in the cells used for this study. Concentrations of cytochalasin D which completely arrested cytoplasmic streaming within 30 min (25 μM in this batch of culture) significantly delayed charasome degradation, as evident from the presence of small regions with rather high charasome densities (maximum charasome area fractions; Fig. 11A; Supplementary Fig. S7). Degradation of charasomes was not fully inhibited because maximum charasome area fractions were similar in control and treated cells after 12 d incubation (Fig. 11B). The inhibitory effect of cytochalasin D on the velocity of cytoplasmic streaming was fully reversible even at the highest concentrations used in this study, and control rates of cytoplasmic streaming were resumed after 1 d recovery in artificial fresh water (AFW) in darkness. Charasomes formed again when cells were subsequently exposed to light (data not shown).
Fig. 11.
Effect of cytoskeleton inhibitors on degradation of charasomes. Branchlet internodal cells of C. australis previously exposed to light for 8 d were dark treated for 9 (A) and 12 d (B), respectively. Maximum charasome area fractions were determined for each cell (n≥15). Shown are median values with upper and lower quartiles (boxes), whiskers indicating the 10th and 90th percentiles, and outliers (dots) with n≥9 for each plot. Charasome degradation is significantly delayed in cells treated with 25 μM cytochalasin D (CD) for 9 d (*P≤0.002, Mann–Whitney rank sum test).
Discussion
Are proteins for nucleation and anchoring of cytoskeletal proteins absent from the charasome cytoplasmic surface?
Plasma membrane domains are characterized by a specific composition of proteins, lipids and sterols or sterol-like substances (Malinsky et al. 2013). There is evidence that in the plasma membrane of characean cells a proteoglycan is responsible for establishing and maintaining the complex fine structure of charasomes (Pesacreta and Lucas 1984, Beljanski et al. 1995), but this substance has not been characterized so far. In previous studies, we found that proteins such as H+-ATPase and the RAB5-GTPase ARA6 are present at the smooth plasma membrane regions, and their accumulation at/in charasomes is obviously due to the surplus in plasma membrane area achieved by the tubular infoldings (Schmoelzer et al. 2011, Hoepflinger et al. 2013). This increased membrane area probably also accounts for the increase in signal after staining with fluorescent plasma membrane dyes such as FM dyes, NBD–sphingomyelin and the sterol-binding dye filipin (Schmoelzer et al. 2011).
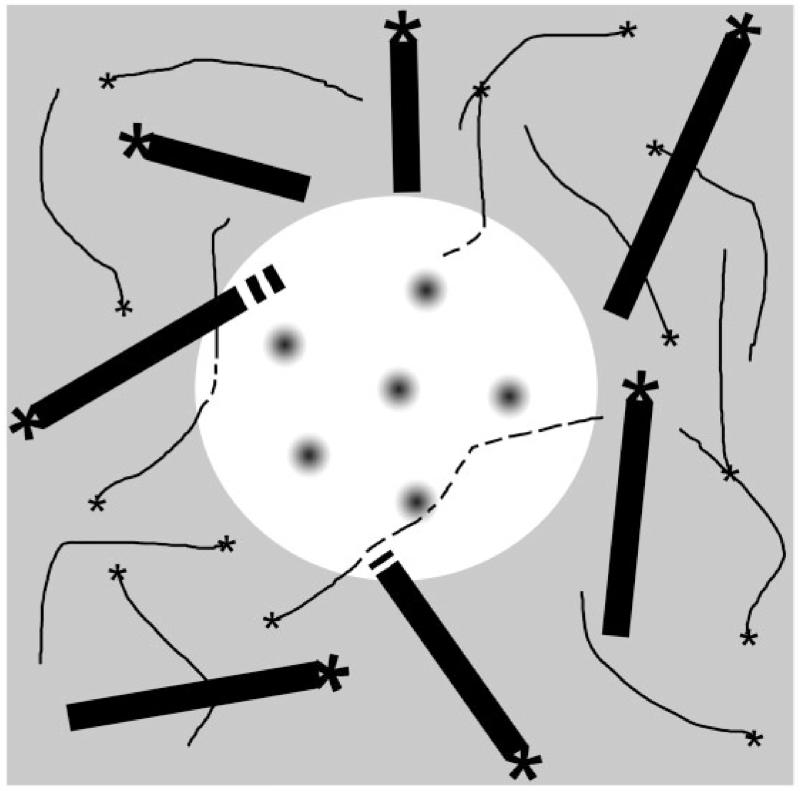
Plasma membrane domains in other cells are known to be enriched in cytoskeleton nucleating and anchoring proteins (e.g. Head et al. 2014). We were therefore interested in the relationship between charasomes and the cortical cytoskeleton in Chara internodal cells, and studied the distribution of cortical microtubules and actin filaments with respect to the distribution of charasomes. Unexpectedly, we found evidence that the inner cytoplasmic surface of charasomes differs from the smooth plasma membrane regions in the absence of cytoskeleton nucleating and anchoring complexes. Our data show that actin filaments and especially microtubules were significantly more abundant at smooth plasma membrane regions than at charasomes (Fig. 12). This differential distribution can be explained either by preferential growth of charasomes between cytoskeletal elements or by preferential nucleation and/or anchoring of cytoskeletal elements between charasomes. In comparison with the dynamic cytoskeleton, charasomes are long-lived stable structures. It is thus reasonable to assume that the charasome governs the distribution of actin filaments and microtubules and not vice versa. A possible explanation is that the charasome membrane facing the cytoplasm is largely devoid of proteins which are involved in the nucleation and/or anchoring of the cytoskeleton. This is consistent with electron micrographs showing that the few microtubules found along the charasome surface never approached the minimum distance of 5 nm assumed to be required for nucleation from or anchoring at the plasma membrane (Foissner and Wasteneys 1999). Steric conditions might additionally influence the orientation of actin filaments and, in particular, microtubules. Microtubules are rigid structures which bend upon touching an obstacle with the growing end (Allard et al. 2010). It is conceivable that the orientation of the growing end changes when it bumps into a charasome. This would explain the often bent shape of microtubules located between charasomes. We can also not exclude the possibility that cytoskeletal elements are not able to polymerize or that they disassemble at the charasome membrane as recently described in developing xylem cells where cortical microtubules are depolymerized in plasma membrane areas enriched in Rho GTPases (Oda and Fukuda 2012). Considering that charasomes acidify the external medium, the cytoplasm adjacent to charasomes may have a rather high pH avoided by microtubules and actin filaments. A high cytoplasmic pH in the subapical H+-extruding region of growing pollen tubes was demonstrated by Feijo et al. (1999) and correlates with the subcellular organization of the actin and microtubule cytoskeleton. Irrespective of how the depletion of microtubules and actin filaments is achieved, the charasome membrane facing the cytoplasm obviously has different properties from those of the much smaller lipid rafts which have been reported to be enriched in cytoskeleton nucleating protein complexes (e.g. Head et al. 2014).
Fig. 12.
Schematic view onto the cytoplasmic surface of a charasome (white) and the adjacent smooth plasma membrane (gray). Gray circles represent the openings of the charasome cytoplasmic surface into the labyrinth of charasome tubules. Black bars represent microtubules, and thin lines represent actin filaments; asterisks indicate putative microtubule and actin-nucleating centers. Broken lines indicate depolymerization of actin filaments and microtubules beneath the charasome.
Clathrin-dependent endocytosis only at smooth plasma membrane regions
In the first detailed description of charasome fine structure using chemically fixed cells, it has been documented that the cytoplasmic surface of mature charasomes is mostly free of coated pits, although coated pits are abundant at smooth plasma membrane regions (Pesacreta and Lucas 1984). Here we confirmed these findings by examining sections of cells which were high pressure frozen and cryosubstituted. The presence of coated pits and coated vesicles at smooth plasma membrane areas indicates that the plasma membrane between charasomes but not the charasome surface is involved in the formation of endocytic vesicles in mature cells, at least under conditions which do not favor the degradation of charasomes.
In this and in earlier studies we used fluorescent FM dyes for visualization of charasomes. FM dyes are widely used as endocytic markers (Bolte et al. 2004, Samaj 2006). In higher plant cells, FM dyes incorporate into the plasma membrane and co-localize with markers for different endosomal compartments before they are delivered to the vacuolar membranes via membrane trafficking (e.g. Samaj et al. 2006). Consequently, if cells are pulse-labeled the fluorescence of the plasma membrane becomes weaker until it disappears completely within a few hours or even less. Pulse-labeled charasomes, however, remain fluorescent for at least 24 h, and it has been suggested that this is due to a continuous recycling of FM-stained endosomes which transport the FM dye back to the plasma membrane (Klima and Foissner 2008). In view of the data presented here, it is more likely that the long-lasting FM fluorescence of charasomes is due to the absence of or strongly delayed endocytosis at these peculiar plasma membrane domains, at least when charasomes are not degraded. In this respect, the charasomes bear some similarities to eisosomes in yeast. Eisosomes are stable, furrow-like invaginations of the plasma membrane from which rapidly moving marker proteins are excluded and which are characterized by a reduced rate of endocytosis (e.g. Stradalova et al. 2009, Malinsky et al. 2010, Karotki et al. 2011).
Relative microtubule and actin filament length and density are independent of charasome area fraction
In the present study we found that relative microtubule length and relative actin filament length were independent of the charasome area fraction and, furthermore, that growth of charasomes was negatively correlated with the density of the cortical cytoskeleton. Microtubules and actin filaments were long and abundant in young internodal cells which had small charasomes, i.e. in cells with a small charasome area fraction. Older cells with shorter and less numerous microtubules and actin filaments had much larger charasomes which covered up to 45% of the cell surface at the acid regions.
In an earlier study, Wasteneys and Williamson (1992) reported that microtubule organization differed between acid and alkaline bands in internodal cells of the main axis of C. corallina nearing growth completion. Their images convincingly show that microtubules were longer and more abundant at acid bands, identified by the larger chloroplasts, than at alkaline bands. In the branchlet internodal cells of C. australis used during the course of this study, the density of cortical microtubules and actin filaments often varied considerably along the cell surface, but their distribution was dependent neither on the charasome area fraction nor on the density of cortical mitochondria (data not shown) which both reflect the pH banding pattern under steady-state conditions. It is possible that these divergent findings are due to differences between species or to differences between internodal cells of the main axis and branchlet internodal cells because it has been reported that the correlation between charasome density and the pH banding pattern in internodal cells of the main axis is less strict than in internodal cells of the branchlets (Bisson et al. 1991). It is also possible that these divergent findings reflect different growth conditions. On the other hand, no significant differences in microtubule number, orientation or dynamics between acid and alkaline bands were observed in internodal cells of Nitella flexilis, a species which does not form charasomes (Kropf et al. 1997). Clearly, more refined studies are required to decipher the relationship between the pH banding pattern and the organization of the cortical cytoskeleton. An important point that has to be clarified is whether local differences in external pH are echoed by local changes in the ionic composition of the cortical cytoplasm as demonstrated for pollen tubes (Feijo et al. 1999). Such differences would directly or indirectly affect the cytoarchitecture of the fragile cortical cytoskeleton, irrespective of whether charasomes are present or not.
Actin filaments but not microtubules are required for charasome growth and degradation
The results of the oryzalin and paclitaxel treatments clearly showed that functional microtubules are not required for charasome formation and confirmed earlier findings that microtubules are also not required for pH banding (Wasteneys and Williamson 1992). Charasome area fractions were similar to those of control cells after several days of treatment with 1 μM oryzalin, a concentration which caused the disassembly of microtubules within 30 min. An inhibitory effect on charasome development was only observed when internodes were treated with ≥10 μM oryzalin, concentrations which have been shown to produce unspecific damage (Langhans et al. 2009). The dispensability of microtubules for charasome formation is not surprising because charasomes increase in size during aging of internodal cells and at the same time the number and length of microtubules decrease. Obviously, microtubules are required in young, growing cells. They are a prerequisite for the correct orientation of cellulose fibrils prior to and during cell elongation (Green 1962) and they also play a role in the dynamics and shape of the endoplasmic reticulum (Foissner et al. 2009) and of cortical mitochondria (Foissner 2004) in early stages of morphogenesis. However, microtubules are unessential in mature internodes, consistent with the fact that cells are able to survive in 1 μM oryzalin for several months (authors’ own unpublished data). Microtubules are also not required for darkness-induced degradation of charasomes, which was affected neither by oryzalin-induced depolymerization nor by paclitaxel-induced stabilization of microtubules.
Interestingly, Bulychev et al. (2013) found that an incision-induced transient increase in apoplastic pH was suppressed by inhibitors of microtubules (oryzalin and taxol) and, to a lesser extent, by an actin inhibitor (cytochalasin B). These results indicate that different mechanisms are responsible for photosynthesis-dependent and injury-induced alkalinization, respectively.
In contrast to the dispensability of microtubules, disturbance of the actin cytoskeleton by cytochalasin D had a much greater impact on charasome formation and on charasome degradation. The cytochalasins are so far the only reliable drugs for interference with the actin cytoskeleton of characean cells, and cytochalasin D was found to be most suited for fast and reversible inhibition of actin-based motility (Foissner and Wasteneys 2007). In addition, we measured photosynthesis, a prerequisite for charasome formation and a sensitive indicator of the cell’s metabolism. Under the conditions applied during this study (whole-cell illumination; but see Bulychev and Dodonova 2011 for illumination of a small cell area), photosynthetic electron transport was not significantly different in cells treated with streaming-arresting concentrations of cytochalasin D as compared with dimethylsulfoxide (DMSO) controls, even after long-term treatment. This confirms the actin cytoskeleton as a specific target of cytochalasin and is consistent with the work of Lucas and Dainty (1977) who found that 14CO2 fixation was not inhibited by cytochalasin B. Assimilation of HCO3− which is more susceptible to cytochalasin B treatment (Lucas and Dainty 1977) is likely to play a less significant role in our studies because the acid pH of AFW used for the experiment favors the uptake of CO2.
Charasome growth occurs by exocytosis of vesicles which are likely to be derived from the Golgi bodies and/or the trans-Golgi network (Lucas and Franceschi 1981, Pesacreta and Lucas 1984). In mature Chara internodal cells, most Golgi bodies and trans-Golgi networks are located in the endoplasm. Charasome-forming vesicles therefore have to cross the stationary chloroplast layer before they can fuse with the plasma membrane. Transport of vesicles is most probably actin–myosin dependent and occurs along actin bundles which extend from the subcortex towards the cell periphery (Foissner and Wasteneys 2000). Consistent with this hypothesis, cytochalasin D inhibited growth of charasomes at concentrations which significantly delayed or arrested cytoplasmic streaming. Lower concentrations of cytochalasin D which do not arrest cytoplasmic mass streaming but which cause the reorganization of cortical actin into short, stiff rods (bundles) had no measurable effect on the growth of charasomes. We therefore hypothesize that the delicate actin filaments at the plasma membrane are not directly involved in exocytosis of charasome-forming vesicles.
Darkness-induced charasome degradation probably occurs via endocytosis. In the presence of cytochalasin D at concentrations which arrested cytoplasmic streaming. small islands with high charasome area fractions remained within large areas where charasomes were scarce and small (Supplementary Fig. S7). Charasome degradation thus was significantly delayed by cytochalasin D but not fully inhibited. This is in line with our findings about the absence of actin filaments at the cytoplasmic surface of charasomes and with earlier observations that endocytosis (or at least internalization of FM dyes) in characean internodal cells can occur in the absence of a functional actin–myosin cytoskeleton (Klima and Foissner 2008).
Taken together, our findings suggest that the actin cytoskeleton is required for charasome formation and that it facilitates their degradation via trafficking of charasome-forming and endocytic vesicles. The actin cytoskeleton could thus have an important role in the adaptation of the internodal cell to various light intensities by altering the size and abundance of charasomes, if necessary, or in the maintenance of the charasome pattern under steady light conditions.
Materials and Methods
Algal material, culture conditions and inhibitor treatments
Thalli of C. australis and C. braunii were grown in a substrate of soil, peat and sand in 10–50 liter aquaria filled with distilled water. The temperature was about 20°C, and fluorescent lamps provided a 16/8 h light/dark cycle. The light intensity was low (about 5 μE m−2 s−1) in order to prevent calcification and growth of epiphytes. After several weeks growth, fragments of thalli were isolated from the main axis with a small pair of scissors and left in AFW (10−3 M NaCl, 10−4 M KCl, 10−4 M CaCl2) until use.
Oryzalin (Riedel-de Haen) and paclitaxel (Sigma) were used to disassemble and to stabilize the microtubules, respectively. Cytochalasin D (Sigma) was used to perturb the actin cytoskeleton. Stock solutions of the inhibitors were prepared with DMSO at a concentration of 10 μM each and were further diluted with AFW. Controls contained the corresponding amounts of the solvent.
The velocity of cytoplasmic streaming was measured on video images taken with a ×20 objective lens. The movement of at least eight structures (organelles) in the bulk streaming mass was analyzed per cell, and the highest five values were averaged.
In vivo staining and perfusion of internodal cells
The pH banding pattern of internodal cells was documented using phenol red (phenolsulfonphthalein; Sigma) at a concentration of 10 mM dissolved in AFW. Phenol red changes color from yellow to pink depending on the pH of the medium (the visible transition interval is between pH 6.8 and pH 8.2; Spear et al. 1969).
For in vivo staining of charasomes, internodal cells were pulse labeled for 5 min with 10 μM green fluorescent FM1-43FX {N-(3-triethylammoniumpropyl)-4-[4-(dibutylamino)styryl]pyridinium dibromide} or with 10 μM red fluorescent FM4-64 {N-(3-triethylammoniumpropyl)-4-[6-(4-(diethylamino) phenyl)hexatrienyl]pyridinium dibromide}; both from Invitrogen. These two plasma membrane dyes and endocytic markers were diluted from a 500 μM stock solution in distilled water. Mitochondria were fluorescently labeled by 30 min incubation in 1 μM Mitotracker Orange CMTM Ros (Invitrogen) diluted from a 1 mM stock solution in DMSO. All dyes were diluted in AFW.
Perfusion of internodal cells, as described by Williamson et al. (1989), was used to visualize the cytoskeleton. Briefly, an internodal cell was placed on the bottom of a perfusion chamber and pressed lightly into vacuum grease lines positioned several millimeters away from the cell ends. Small reservoirs with grooves were carefully placed over the grease lines and pressed down firmly without damaging the cells. The central portion of the cell between the reservoirs was then covered with silicon fluid (Wacker) in order to prevent desiccation. The ends of the cells within the reservoirs were bathed in isotonic perfusion solution: 200 mM sucrose, 70 mM KCl, 4.5 mM MgCl2, 5 mM EGTA, 1.48 mM CaCl2, 10 mM PIPES (pH 7.0 for actin and pH 6.2 for microtubules). Following reduction of turgor, cells were cut with small scissors and a small difference in solution levels between the two reservoirs ensured a gentle flow of perfusion solution through the cell. This treatment removed the cell sap and most of the endoplasm, and washed out actin and tubulin monomers which could otherwise polymerize during the subsequent staining step. After about 5 min, the perfusion solution was replaced with perfusion solution containing fluorescent stains. Actin filaments were visualized by 0.32 μM Alexa Fluor 488 phalloidin (Invitrogen) diluted from a 6.6 μM stock solution in methanol, and microtubules were stained with 2 μM paclitaxel, Oregon Green 488 conjugate (Invitrogen) diluted from a 1 mM stock solution in DMSO and freshly prepared from frozen aliquots. Unspecific staining of mitochondria and endoplasmic reticulum by fluorescent paclitaxel was reduced by lowering the temperature of the staining solution to about 4°C.
Immunofluorescence
Fixation and staining protocols for indirect immunofluorescence were as described by Schmoelzer et al. (2011). For co-localization of microtubules with charasomes, cells were stained with FM1-43 FX for 5 min prior to fixation with 1% (v/v) glutaraldehyde in phosphate-buffered saline (PBS; 140 mM NaCl, 2.95 mM KCl, 2.38 mM KH2PO4, 7.61 mM Na2HPO4, 18.5 mM NaN3; pH 6.9) for 30 min at room temperature. Cells were dissected with a small pair of scissors and fragments were further treated as follows: 15 min wash with PBS, 3 × 15 min wash with PBS, 30 min treatment with 1 mg ml−1 NaBH4 in PBS, 3 × 15 min wash with PBS, 30 min blocking with 1% (w/v) bovine serum albumin (BSA) and 50 mM glycine in PBS, 2 h incubation with primary antibody anti-tyrosine tubulin, Clone TUB-1A2 (T 9028, Sigma) diluted 1: 800 in 1% (w/v) BSA and 50 mM glycine in PBS, 3 × 30 min wash with PBS, overnight incubation at 4°C with secondary antibody anti-mouse IgG conjugated to CY3 (C 2181, Sigma) diluted 1: 100 in 1% (w/v) BSA and 50 mM glycine in PBS, 3 × 30 min wash with PBS. After the final wash, cell fragments were mounted in PBS/glycerol 1: 1.
Confocal laser scanning microscopy and statistical analysis
The confocal laser scanning microscopes used in this study were a Leica TCS SP5 coupled to a DMI 6000B inverted microscope and a Zeiss LSM 510 coupled to a Zeiss Axiovert inverted microscope. All images included in this study are single optical sections and are positioned with vertical sides parallel to the long axes of the cells. For comparison of the distribution of microtubules or actin filaments with that of charasomes, Z-stacks of the cortical cytoplasm were taken using a ×40 water immersion objective with a numerical aperture of 1.2 or a ×63 oil immersion objective with a numerical aperture of 1.4. Usually, single optical sections with a thickness of 1.2 μm were sufficient for the analysis of the cytoskeleton at the cytoplasmic surface of the charasomes and the adjacent smooth plasma membrane areas. If charasomes were thicker than 1.2 μm, a projection of two optical sections was necessary to visualize all cytoskeletal elements in the peripheral cell cortex. Statistical analysis was performed using Image J (http://imagej.nih.gov/ij) and SigmaPlot (Systat Software).
Electron microscopy
Chemical fixation of branchlet internodal cells of C. australis was as described in Foissner (1991). Briefly, cells were fixed for 30 min at room temperature in 1% glutaraldehyde dissolved in phosphate buffer, pH 6.8. Following several washes in buffer, cells were post-fixed overnight at 4°C in 2% OsO4 dissolved in buffer. After dehydration in an ethanol series at 4°C, cells were embedded in Agar low viscosity resin (Agar Scientific). Lateral internodal cells of C. braunii were cryofixed in a LeicaEMPACT high pressure freezer (Leica Microsystems), freeze-substituted in a Leica EM AFS freeze-substitution apparatus and embedded in LR Gold Resin (London Resin Co.). Micrographs of ultrathin sections were taken at elastic bright-field mode with a LEO 912 transmission electron microscope equipped with in-column energy filter (Zeiss).
Chl fluorescence measurements
Photosynthetic activity was measured as described in Bulychev et al. (2001a). Three or four groups of internodal cells were kept in darkness for 7 d and then incubated under dim light (about 10 μE m−2 s−1 during the daytime) for 7 d in AFW supplemented with inhibitor. Untreated cells were kept in AFW-containing solvent only.
Supplementary Material
Acknowledgments
The authors are grateful to Raimund Tenhaken (University of Salzburg) for support and valuable discussion.
Funding
This research was funded by the Austrian Science Fund [project Nos. P 22957-B20 and P 27536-B16 to I.F.].
Abbreviations
- AFW
artificial fresh water
- BSA
bovine serum albumin
- DMSO
dimethylsulfoxide
- PBS
phosphate-buffered saline
Footnotes
Disclosures
The authors have no conflicts of interest to declare.
Supplementary data
Supplementary data are available at PCP online.
References
- Allard JF, Ambrose JC, Wasteneys GO, Cytrynbaum EN. A mechanochemical model explains interactions between cortical microtubules in plants. Biophys. J. 2010;99:1082–1090. doi: 10.1016/j.bpj.2010.05.037. [DOI] [PMC free article] [PubMed] [Google Scholar]
- Beljanski M, Zihnija H, Andjus PR. Evidence for the presence of the plasma membrane coat in the membrane fraction isolated from Chara gymnophylla. Plant Sci. 1995;110:121–126. [Google Scholar]
- Bisson MA, Walker NA. The Chara plasmalemma at high pH Electrical measurements show rapid specific passive uniport. J. Membr. Biol. 1980;56:1–7. [Google Scholar]
- Bisson MA, Siegel A, Chau R, Gelsomino SA, Herdic SL. Distribution of charasomes in Chara—banding-pattern and effect of photosynthetic inhibitors. Austr. J. Plant Physiol. 1991;18:81–93. [Google Scholar]
- Bolte S, Talbot C, Boutte Y, Catrice O, Read ND, Satiat-Jeunemaitre A. FM-dyes as experimental probes for dissecting vesicle trafficking in living plant cells. J. Microsc. 2004;214:159–173. doi: 10.1111/j.0022-2720.2004.01348.x. [DOI] [PubMed] [Google Scholar]
- Boutte Y, Moreau P. Plasma membrane partitioning: from macro-domains to new views on plasmodesmata. Front. Plant. Sci. 2014;5 doi: 10.3389/fpls.2014.00128. article no. 128. [DOI] [PMC free article] [PubMed] [Google Scholar]
- Bulychev AA, Alova AV, Bibikova TN. Strong alkalinization of Chara cell surface in the area of cell wall incision as an early event in mechanoperception. Biochim. Biophys. Acta. 2013;1828:2359–2369. doi: 10.1016/j.bbamem.2013.07.002. [DOI] [PubMed] [Google Scholar]
- Bulychev AA, Cherkashin AA, Vredenberg WJ, Rubin AB, Zykov VS, Muller SC. Fluorescence and photosynthetic activity of chloroplasts in acid and alkaline zones of Chara corallina. Russ. J. Plant Physiol. 2001a;48:326–332. doi: 10.1016/s0302-4598(01)00096-4. [DOI] [PubMed] [Google Scholar]
- Bulychev AA, Dodonova SO. Effects of cyclosis on chloroplast–cytoplasm interactions revealed with localized lighting in characean cells at rest and after electrical excitation. Biochim. Biophys. Acta. 2011;1807:1221–1230. doi: 10.1016/j.bbabio.2011.06.009. [DOI] [PubMed] [Google Scholar]
- Bulychev AA, Polezhaev AA, Zykov SV, Pljusnina TY, Riznichenko GY, Rubin AB, et al. Light-triggered pH banding profile in Chara cells revealed with a scanning pH microprobe and its relation to self-organization phenomena. J. Theor. Biol. 2001b;212:275–294. doi: 10.1006/jtbi.2001.2375. [DOI] [PubMed] [Google Scholar]
- Chau R, Bisson MA, Siegel A, Elkin G, Klim P, Straubinger RM. Distribution of charasomes in Chara: reestablishment and loss in darkness and correlation with banding and inorganic carbon uptake. Austr. J. Plant. Physiol. 1994;21:113–123. [Google Scholar]
- de Curtis I, Meldolesi J. Cell surface dynamics—how Rho GTPases orchestrate the interplay between the plasma membrane and the cortical cytoskeleton. J. Cell Sci. 2012;125:4435–4444. doi: 10.1242/jcs.108266. [DOI] [PubMed] [Google Scholar]
- Feijo JA, Sainhas J, Hackett GR, Kunkel JG, Hepler PK. Growing pollen tubes possess a constitutive alkaline band in the clear zone and a growth-dependent acidic tip. J. Cell Biol. 1999;144:483–496. doi: 10.1083/jcb.144.3.483. [DOI] [PMC free article] [PubMed] [Google Scholar]
- Foissner I. Induction of exocytosis in characean internodal cells by locally restricted application of chlortetracycline and the effect of cytochalasin B, depolarizing and hyperpolarizing agents. Plant Cell Environ. 1991;14:907–915. [Google Scholar]
- Foissner I. Microfilaments and microtubules control the shape, motility, and subcellular distribution of cortical mitochondria in characean internodal cells. Protoplasma. 2004;224:145–157. doi: 10.1007/s00709-004-0075-1. [DOI] [PubMed] [Google Scholar]
- Foissner I, Menzel D, Wasteneys GO. Microtubule-dependent motility and orientation of the cortical endoplasmic reticulum in elongating characean internodal cells. Cell Motil. Cytoskel. 2009;66:142–155. doi: 10.1002/cm.20337. [DOI] [PubMed] [Google Scholar]
- Foissner I, Wasteneys GO. A cytochalasin-sensitive actin filament meshwork is a prerequisite for local wound wall deposition in Nitella internodal cells. Protoplasma. 1997a;200:17–30. [Google Scholar]
- Foissner I, Wasteneys GO. Taxol stabilizes microtubules in characean internodal cells but does not prevent their disassembly at wound sites. Cell Biol. Int. 1997b;21:866–868. [Google Scholar]
- Foissner I, Wasteneys GO. Microtubules at wound sites of Nitella internodal cells passively co-align with actin bundles when exposed to hydrodynamic forces generated by cytoplasmic streaming. Planta. 1999;208:480–490. [Google Scholar]
- Foissner I, Wasteneys GO. Actin in characean internodal cells. In: Staiger C, Baluska DF, Volkmann D, Barlow P, editors. Actin: A Dynamic Framework for Multiple Plant Cell Functions. Kluwer Academic Publisher; Dordrecht: 2000. pp. 259–274. [Google Scholar]
- Foissner I, Wasteneys GO. Wide-ranging effects of eight cytochalasins and latrunculin A and B on intracellular motility and actin filament reorganization in characean internodal cells. Plant Cell Physiol. 2007;48:585–597. doi: 10.1093/pcp/pcm030. [DOI] [PubMed] [Google Scholar]
- Franceschi VR, Lucas WJ. Structure and possible function(s) of charasomes; complex plasmalemma–cell wall elaborations present in some characean species. Protoplasma. 1980;104:253–271. [Google Scholar]
- Green PB. Mechanism for plant cellular morphogenesis. Science. 1962;138:1404–1405. doi: 10.1126/science.138.3548.1404. [DOI] [PubMed] [Google Scholar]
- Gunning BES, Pate JS. ‘Transfer cells’: plant cells with wall ingrowths, specialized in relation to short distance transport of solutes—their occurrence, structure, and development. Protoplasma. 1969;68:107–133. [Google Scholar]
- Head BP, Patel HH, Insel PA. Interaction of membrane/lipid rafts with the cytoskeleton: impact on signaling and function: membrane/lipid rafts, mediators of cytoskeletal arrangement and cell signaling. Biochim. Biophys. Acta. 2014;1838:532–545. doi: 10.1016/j.bbamem.2013.07.018. [DOI] [PMC free article] [PubMed] [Google Scholar]
- Hoepflinger MC, Geretschlaeger A, Sommer A, Hoeftberger M, Nishiyama T, Sakayama H, et al. Molecular and biochemical analysis of the first ARA6 homologue, a RAB5 GTPase, from green algae. J. Exp. Bot. 2013;64:5553–5568. doi: 10.1093/jxb/ert322. [DOI] [PMC free article] [PubMed] [Google Scholar]
- Jarsch IK, Konrad SSA, Stratil TF, Urbanus SL, Szymanski W, Braun P, et al. Plasma membranes are subcompartmentalized into a plethora of coexisting and diverse microdomains in Arabidopsis and Nicotiana benthamiana. Plant Cell. 2014;26:1698–1711. doi: 10.1105/tpc.114.124446. [DOI] [PMC free article] [PubMed] [Google Scholar]
- Karotki L, Huiskonen JT, Stefan CJ, Ziólkowska NE, Roth R, Surma MA, et al. Eisosome proteins assemble into a membrane scaffold. J. Cell Biol. 2011;195:889–902. doi: 10.1083/jcb.201104040. [DOI] [PMC free article] [PubMed] [Google Scholar]
- Klima A, Foissner I. FM dyes label sterol-rich plasma membrane domains and are internalized independently of the cytoskeleton in characean internodal cells. Plant Cell Physiol. 2008;49:1508–1521. doi: 10.1093/pcp/pcn122. [DOI] [PubMed] [Google Scholar]
- Kropf DL, Williamson RE, Wasteneys GO. Microtubule orientation and dynamics in elongating characean internodal cells following cytosolic acidification, induction of pH bands, or premature growth arrest. Protoplasma. 1997;197:188–198. [Google Scholar]
- Lange K. Fundamental role of microvilli in the main functions of differentiated cells: outline of an universal regulating and signaling system at the cell periphery. J. Cell Physiol. 2011;226:896–927. doi: 10.1002/jcp.22302. [DOI] [PubMed] [Google Scholar]
- Langhans M, Niemes S, Pimpl P, Robinson DG. Oryzalin bodies: in addition to its anti-microtubule properties, the dinitroaniline herbicide oryzalin causes nodulation of the endoplasmic reticulum. Protoplasma. 2009;236:73–84. doi: 10.1007/s00709-009-0059-2. [DOI] [PubMed] [Google Scholar]
- Ligrone R, Vaughn KC, Rascio N. A cytochemical and immunocytochemical analysis of the wall labyrinth apparatus in leaf transfer cells in Elodea canadensis. Ann. Bot. 2011;107:717–722. doi: 10.1093/aob/mcr010. [DOI] [PMC free article] [PubMed] [Google Scholar]
- Lucas WJ, Dainty J. Spatial distribution of functional OH− carriers along a characean internodal cell: determined by the effect of cytochalasin B on H14CO3 assimilation. J. Membr. Biol. 1977;32:75–94. doi: 10.1007/BF01905210. [DOI] [PubMed] [Google Scholar]
- Lucas WJ, Franceschi VR. Characean charasome-complex and plasmalemma vesicle development. Protoplasma. 1981;107:255–267. [Google Scholar]
- Malinsky J, Opekarová M, Grossmann G, Tanner W. Membrane microdomains, rafts, and detergent-resistant membranes in plants and fungi. Annu. Rev. Plant Biol. 2013;64:501–529. doi: 10.1146/annurev-arplant-050312-120103. [DOI] [PubMed] [Google Scholar]
- Malinsky J, Opekarova M, Tanner W. The lateral compartmentation of the yeast plasma membrane. Yeast. 2010;27:473–478. doi: 10.1002/yea.1772. [DOI] [PubMed] [Google Scholar]
- McKenna JF, Tolmie AF, Runions J. Across the great divide: the plant cell surface continuum. Curr. Opin. Plant Biol. 2014;22:132–140. doi: 10.1016/j.pbi.2014.11.004. [DOI] [PubMed] [Google Scholar]
- Mongrand S, Stanislas T, Bayer EMF, Lherminier J, Simon-Plas F. Membrane rafts in plant cells. Trends Plant Sci. 2010;15:656–663. doi: 10.1016/j.tplants.2010.09.003. [DOI] [PubMed] [Google Scholar]
- Murata T, Sonobe S, Baskin TI, Hyodo S, Hasezawa S, Nagata T, et al. Microtubule-dependent microtubule nucleation based on recruitment of gamma-tubulin in higher plants. Nat. Cell Biol. 2005;7:961–968. doi: 10.1038/ncb1306. [DOI] [PubMed] [Google Scholar]
- Nakamura M, Ehrhardt DW, Hashimoto T. Microtubule and katanin-dependent dynamics of microtubule nucleation complexes in the acentrosomal Arabidopsis cortical array. Nat. Cell Biol. 2010;12:1064–1070. doi: 10.1038/ncb2110. [DOI] [PubMed] [Google Scholar]
- Oda Y, Fukuda H. Initiation of cell wall pattern by a Rho- and microtubule-driven symmetry breaking. Science. 2012;337:1333–1336. doi: 10.1126/science.1222597. [DOI] [PubMed] [Google Scholar]
- Oda Y, Fukuda H. The dynamic interplay of plasma membrane domains and cortical microtubules in secondary cell wall patterning. Front. Plant Sci. 2013a;4:511–511. doi: 10.3389/fpls.2013.00511. [DOI] [PMC free article] [PubMed] [Google Scholar]
- Oda Y, Fukuda H. Spatial organization of xylem cell walls by ROP GTPases and microtubule-associated proteins. Curr. Opin. Plant Biol. 2013b;16:743–748. doi: 10.1016/j.pbi.2013.10.010. [DOI] [PubMed] [Google Scholar]
- Offler CE, McCurdy DW, Patrick JW, Talbot MJ. Transfer cells: cells specialized for a special purpose. Annu. Rev. Plant Biol. 2003;54:431–454. doi: 10.1146/annurev.arplant.54.031902.134812. [DOI] [PubMed] [Google Scholar]
- Pesacreta TC, Lucas WJ. Plasma-membrane coat and a coated vesicle-associated reticulum of membranes—their structure and possible interrelationship in Chara corallina. J. Cell Biol. 1984;98:1537–1545. doi: 10.1083/jcb.98.4.1537. [DOI] [PMC free article] [PubMed] [Google Scholar]
- Price GD, Badger MR, Bassett ME, Whitecross MI. Involvement of plasmalemmasomes and carbonic anhydrase in photosynthetic utilization of bicarbonate in Chara corallina. Austr. J. Plant Physiol. 1985;12:241–256. [Google Scholar]
- Price GD, Whitecross MI. Cytochemical localization of ATPase activity on the plasmalemma of Chara corallina. Protoplasma. 1983;116:65–74. [Google Scholar]
- Prins HBA, Snel JFH, Zanstra PE, Helder RJ. The mechanism of bicarbonate assimilation by the polar leaves of Potamogeton and Elodea. CO2 concentrations at the leaf surface. Plant Cell Environ. 1982;5:207–214. [Google Scholar]
- Roppolo D, De Rybel B, Tendon VD, Pfister A, Alassimone J, Vermeer JEM, et al. A novel protein family mediates Casparian strip formation in the endodermis. Nature. 2011;473:380–383. doi: 10.1038/nature10070. [DOI] [PubMed] [Google Scholar]
- Sainsbury F, Collings DA, Mackun K, Gardiner J, Harper JDI, Marc J. Developmental reorientation of transverse cortical microtubules to longitudinal directions: a role for actomyosin-based streaming and partial microtubule–membrane detachment. Plant J. 2008;56:116–131. doi: 10.1111/j.1365-313X.2008.03574.x. [DOI] [PubMed] [Google Scholar]
- Samaj J. Methods and molecular tools for studying endoytosis in plants—an overview. In: Samaj J, Baluska DF, Menzel D, editors. Plant Endocytosis. Springer; Berlin: 2006. pp. 1–18. [Google Scholar]
- Samaj J, Baluska DF, Menzel D. Plant Endocytosis. Springer; Berlin: 2006. [Google Scholar]
- Schmoelzer PM, Hoeftberger M, Foissner I. Plasma membrane domains participate in pH banding of Chara internodal cells. Plant Cell Physiol. 2011;52:1274–1288. doi: 10.1093/pcp/pcr074. [DOI] [PMC free article] [PubMed] [Google Scholar]
- Shimmen T. The sliding theory of cytoplasmic streaming: fifty years of progress. J. Plant Res. 2007;120:31–43. doi: 10.1007/s10265-006-0061-0. [DOI] [PubMed] [Google Scholar]
- Sonnino S, Prinetti A. Membrane domains and the ‘lipid raft’ concept. Curr. Med. Chem. 2013;20:4–21. [PubMed] [Google Scholar]
- Spear DG, Barr JK, Barr CE. Localization of hydrogen ion and chloride ion fluxes in Nitella. J. Gen. Physiol. 1969;54:397–414. doi: 10.1085/jgp.54.3.397. [DOI] [PMC free article] [PubMed] [Google Scholar]
- Stradalova V, Stahlschmidt W, Grossmann G, Blazikova M, Rachel R, Tanner W, et al. Furrow-like invaginations of the yeast plasma membrane correspond to membrane compartment of Can1. J. Cell Sci. 2009;122:2887–2894. doi: 10.1242/jcs.051227. [DOI] [PubMed] [Google Scholar]
- van Gisbergen PA, Bezanilla M. Plant formins: membrane anchors for actin polymerization. Trends Cell Biol. 2013;23:227–233. doi: 10.1016/j.tcb.2012.12.001. [DOI] [PubMed] [Google Scholar]
- Wasteneys GO, Collings DA, Gunning BES, Hepler PK, Menzel D. Actin in living and fixed characean internodal cells: identification of a cortical array of fine actin strands and chloroplast actin rings. Protoplasma. 1996;190:25–38. [Google Scholar]
- Wasteneys GO, Williamson RE. Microtubule orientation in developing internodal cells of Nitella—a quantitative analysis. Eur. J. Cell Biol. 1987;43:14–22. [Google Scholar]
- Wasteneys GO, Williamson RE. Microtubule organization differs between acid and alkaline bands in internodal cells of Chara but bands can develop in the absence of microtubules. Planta. 1992;188:99–105. doi: 10.1007/BF00198945. [DOI] [PubMed] [Google Scholar]
- Williamson RE, Grolig F, Hurley UA, Jablonski PP, McCurdy DW, Wasteneys GO. Methods for studying the plant cytoskeleton. In: Linskens HF, Jackson JF, editors. Modern Methods of Plant Analysis New Series. Vol. 10. Springer; Berlin: 1989. pp. 203–218. Plant Fibers. [Google Scholar]
Associated Data
This section collects any data citations, data availability statements, or supplementary materials included in this article.


