

Total plasma cell-free deoxyribonucleic acid (cfDNA) is not a highly specific predictive biomarker for response to systemic therapy in patients with advanced non-small-cell lung cancers. Future efforts should be directed at tumor-specific genomic alterations in cfDNA which are now being investigated as noninvasive ‘liquid biopsies’ to improve personalized cancer therapy.
Keywords: plasma cell-free DNA, non-small-cell lung cancer, chemotherapy, biomarker
Abstract
Background
While previous studies have reported on the prognostic value of total plasma cell-free deoxyribonucleic acid (cfDNA) in lung cancers, few have prospectively evaluated its predictive value for systemic therapy response.
Patients and methods
We conducted a prospective study to evaluate the association between changes in total cfDNA and radiologic response to systemic therapy in patients with stage IIIB/IV non-small-cell lung cancers (NSCLCs). Paired blood collections for cfDNA and computed tomography (CT) assessments by RECIST v1.0 were performed at baseline and 6–12 weeks after therapy initiation. Total cfDNA levels were measured in plasma using quantitative real-time polymerase chain reaction. Associations between changes in cfDNA and radiologic response, progression-free survival (PFS), and overall survival (OS) were measured using Kruskal–Wallis and Kaplan–Meier estimates.
Results
A total of 103 patients completed paired cfDNA and CT response assessments. Systemic therapy administered included cytotoxic chemotherapy in 57% (59/103), molecularly targeted therapy in 17% (17/103), and combination therapy in 26% (27/103). Median change in cfDNA from baseline to response assessment did not significantly differ by radiologic response categories of progression of disease, stable disease and partial response (P = 0.10). However, using radiologic response as continuous variable, there was a weak positive correlation between change in radiologic response and change in cfDNA (Spearman's correlation coefficient 0.21, P = 0.03). Baseline cfDNA levels were not associated with PFS [hazard ratio (HR) = 1.06, 95% confidence interval (CI) 0.93–1.20, P = 0.41] or OS (HR = 1.04, 95% CI 0.93–1.17, P = 0.51), neither were changes in cfDNA.
Conclusions
In this large prospective study, changes in total cfDNA over time did not significantly predict radiologic response from systemic therapy in patients with advanced NSCLC. Pretreatment levels of total cfDNA were not prognostic of survival. Total cfDNA level is not a highly specific predictive biomarker and future investigations in cfDNA should focus on tumor-specific genomic alterations using expanded capabilities of next-generation sequencing.
introduction
Circulating cell-free deoxyribonucleic acid (cfDNA) has been studied as a potential biomarker in cancer patients for over 30 years [1]. Compared with normal controls, higher levels of cfDNA are observed in cancer patients due to a variety of mechanisms including tumor cell necrosis, apoptosis, and macrophage digestion with resultant release of tumor DNA fragments into the circulation [2–4], potentially reflective of total underlying tumor burden [5]. Research interests in cfDNA as a cancer biomarker have rapidly increased in recent years, owing to recent advances in molecular technology to detect tumor cfDNA at very low concentrations and the growing need for noninvasive blood biomarkers to guide personalized cancer treatments [5–7].
Studies on total cfDNA in lung cancers over the past decade have largely focused on its diagnostic and prognostic values [8–19]. Only three studies examined the predictive value of total cfDNA for response to chemotherapy as a means of treatment monitoring [11, 20, 21]. Due to their mixed results, independent validation by a large prospective study has been called upon by the previous investigators [11, 20]. As total cfDNA was thought to be potentially reflective of underlying tumor burden, and given its short half-life of ∼16 min [22], we hypothesized that it may be used clinically as a predictive biomarker to monitor response to systemic therapy over time. We conducted a prospective biomarker study to determine whether changes in total plasma cfDNA over time have predictive value for radiologic response on computed tomography (CT).
patients and methods
study design and patients
We conducted a prospective, Institutional Review Board approved biomarker protocol at Memorial Sloan-Kettering Cancer Center (MSKCC IRB #02-111) with the primary objective of evaluating the predictive value of changes in plasma cfDNA for response to systemic therapy in patients with advanced non-small-cell lung cancer (NSCLC). Secondary objectives included evaluating the predictive and prognostic values of baseline cfDNA and changes in cfDNA for progression-free (PFS) and overall survival (OS).
Eligible patients had pathologically confirmed stage IIIB or IV NSCLC, measurable disease per Response Evaluation Criteria In Solid Tumors version 1.0 (RECIST v1.0), a Karnofsky performance status of 70% or greater scheduled and were scheduled to begin systemic therapy.
Given our hypothesis that changes in cfDNA would correlate with total tumor burden regardless of the type of systemic agents used, there were no restrictions on the choice of systemic therapy for the overall analysis. These included platinum and nonplatinum-based chemotherapy, bevacizumab and/or tyrosine kinase inhibitors as commonly administered in clinical practice. Patients undergoing radiotherapy, vaccines, or immunomodulatory agents were excluded.
CT scans were used for response assessments by RECIST v1.0. CT scans were performed at baseline and 6–12 weeks after initiation, then repeated every 6–12 weeks. Patients were followed for PFS and OS analysis. Paired blood collections were done at baseline within 4 weeks of baseline CT, and at first response assessment within 3 weeks of the first follow-up CT.
plasma cfDNA collection, measurement and storage
Blood was collected in CPT™ tubes containing sodium citrate gel, Ficoll-Hypaque density fluid, and a polyester gel barrier, kept on ice, and processed within 1 h of collection. Tubes were spun at 1650 relative centrifugal force for 20 min at room temperature. Plasma was removed without disturbing the mononuclear cell layer, transferred to cryovials labeled with an anonymous code, and frozen at −80°C. Plasma was shipped in batches on dry ice to laboratory collaborators at the University of Southern California for measurement of cfDNA. DNA was isolated through digestion, extraction, and precipitation using similar methods described by Kawakami et al. [23]. For each specimen, 2 ml of plasma plus 1 µl of Salmon Sperm DNA (10 mg/ml, Life Technologies, Inc., Gaithersburg, MD) were digested at 59°C with an equal volume of 1% sodium dodecyl sulfate containing a 50-µl aliquot of proteinase K (Life Technologies, Inc., Rockville, MD). Wizard DNA purification resin (Promega Corp., Madison, WI) was used with elution volume of 40 µl. Precipitation was performed at −20°C for 60 min, and the extracted DNA measured using quantitative PCR of the β-actin gene performed in triplicates [9].
statistical analysis
The primary end point of the study was the association between changes in cfDNA and radiologic response to systemic therapy. Radiologic response was quantified by sum of longest diameter of measurable target lesions (SLD) by RECIST v1.0. Percent changes in total cfDNA levels from baseline to first follow-up measurement were evaluated for association with standard RECIST v1.0 response categories progression of disease (POD), stable disease (SD), and partial response (PR). Group differences were assessed using Kruskal–Wallis tests. In addition, given the heterogeneity of tumor growth and regression within SD, changes in cfDNA were correlated with radiologic response as continuous variables, using Spearman's rank correlation coefficient. We also analyzed this correlation within subgroups based on the type of therapy patients received, including cytotoxic chemotherapy alone and others such as molecularly targeted agents or antiangiogenic agents which may have cytostatic properties or theoretically alter the release of cfDNA.
Secondary end points included any associations between baseline cfDNA or changes in cfDNA with PFS and OS in patients previously untreated for advanced NSCLC. For OS, patients were followed until the date of death from any cause. For PFS, patients were followed until the date of radiologic disease progression or death. Patients who experienced radiologic progression at the time of first follow-up scan were excluded from analysis evaluating association of percent change in cfDNA and PFS. Patients who did not experience the event of interest by the end of the study were censored at the time of the last available follow-up. The association of PFS and OS with baseline cfDNA and percent change in cfDNA were analyzed by Cox regression models and hazard ratios (HRs) were estimated along with 95% confidence intervals (CIs) and P values. A log-transformation was applied to the cfDNA values to minimize the effects of extreme values on the estimation of the HRs. Kaplan–Meier curves were also plotted to explore the association of PFS and OS with baseline cfDNA dichotomized at the median and the difference between groups were assessed by the log-rank test.
results
A total of 182 patients completed both baseline CT scan and blood collection, and 103 had completed a paired follow-up blood collection and CT scan for first radiologic response assessment. Enrollment and specimen attrition are reported in the consort diagram (supplementary Figure S1, available at Annals of Oncology online). Missed or delayed collections occurred for reasons of patient inconvenience and practical feasibility, compounded by the need to process blood specimens including by centrifugation and isolation of plasma at a research laboratory in a timely manner. The characteristics of 103 patients who had both baseline and follow-up CT scan with paired blood collections are reported in supplementary Table S1, available at Annals of Oncology online. The vast majority of patients (98%) underwent first-line systemic therapy, one patient underwent second-line chemotherapy, and another patient underwent third-line chemotherapy. The systemic therapy agents used included chemotherapy alone for 59 patients (57%), chemotherapy plus bevacizumab for 7 patients (7%), molecularly targeted therapy alone including tyrosine kinase inhibitors for 17 patients (17%), and chemotherapy plus erlotinib or gefitinib in 20 patients (19%).
Median baseline level of total cfDNA was 7.0 ng/ml (range 0.2–5128 ng/ml). Of the 103 patients who completed both baseline and first follow-up CT and plasma cfDNA, the median level of cfDNA in plasma at the first follow-up evaluation was 11 ng/ml (range 1.1–14 451 ng/ml), with the median percent change from baseline of +64% (range −100% to +128 000%). Eleven were scored as having POD, 77 were scored as having SD, and 15 were scored as having PR at first response assessment. Median percent change in plasma cfDNA was +60% for POD, +80% for SD, and −12% for PR with no significant differences between radiologic response categories (P = 0.10 by Kruskal–Wallis test). A graphical representation of pre- and postsystemic therapy levels of cfDNA, log transformed and categorized by radiologic response, is presented in Figure 1. Median baseline cfDNA level was not significantly different between systemic response categories, 7.6 ng/ml for POD, 6.4 ng/ml for SD, and 8.4 ng/ml for PR (P = 0.45). Using radiologic response as a continuous variable, there was a weak monotonically increasing relationship between percent change in cfDNA levels and percent change in SLD [Spearman's correlation coefficient (r) = 0.21, P = 0.03, Figure 2]. When stratified by the type of systemic therapy, this weak correlation remained significant for patients who received cytotoxic chemotherapy alone (N = 59, r = 0.30, P = 0.02), but not other agents (N = 44, r = 0.14, P = 0.37) (supplementary Figure S2, available at Annals of Oncology online).
Figure 1.

Graphical representation of each patient's total plasma cell-free DNA levels at baseline and at first response assessment with CT, grouped according to response categories by RECIST v1.0. CT, computed tomography; DNA, deoxyribonucleic acid.
Figure 2.
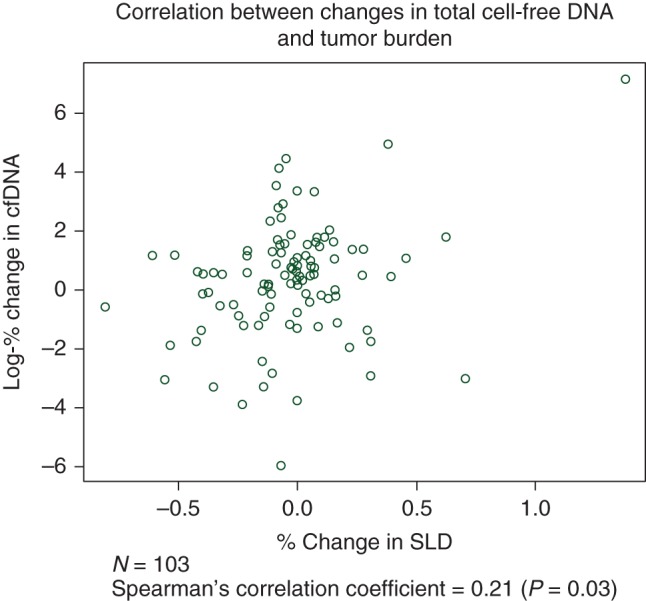
Scatterplot showing correlation between changes in total plasma cfDNA and radiologic response as continuous variables. SLD, sum of longest diameter of measurable target lesions; cfDNA, cell-free deoxyribonucleic acid.
Survival analysis was performed on 101 patients who were previously untreated for advanced NSCLC and had completed a paired baseline and follow-up blood collection and CT. A Cox regression analysis for PFS found no association between percent change in cfDNA and risk of disease progression or death (HR = 0.93, 95% CI 0.82–1.04, P = 0.20). Similarly, there was no association between baseline cfDNA levels and the risk of disease progression or death (HR = 1.06, 95% CI 0.93–1.20, P = 0.41). A Cox regression analysis for OS found no association between changes in cfDNA levels and the risk of death (HR = 1.01, 95% CI 0.91–1.11, P = 0.92). There was also no association found between baseline cfDNA levels and the risk of death (HR = 1.04, 95% CI 0.93–1.17, P = 0.51) When baseline cfDNA was dichotomized using the median of 7.0 ng/ml as the cutoff, there was no significant difference in PFS (P = 0.97) or OS (P = 0.63) between patients with high or low baseline cfDNA (supplementary Figures S3 and S4, available at Annals of Oncology online).
discussion
This is the largest prospective study evaluating the predictive value of changes in total plasma cfDNA for radiologic response to systemic treatment in patients with advanced NSCLC. We have found that changes in total cfDNA did not demonstrate a strong correlation with radiologic response, PFS or OS. While we observed a general trend for cfDNA to rise with progressive cancer and fall with PR, the specific measurements of cfDNA were highly variable and weakly associated with radiologic response at best.
The results of the first and largest study investigating the predictive value of cfDNA were published in the Journal of Clinical Oncology in 2004 by Gautschi et al. [11]. In a series of 91 patients with NSCLCs across different stages, tumor progression after chemotherapy was significantly associated with increasing plasma cfDNA concentrations. However, there were no significant decreases in total plasma cfDNA in patients who had radiologic response to chemotherapy, prompting the authors to question the reliability of cfDNA for response prediction and treatment monitoring [11]. In contrast, smaller studies by Kumar et al. [20] and Pan et al. [21] have shown significant decreases in total plasma cfDNA in patients who had radiologic response to chemotherapy, however in both studies changes in cfDNA were not able to differentiate patients with SD from those with progressive disease [20, 21].
A review of the clinical characteristics of patients with the largest discrepancy between plasma cfDNA and radiologic response, including age, gender, smoking, and histology failed to identify any patterns to explain these discrepancies. In one patient, one of the highest baseline levels of plasma cfDNA was coincident with a talc pleurodesis for a malignant pleural effusion, and then fell dramatically at the second plasma collection even though the cancer was clearly growing on CT scan. Total cfDNA is likely a nonspecific marker of tissue damage or inflammation, potentially originating from tumor cells, stromal cells, and inflammatory cells, and thus integrating characteristics of tumor, host, and the tumor–host interaction. One example of this is the observation that levels of cfDNA can be up to 10 times higher in serum compared with plasma as measured by quantitative RT-PCR, theoretically due to release of DNA from mononuclear cells in the blood specimen during the clotting process [24]. Several independent studies have consistently found a correlation between serum cfDNA and inflammatory markers such as serum lactate dehydrogenase [11, 16]. A recent study by Nygaard et al. found no significant association between plasma cfDNA and metabolic tumor volume on positron emission tomography, suggesting its lack of specificity for total tumor burden [19].
Previous studies evaluating the association of total cfDNA with response observed similarly inconsistent results reflecting its lack of tumor specificity [11, 20, 21]. Gautschi et al. [11] found significant increases in plasma cfDNA but no change in serum cfDNA in patients with POD; and no change in plasma cfDNA but significant decreases in serum cfDNA in patients who had a PR or SD. Kumar et al. was not able to use changes in cfDNA to distinguish patients with SD from POD [20], whereas Pan et al. showed no significant change in cfDNA in patients with POD [21]. These historical studies differed from ours as none of the others used cfDNA levels and radiologic response as both categorical and continuous variables. While we were able to produce statistically significant results depending on the statistical methods used, our overall findings suggest that total cfDNA cannot be used clinically now as a reliable predictive or prognostic biomarker. Nevertheless, the results of our prospective study confirm the suspicions by Gautschi et al. [11] that, despite their statistically significant results, changes in total cfDNA are not reliable for treatment response prediction, due to its low specificity for overall tumor burden.
This analysis was potentially limited by the fact that transportation, handling, and storage of samples may have affected cfDNA levels through variable release of DNA from mononuclear cells in the blood sample, or degradation during storage [24, 25]. Furthermore, we failed to collect and process blood specimens in many patients enrolled on this prospective study (see supplementary Table S1, available at Annals of Oncology online). To account for these, all blood samples were processed in the same location by trained technicians, and all samples were ordered to be processed within 1 h of collection. Owing to the strict protocol used, contamination by spurious results is unlikely. The wide ranges of cfDNA levels encountered are consistent with experiences from previous studies [12, 17]. We have excluded collections delayed more than 3 weeks from the paired CT, which is a typical time period for a cycle of chemotherapy. This time discrepancy of up to 3 weeks may theoretically be a source of bias given the short half-life of cfDNA. However, for total cfDNA to be clinically useful, it needs to accurately predict response seen on CT while allowing a practical window of flexibility for blood collections. The limitations encountered during this study emphasize the importance of practical considerations when developing a blood biomarker. In order to be generalizable to routine practice, blood biomarkers should be easy to obtain, with minimal processing, ideally handled by the clinical laboratory at room temperature, and not subject to variability in processing.
In conclusion, this prospective study demonstrated that changes in total plasma cfDNA were not a sufficiently reliable predictive biomarker in treatment monitoring for patients with advanced NSCLC, likely due to its low specificity for total tumor burden. Future research efforts in plasma cfDNA should be directed at tumor-specific genomic alterations, such as EGFR [26, 27] and KRAS [28, 29] and other alterations now possible due to the expanded capabilities of next-generation sequencing [30]. Pilot studies identifying EGFR T790M and other biomarkers as ‘liquid biopsies’ in the blood with high sensitivity and specificity are now being evaluated to signal the onset of treatment-related resistance and need for therapy switch long before clinical progression is evident by CT [6, 31, 32]. These advances in technology may increase the tumor specificity of cfDNA and fulfill its long awaited potential as a blood biomarker to improve personalized cancer therapy for patients suffering from lung cancers.
funding
This research was funded by R01-CA092315-02 and the MSKCore Grant P30 CA008748 from the National Institutes of Health, USA.
disclosure
BTL has received consulting fees from Roche and Biosceptre International; MGK has received consulting fees from AstraZeneca, Clovis Oncology, Daiichi Sankyo, and Genentech/Roche. All other authors declare no competing interests.
Supplementary Material
references
- 1.Leon SA, Shapiro B, Sklaroff DM, Yaros MJ. Free DNA in the serum of cancer patients and the effect of therapy. Cancer Res 1977; 37: 646–650. [PubMed] [Google Scholar]
- 2.Jahr S, Hentze H, Englisch S et al. DNA fragments in the blood plasma of cancer patients: quantitations and evidence for their origin from apoptotic and necrotic cells. Cancer Res 2001; 61: 1659–1665. [PubMed] [Google Scholar]
- 3.Stroun M, Lyautey J, Lederrey C et al. About the possible origin and mechanism of circulating DNA apoptosis and active DNA release. Clin Chim Acta 2001; 313: 139–142. [DOI] [PubMed] [Google Scholar]
- 4.Choi JJ, Reich CF III, Pisetsky DS. The role of macrophages in the in vitro generation of extracellular DNA from apoptotic and necrotic cells. Immunology 2005; 115: 55–62. [DOI] [PMC free article] [PubMed] [Google Scholar]
- 5.Ignatiadis M, Dawson SJ. Circulating tumor cells and circulating tumor DNA for precision medicine: dream or reality? Ann Oncol 2014; 25: 2304–2313. [DOI] [PubMed] [Google Scholar]
- 6.Diaz LA Jr, Bardelli A. Liquid biopsies: genotyping circulating tumor DNA. J Clin Oncol 2014; 32: 579–586. [DOI] [PMC free article] [PubMed] [Google Scholar]
- 7.Schwarzenbach H, Hoon DS, Pantel K. Cell-free nucleic acids as biomarkers in cancer patients. Nat Rev Cancer 2011; 11: 426–437. [DOI] [PubMed] [Google Scholar]
- 8.Sozzi G, Conte D, Leon M et al. Quantification of free circulating DNA as a diagnostic marker in lung cancer. J Clin Oncol 2003; 21: 3902–3908. [DOI] [PubMed] [Google Scholar]
- 9.Yoon KA, Park S, Lee SH et al. Comparison of circulating plasma DNA levels between lung cancer patients and healthy controls. J Mol Diagn 2009; 11: 182–185. [DOI] [PMC free article] [PubMed] [Google Scholar]
- 10.Sozzi G, Roz L, Conte D et al. Plasma DNA quantification in lung cancer computed tomography screening: five-year results of a prospective study. Am J Respir Crit Care Med 2009; 179: 69–74. [DOI] [PubMed] [Google Scholar]
- 11.Gautschi O, Bigosch C, Huegli B et al. Circulating deoxyribonucleic acid as prognostic marker in non-small-cell lung cancer patients undergoing chemotherapy. J Clin Oncol 2004; 22: 4157–4164. [DOI] [PubMed] [Google Scholar]
- 12.van der Drift MA, Hol BE, Klaassen CH et al. Circulating DNA is a non-invasive prognostic factor for survival in non-small cell lung cancer. Lung Cancer 2010; 68: 283–287. [DOI] [PubMed] [Google Scholar]
- 13.Catarino R, Coelho A, Araujo A et al. Circulating DNA: diagnostic tool and predictive marker for overall survival of NSCLC patients. PLoS One 2012; 7: e38559. [DOI] [PMC free article] [PubMed] [Google Scholar]
- 14.Ludovini V, Pistola L, Gregorc V et al. Plasma DNA, microsatellite alterations, and p53 tumor mutations are associated with disease-free survival in radically resected non-small cell lung cancer patients: a study of the perugia multidisciplinary team for thoracic oncology. J Thorac Oncol 2008; 3: 365–373. [DOI] [PubMed] [Google Scholar]
- 15.Sozzi G, Conte D, Mariani L et al. Analysis of circulating tumor DNA in plasma at diagnosis and during follow-up of lung cancer patients. Cancer Res 2001; 61: 4675–4678. [PubMed] [Google Scholar]
- 16.Kumar S, Guleria R, Singh V et al. Efficacy of circulating plasma DNA as a diagnostic tool for advanced non-small cell lung cancer and its predictive utility for survival and response to chemotherapy. Lung Cancer 2010; 70: 211–217. [DOI] [PubMed] [Google Scholar]
- 17.Sirera R, Bremnes RM, Cabrera A et al. Circulating DNA is a useful prognostic factor in patients with advanced non-small cell lung cancer. J Thorac Oncol 2011; 6: 286–290. [DOI] [PubMed] [Google Scholar]
- 18.Lee YJ, Yoon KA, Han JY et al. Circulating cell-free DNA in plasma of never smokers with advanced lung adenocarcinoma receiving gefitinib or standard chemotherapy as first-line therapy. Clin Cancer Res 2011; 17: 5179–5187. [DOI] [PubMed] [Google Scholar]
- 19.Nygaard AD, Holdgaard PC, Spindler KL et al. The correlation between cell-free DNA and tumour burden was estimated by PET/CT in patients with advanced NSCLC. Br J Cancer 2014; 110: 363–368. [DOI] [PMC free article] [PubMed] [Google Scholar]
- 20.Kumar S, Guleria R, Singh V et al. Plasma DNA level in predicting therapeutic efficacy in advanced nonsmall cell lung cancer. Eur Respir J 2010; 36: 885–892. [DOI] [PubMed] [Google Scholar]
- 21.Pan S, Xia W, Ding Q et al. Can plasma DNA monitoring be employed in personalized chemotherapy for patients with advanced lung cancer? Biomed Pharmacother 2012; 66: 131–137. [DOI] [PubMed] [Google Scholar]
- 22.Lo YM, Zhang J, Leung TN et al. Rapid clearance of fetal DNA from maternal plasma. Am J Hum Genet 1999; 64: 218–224. [DOI] [PMC free article] [PubMed] [Google Scholar]
- 23.Kawakami K, Brabender J, Lord RV et al. Hypermethylated APC DNA in plasma and prognosis of patients with esophageal adenocarcinoma. J Natl Cancer Inst 2000; 92: 1805–1811. [DOI] [PubMed] [Google Scholar]
- 24.Gormally E, Caboux E, Vineis P, Hainaut P. Circulating free DNA in plasma or serum as biomarker of carcinogenesis: practical aspects and biological significance. Mutat Res 2007; 635: 105–117. [DOI] [PubMed] [Google Scholar]
- 25.Sozzi G, Roz L, Conte D et al. Effects of prolonged storage of whole plasma or isolated plasma DNA on the results of circulating DNA quantification assays. J Natl Cancer Inst 2005; 97: 1848–1850. [DOI] [PubMed] [Google Scholar]
- 26.Bai H, Mao L, Wang HS et al. Epidermal growth factor receptor mutations in plasma DNA samples predict tumor response in Chinese patients with stages IIIB to IV non-small-cell lung cancer. J Clin Oncol 2009; 27: 2653–2659. [DOI] [PubMed] [Google Scholar]
- 27.Douillard JY, Ostoros G, Cobo M et al. Gefitinib treatment in EGFR mutated Caucasian NSCLC: circulating-free tumor DNA as a surrogate for determination of EGFR status. J Thorac Oncol 2014; 9: 1345–1353. [DOI] [PMC free article] [PubMed] [Google Scholar]
- 28.Kimura T, Holland WS, Kawaguchi T et al. Mutant DNA in plasma of lung cancer patients: potential for monitoring response to therapy. Ann N Y Acad Sci 2004; 1022: 55–60. [DOI] [PubMed] [Google Scholar]
- 29.Nygaard AD, Garm Spindler KL, Pallisgaard N et al. The prognostic value of KRAS mutated plasma DNA in advanced non-small cell lung cancer. Lung Cancer 2013; 79: 312–317. [DOI] [PubMed] [Google Scholar]
- 30.Newman AM, Bratman SV, To J et al. An ultrasensitive method for quantitating circulating tumor DNA with broad patient coverage. Nat Med 2014; 20: 548–554. [DOI] [PMC free article] [PubMed] [Google Scholar]
- 31.Kuang Y, Rogers A, Yeap BY et al. Noninvasive detection of EGFR T790M in gefitinib or erlotinib resistant non-small cell lung cancer. Clin Cancer Res 2009; 15: 2630–2636. [DOI] [PMC free article] [PubMed] [Google Scholar]
- 32.Oxnard GR, Paweletz CP, Kuang Y et al. Noninvasive detection of response and resistance in EGFR-mutant lung cancer using quantitative next-generation genotyping of cell-free plasma DNA. Clin Cancer Res 2014; 20: 1698–1705. [DOI] [PMC free article] [PubMed] [Google Scholar]
Associated Data
This section collects any data citations, data availability statements, or supplementary materials included in this article.