Abstract
Purpose
To describe the location of initial visual field defects (VFD) in glaucoma, their modes of deterioration, and those factors associated with different modes of deterioration.
Methods
Patients with POAG were categorized into four groups based on three consecutive initial VFD: (1) superior paracentral defects (PD), (2) inferior PD, (3) superior nasal defects (ND), and (4) inferior ND. According to the worsening of the VF, four further subgroups were identified: (1) superior central worsening (CW), (2) inferior CW, (3) superior peripheral or nasal worsening (NW), and (4) inferior NW. Systemic and ocular factors were analyzed for each of the subgroups to identify possible associations.
Results
One hundred sixty-two eyes of 162 subjects were analyzed. Superior PD (n = 40) were more frequent in females and associated with disc hemorrhage (DH), and were less frequent in patients with systemic hypertension (HT). Inferior PD (n = 35) showed a significant association with cup shape measure and axial length. Superior ND (n = 37) were more highly associated with HT and diabetes. Inferior ND (n = 50) showed a lower incidence of DH. With binary logistic regression analysis, superior PD showed a significant association with both HT and DH. With respect to VF worsening, superior CW showed a significant association with HT and diabetes, whereas superior NW was associated with a high minimum IOP during follow-up, and inferior NW was associated with a high maximum IOP during follow-up.
Conclusions
The initial location and subsequent direction of worsening of VFD were associated with different systemic and ocular factors.
Keywords: glaucoma, initial visual field defect, visual field progression
The initial location and subsequent direction of worsening of visual field defects were associated with different systemic and ocular factors. In general, superior paracentral defects were associated with systemic factors, whereas inferior paracentral defects were associated with ocular factors.
Glaucoma is characterized by a chronic progressive optic neuropathy with corresponding and characteristic patterns of visual field (VF) loss. In the majority of patients, VF changes are initially localized and as the disease progresses, these focal areas become wider, deeper, and more numerous. However, there is a great deal of variability in the rate and mode of worsening between patients.1 Failure to treat early to moderate VF changes could lead to a decline in the quality of a glaucoma patient's life, with various effects depending on the degree and location of the visual loss.2,3 Visual field defects (VFD) near fixation have a greater impact on the level of function compared with peripheral changes, even at an early stage of glaucoma.4,5 It is generally taught that initial glaucomatous VF abnormalities frequently occur in the periphery with relative preservation of the central field. In actuality, one finds a variety of patterns and in some patients the initial defect may be quite centrally located. There is very little published about the exact nature of the initial VFD and the manner in which it subsequently worsens.
Given that glaucoma is a chronic progressive disease, much effort has been dedicated to the study of the factors relating to visual decay and the relationship between structural and functional changes.6–9 The two key elements in the study of glaucomatous VF deterioration are the direction and the rate of decay. If deterioration occurs in the central direction (toward fixation), one would expect a greater impact on the patient's function with increasing functional loss in cases of rapidly centrally deteriorating VFs, even in those with relatively small initial defects.
The current study was undertaken to investigate the location of initial glaucomatous VFD, and the possible ocular and systemic factors associated with (1) the location of the initial VFD, and (2) the direction of worsening relative to the initial defect.
Materials and Methods
Patient and Visual Field Data
A retrospective case review of open-angle glaucoma (OAG) patients of the University of California at Los Angeles (Los Angeles, CA, USA) Glaucoma Division with 6 or more years follow-up, and who had at least eight VF examinations was conducted. Visual fields were performed with a Humphrey Visual Field Analyzer (Carl Zeiss Ophthalmic Systems, Inc., Dublin, CA, USA) with the 24-2 SITA standard test strategy. Visual fields with acceptable VF reliability scores (according to the Advanced Glaucoma Intervention Study [AGIS] protocol) were included.10 Within the cohort of subjects whose records were reviewed, only those who matched the additional following criteria were included in the study:
Those with single defects, confined to one hemifield only;
The record contained all of the following information: a detailed history and complete clinical examination details (slit-lamp biomicroscopy, Goldmann applanation tonometry, gonioscopy, dilated fundus examination), VF examination, optic disc stereophotography, central corneal thickness (CCT) measurements, axial length measurement (IOL master), and confocal scanning laser tomography (HRT, Heidelberg Retina Tomography, Heidelberg Engineering, Heidelberg, Germany); and
If both eyes of a patient were eligible, the eye with lower VF mean deviation (MD) was enrolled.
Eyes with systemic or ocular disease known to affect the VF or those with missing data were excluded. The institutional review board of the University of California at Los Angeles approved the present study. All research procedures followed the tenets set forth in the Declaration of Helsinki.
Definitions
Initial VF Defect.
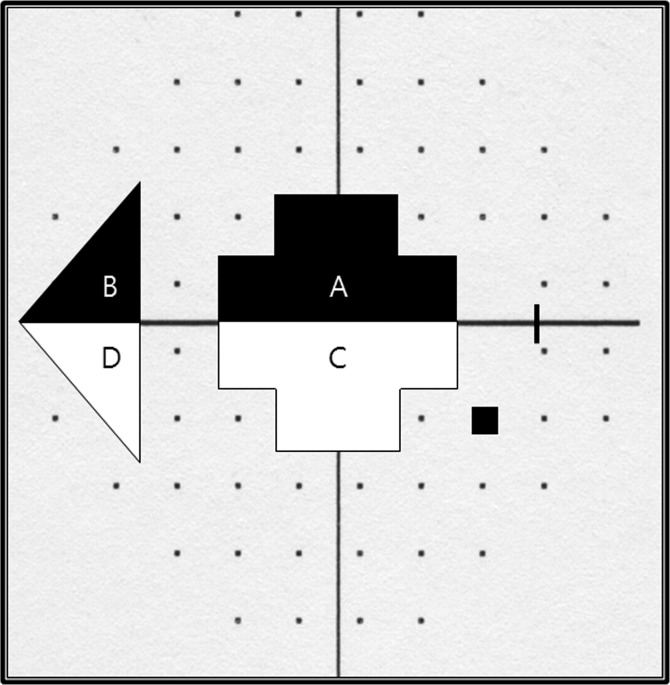
These were divided into two groups, paracentral (PD) and nasal (ND) defects based on probability map locations in at least three out of the initial four Humphrey VF print outs. These two groups were then divided into two subgroups (superior and inferior) based on the affected hemifield. This yielded four initial defect arms for the study: (1) superior PD, (2) inferior PD, (3) superior ND, and (4) inferior ND.
Paracentral defects were defined as three or more adjacent points with an abnormal probability score of P less than 2%, or at least one point with a P less than 1% within the two paracentral locations nearest to fixation. Nasal defects were defined as three or more adjacent points with an abnormal probability score of P less than 2%, or one or more points with P less than 1% within the three nasal-most points of the Humphrey VF (Figs. 1, 2). Horizontally, PD was for points lying from 0° to 10°, and ND was for points beyond 20°.
Figure 1.
Initial visual field defect. Paracentral defects were ([A] superior) and ([C] inferior). Nasal defects were ([B] superior) and ([D] inferior).
Figure 2.
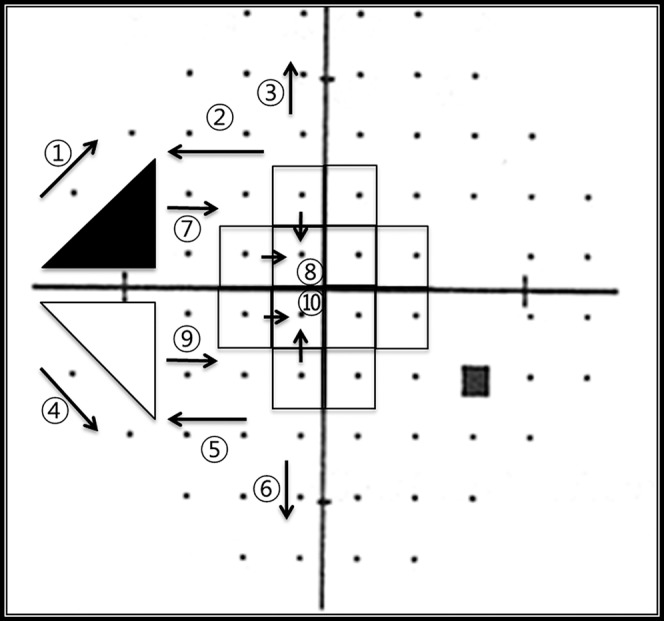
The direction of extension of VF defects from initial defects. The central progression (CW) groups were 7○ and 8○ (superior), and 9○ and 10○ (inferior). The peripheral/nasal progression (NW) groups were 1○, 2○, and 3○ (superior) and 4○ and 5○, and 6○ (inferior).
The Direction of VF Deterioration.
Deterioration was defined with modified Anderson's criteria11,12 as contiguous points on a Humphrey 24-2 SITA standard VF with P less than 2% on the total deviation plot, or the development of new scotoma (at least 1 point of P < 1% or 3 contagious points of P < 2%) in the same hemifield.
The direction of worsening was recorded as either central (CW), or peripheral/nasal (NW) depending on the initial location of the VFD (Fig. 2). Deterioration required confirmation in at least three consecutive VFs. Patients were divided into four groups, depending on the direction of the worsening of the defect: superior CW, (2) inferior CW, (3) superior NW, and (4) inferior NW. Cases were excluded from these groups if (1) worsening could not be detected, or (2) the direction of worsening could not be defined such as the occurrence of a new scotoma in the opposite hemifield, a change in the location of a scotoma with repeated VF testing, deepening of a scotoma without spatial expansion, or the development of multiple scotoma, such as from a branched retinal vein occlusion or occurring after a long period of loss to follow up.
Data Analysis
The relationships between both the initial VFD and the direction of subsequent decay with demographic, systemic, and ocular factors were evaluated. Demographic factors included age at the onset of initial VF defect, sex, and family history of glaucoma. Systemic factors included a history of diabetes mellitus (DM), systemic hypertension (HT), and migraine. Ocular factors included disc hemorrhage (DH), CCT, axial length, maximum IOP, minimum IOP, IOP range during follow up, MD, PSD, cup to disc ratio (CDR), retinal nerve fiber layer (RNFL) thickness, cup shape measure (CSM), and disc area. Intraocular pressure range was defined as the difference between maximum IOP and minimum IOP during follow-up. Depending on the sample size, a χ2 test or a Fisher's exact test was performed to compare categorical variables among groups. Independent t-tests and one-way ANOVA (with the Bonferroni correction) were used to compare continuous factors among groups. In order to exclude confounding elements among the factors analyzed, we performed a binary logistic regression analysis for all possible associations. Statistical analyses were performed with SPSS version 20.0 software (SPSS, Inc., Chicago, IL, USA). P values of less than 0.05 were considered statistically significant.
Results
Patient and Visual Field Data
One hundred sixty-two eyes of 162 subjects were included. An initial paracentral defect (PD) occurred in 75 and an initial nasal defect (ND) occurred in 88 (Table 1). The baseline characteristics of the subgroups are shown in Tables 2 and 3. The number of eyes in each of the subgroups was 40 in superior PD, 35 in inferior PD, 37 in superior ND, and 50 in inferior ND. The results were compared for each subgroup with all other groups combined and are shown in Table 4. The result of binary logistic regression analysis is shown in Table 5.
Table 1.
Comparison Between Initial Paracentral Defect (PD) and Initial Nasal Defect (ND)
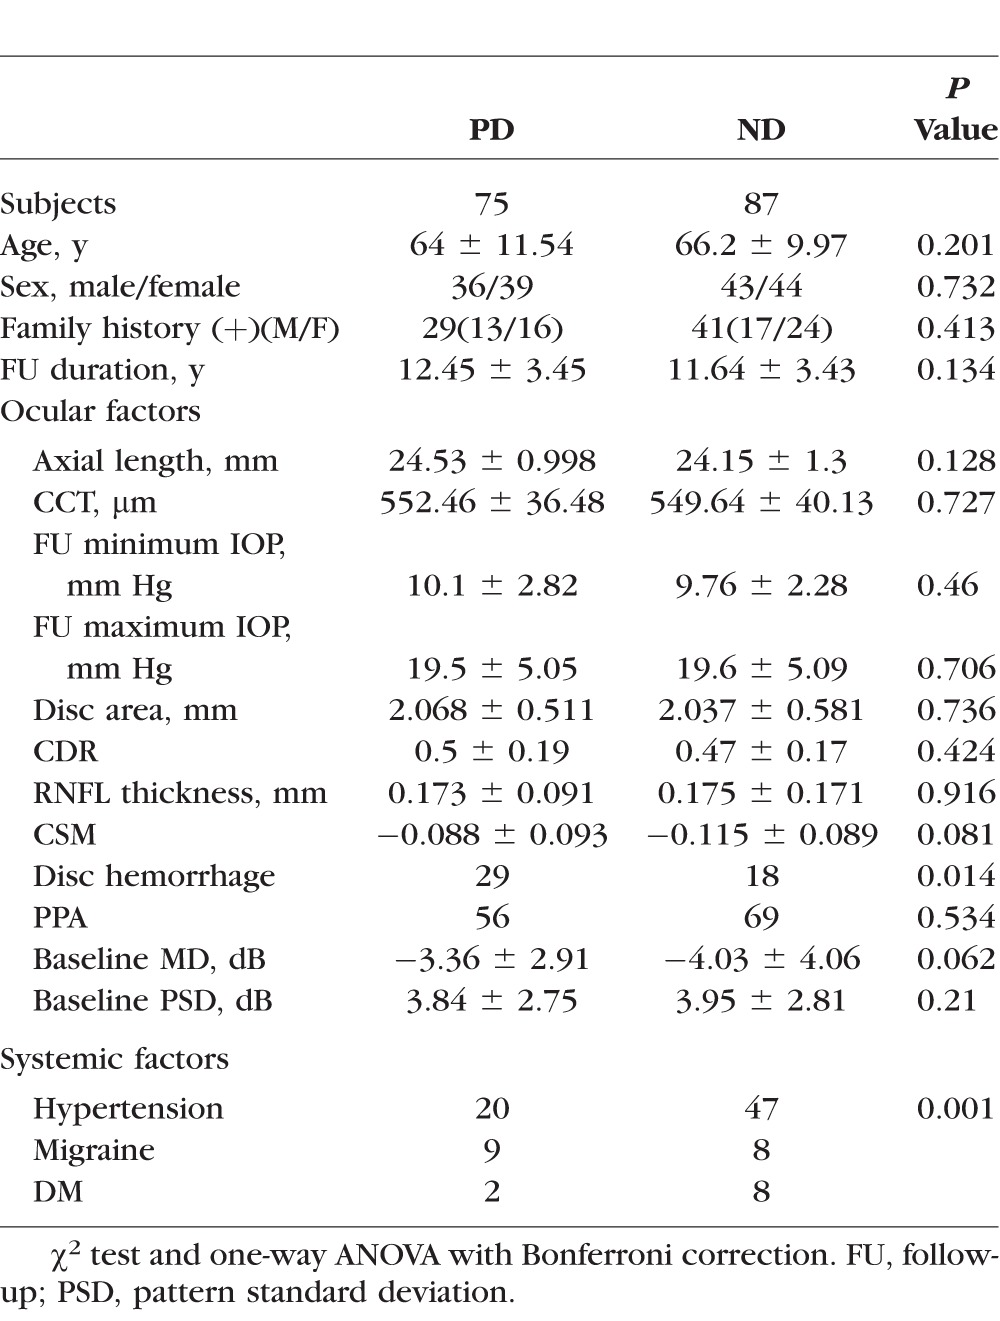
Table 2.
Clinical Characteristics of the Subgroups of Initial PD and Initial ND.
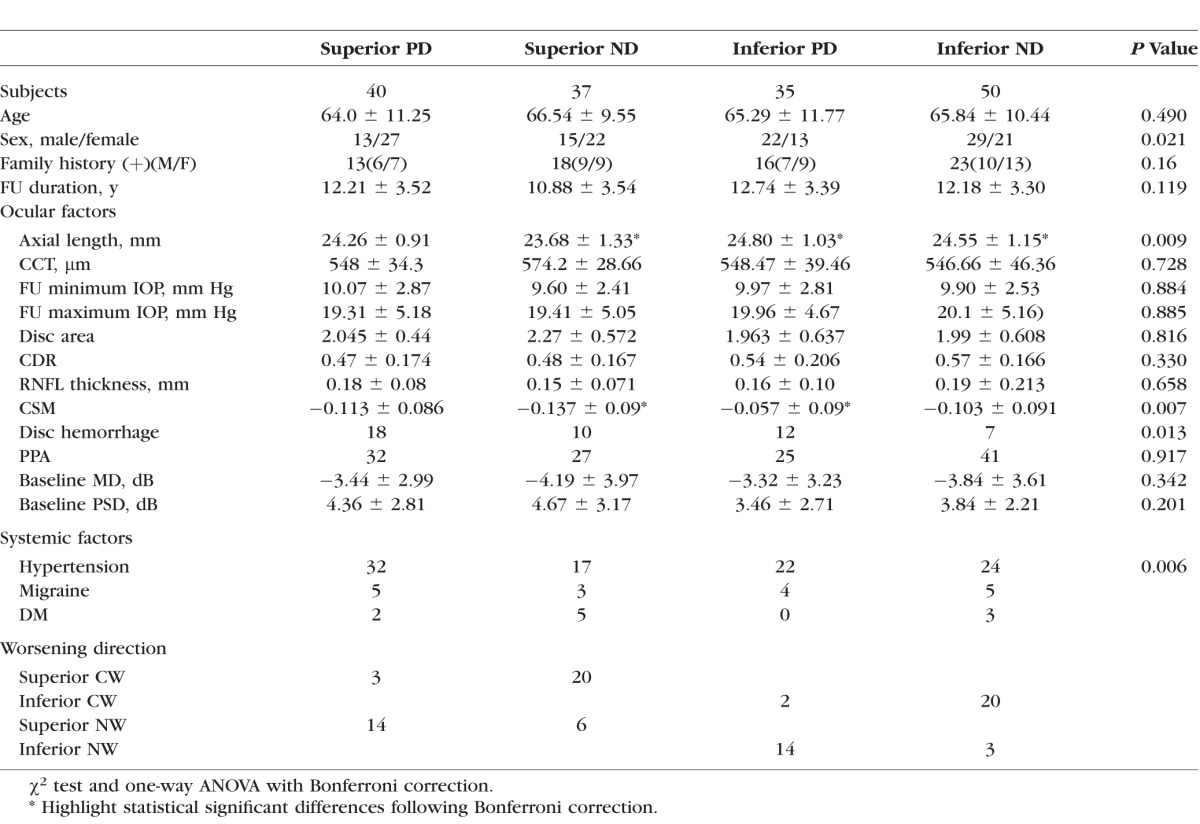
Table 3.
Clinical Characteristics of the Study Population of Progression Direction
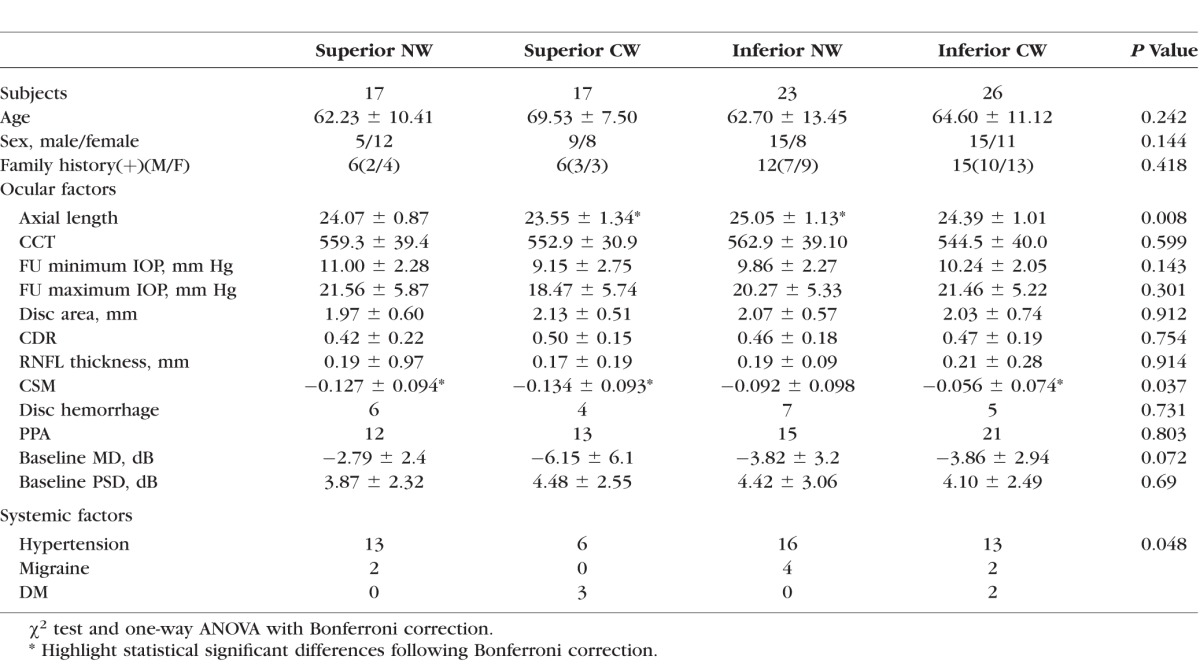
Table 4.
Comparing Each Subgroup in Turn With all the Other Groups Combined Together
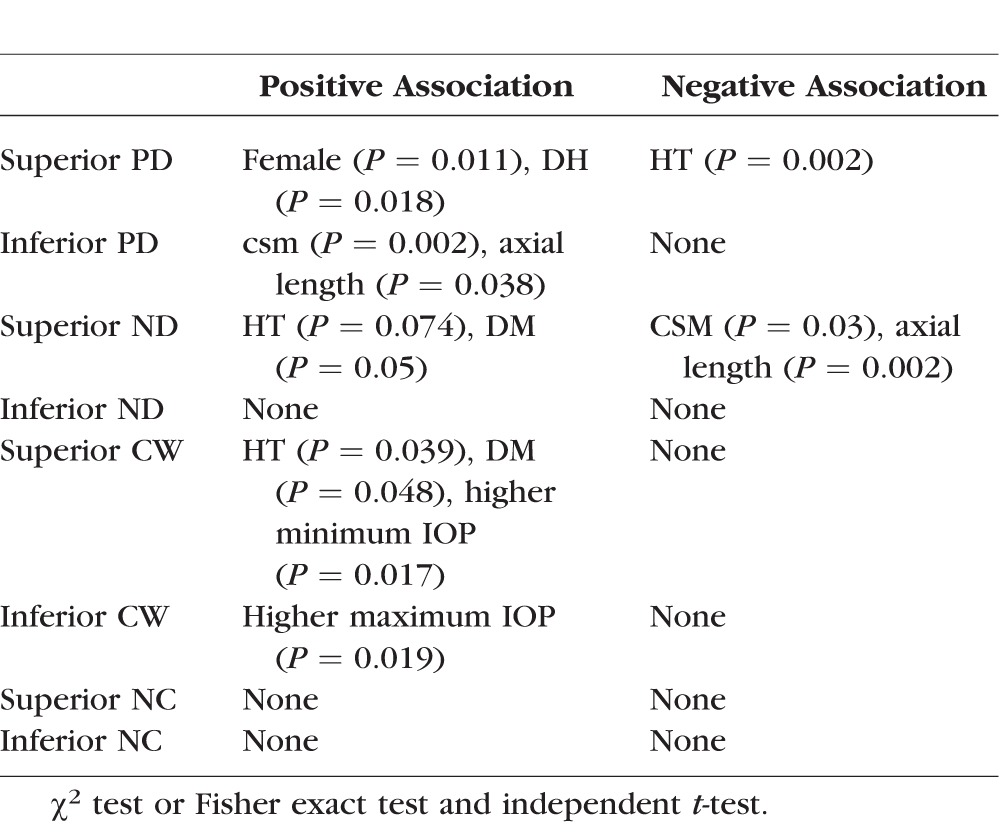
Table 5.
Binary Logistic Regression Analysis for Superior PD

The Initial VFD
When analyzing differences in associations between initial PD and initial ND, patients with initial PDs showed more DHs and less HT than patients with ND (P = 0.014 and P = 0.001, χ2 test, respectively, Table 1).
Paracentral Defect (PD) Group.
Superior PD subgroup.
There was a female preponderance (P = 0.018, χ2 test) in this group but there were no significant associations with age, family history of glaucoma, DM, or SAS. Among the systemic factors considered, HT (P = 0.002, χ2 test) was negatively associated with the PD superior subgroup compared with the others. There was a significant association with DH (P = 0.011, χ2 test) but no significant association was found with the other ocular factors analyzed.
Inferior PD subgroup.
This group had a greater CSM (steeper cup) and longer axial length than other groups (P = 0.002 and P = 0.038, independent t-test, respectively).
Nasal Defect (ND) Group.
Superior ND subgroup.
There was a higher incidence of HT (P = 0.074, odds ratio [OR] 1.952, χ2 test) and DM (P = 0.05, Fisher exact test) in this group and a more negative MD value (P = 0.011, independent t-test), higher PSD value (P = 0.042, independent t-test), lower CSM (less steep cup, P = 0.03, independent t-test), and shorter axial length (P = 0.002, independent t-test) compared with the other groups.
Inferior ND subgroup.
In these eyes, there was a lower incidence of DH during the follow-up period (P = 0.005, χ2 test).
When binary logistic regression analysis adjusted for sex, HT, and DH was carried out, HT and DH were still significant factors for superior PD. (P = 0.005 and P = 0.048, respectively) (Table 5). No other factors were found to have significant associations with the location of the initial VFD.
The Direction of Worsening of VF Defect
As shown in Table 2, in the group with an initial superior paracentral defect (PD), 14 eyes worsened nasally (superior NW) and three worsened centrally (superior CW). In the group with the initial inferior paracentral defects (PD), two deteriorated centrally (inferior CW) and 14 deteriorated nasally (inferior NW). In the group with initial superior nasal defects (superior ND), 20 eyes deteriorated toward a central direction (superior CW) and six eyes deteriorated toward a nasal direction (superior NW). In the groups with initial inferior nasal defects (inferior ND), 20 eyes deteriorated centrally (inferior CW) and three deteriorated nasally (inferior NW).
Central Worsening Group.
Superior CW subgroup.
This group had a significant association with HT (P = 0.039, OR 2.65, 95% CI; 1.032 ∼ 6.803, χ2 test) and DM (P = 0.048, OR 0.167, 95% CI; 0.029 ∼ 0.973, Fisher exact test), and there was a higher minimum IOP (10.88 mm Hg ± 2.33) during the follow up period compared with the other groups (9.44 mm Hg ± 2.07, P = 0.017, independent t-test).
Inferior CW subgroup.
There was a higher maximum IOP (21.55 mm Hg ± 6.25) during the follow-up period compared with the other groups (18.53 mm Hg ± 4.45, P = 0.019, independent t-test).
Peripheral/Nasal Worsening Group.
There were no factors that were significantly associated with either of the subgroups in these patients.
Discussion
The current study was carried out to identify systemic and ocular factors associated with the location of the initial VF defect and its subsequent direction of worsening in glaucoma. The results suggest that factors associated with the location of the initial VF defect are different from those associated with the subsequent direction of worsening. With regard to the initial location of glaucoma damage, the superior paracentral group had a female preponderance, a higher incidence of disc hemorrhages, and was significantly less frequently associated with HT compared with other groups. The inferior paracentral group was significantly associated with CSM and axial length. Thus, initial superior paracentral defects were generally associated with systemic factors, while initial inferior paracentral defects were generally associated with ocular factors.
With respect to the direction of worsening, the superior paracentral group exhibited a stronger association with hypertension (HT) compared with the other groups. Central worsening showed a significant association with IOP during the follow-up period; however, peripheral worsening did not because most centrally worsening patients had an initial peripheral VFD. A portion of this result simply reflects the natural course of the disease. Werner and Berashow reported that early VFD often begin with a nasal step.13 Another study suggested that nasal steps appear to be a common defect in acute and early chronic angle-closure glaucoma.14,15 Park et al.16 previously reported that the development of an initial paracentral scotoma showed a stronger association with IOP-independent risk factors compared with initial peripheral scotomas, and that high IOP may be a risk factor for peripheral VFD.
Previous studies have suggested an association between systemic HT and glaucoma.17–23 In this study, while two of the subgroups (superior ND and superior CW) had a positive association with HT, the superior PD group showed a negative association. The relationship between systemic HT and glaucoma is not entirely clear. By increasing the ocular perfusion pressure, systemic HT may in fact be a protective factor in glaucoma by reducing the effects of low ocular perfusion pressure, which is a known risk factor for glaucoma.21–22,24–26 It has previously been shown that a 10-mm Hg increase in systolic pressure is associated with 0.24- to 0.3-mm Hg increase in IOP, and a 10-mm Hg increase in diastolic pressure is associated with 0.4- to 0.6-mm Hg increase in IOP.25,27 This occurs due to increasing aqueous humor formation and an increasing choroidal volume.28,29 Hypertension may induce obliteration of small vessels that can harm the perfusion of the optic nerve.30 Small vessel changes with longstanding HT can be a risk. Leung et al.30 suggested that retinal arterioles were narrowed in HT patients due to microvascular damage from increased blood pressure. However, systemic HT was determined based solely on history; we cannot analyze the effect of treatment. Patients with a history of systemic HT present the possibility of low BP with treatment. Episodes of hypotension could affect the location of initial VFD.31
Disc hemorrhage is an important risk factor for glaucoma and a sign of active disease.32–36 Jeoung et al.37 have shown that the RNFL thickness is decreased by the time a DH is detected. Park et al.16 have suggested that DH is closely associated with the presence of a central visual field defect. In our study we found that the superior PD group was associated with DH. The inferior PD showed significant associations with axial length and CSM. High axial myopia is a risk factor of glaucoma development and worsening.38,39 Structural changes associated with myopia, such as a longer axial length, a larger or tilted optic disc, and peripapillary atrophy (PPA) may make the maculopapillary bundle more susceptible to glaucomatous injury.38 Mayama et al.39 suggested that higher myopia threatens the remaining lower cecocentral VF, and that it may also negatively affect the quality of vision in eyes with advanced OAG.
Cup shape measure (as measured by the HRT) is a reflection of the overall 3-dimensional shape of the optic nerve head. Steeper cupping may be due to the effect of thin RNFL thickness or the reflection of the natural variation of optic disc structure.40 In our results, the inferior PD subgroup had a greater CSM (steeper cup) and superior ND subgroup had a lower CSM (less steep cup). The amount of VFD of both groups was comparable. Inferior PD showed longer axial length and superior ND showed shorter axial length than others. With elongation of axial length, RNFL thickness decreases41; this may be one of the factors which affects our results.
With respect to worsening, inferior NW was associated with a significantly higher maximum IOP during follow up than other worsening groups. Considering that inferior PD were associated with CSM and longer axial length and worsening of this group (inferior CW) showed higher maximum IOP during follow-up, inferior PD may be more affected by ocular factors rather than systemic factors.
According to a recently presented study that analyzed initial VFD as either central and peripheral, the central cases showed a higher association with systemic risk factors and with DH than the peripheral ones.16 The differences between those results and those of this study may largely be due to the study design. Their subjects mainly included high IOP glaucoma patients (including chronic angle closure glaucoma); however, our study was in OAG patients (including normal-tension patients), and those with chronic angle closure glaucoma were excluded. Furthermore, our patients were subdivided into four groups rather than two. Considering that IOP-independent factors may preferentially affect the neuroretinal rim or RNFL closer to the papillomacular bundle in the inferior half of optic nerve head or retina compared with high IOP,16,42,43 the negative association between HT and the superior PD group is interesting. The glaucoma patients with HT had superior nasal defects and that tended to progress centrally. Generally, most of initial VF defects, particularly initial parafoveal scotomas, developed in the superior hemifield.16,44,45 Systemic hypotension has been reported as a risk factor for central scotomas.16,26,46 In the early stages of systemic HT, blood flow to the eye may be enhanced. With longstanding systemic HT, smaller arterioles may be affected earlier than larger arterioles. We hypothesize that although there may be a high ocular perfusion pressure of the large arteries, decreased perfusion in the smaller, diseased vessels may produce peripheral VFD earlier than central VFD. As the effects of systemic HT or its treatment evolve, even central retinal ganglion cells may become vulnerable to decreased perfusion, and the VFD progress centrally. According to our findings, the central VF in patients with systemic HT remains relatively preserved during the initial stage of the disease as compared with those without systemic HT.
There are some limitations of this study. The data were collected retrospectively and information such as the initial history and the systemic risk factors were dependent on patient reporting and medical record documentation during clinic visits. All study patients were recruited from a tertiary care glaucoma clinic, which could create a sampling bias. Some patients were excluded from analysis because of missing data, such as axial length, CCT, and records at the initial visit. The effect of this selection of patients on our results is not known. A confounding factor in the design of the study is that the central most locations of the VF may preferentially deteriorate toward the periphery and the peripheral most points may do so centrally, and this could have introduced a bias into the results.
In our study, patients with an initial paracentral VFD had different characteristics than those with other patterns of defects. In particular, systemic factors (more migraine and less HT) were closely associated with superior paracentral defects. However, ocular factors (steeper cup and longer axial length) were more closely associated with inferior paracentral defects. Glaucoma patients with normal blood pressure appear to show a greater loss of superior central VF as compared with their hypertensive counterparts. These findings may help clinicians identify glaucoma phenotypes that may help anticipate the course of worsening patients and guide appropriate treatment.
Acknowledgments
Supported by grants from Pfizer, Inc. (New York, NY, USA), Allergan, Inc. (Irvine, CA, USA), Alcon, Inc. (Fort Worth, TX, USA), an unrestricted grant from Research to Prevent Blindness, Inc. (New York, NY, USA), and the National Eye Institute/National Institutes of Health (Bethesda, MD, USA) Grant R01-EY-018644 (all JC).
Disclosure: J.M. Kim, None; H. Kyung, None; S.H. Shim, None; P. Azarbod, None; J. Caprioli, Pfizer, Inc. (F), Allergan, Inc. (F, C), Alcon, Inc. (F)
References
- 1. Caprioli J,, Spaeth GL. Comparison of visual field defects in the low-tension glaucomas with those in the high-tension glaucomas. Am J Ophthalmol. 1984; 97: 730–737. [DOI] [PubMed] [Google Scholar]
- 2. McKean-Cowdin R,, Wang Y,, Wu J,, Azen SP,, Varma R;, for the Los Angeles Latino Eye Study Group. Impact of visual field loss on health-related quality of life in glaucoma: the Los Angeles Latino Eye Study. Ophthalmology. 2008; 115: 941–948. [DOI] [PMC free article] [PubMed] [Google Scholar]
- 3. Yanagisawa M,, Kato S,, Kobayashi M,, Watanabe M,, Ochiai M. Relationship between vision-related quality of life and different types of existing visual fields in Japanese patients. Int Ophthalmol. 2012; 32: 523–529. [DOI] [PubMed] [Google Scholar]
- 4. Fujita K,, Yasuda N,, Oda K,, Yuzawa M. Reading performance in patients with central visual field disturbance due to glaucoma [in Japanese]. Nippon Ganka Gakkai Zasshi. 2006; 110: 914–918. [PubMed] [Google Scholar]
- 5. Coexkelbergh TR,, Brouwer WH,, Cornelissen FW,, et al. The effect of visual field defects on driving performance: a driving simulator study. Arch Ophthalmol. 2002; 120: 1509–1516. [DOI] [PubMed] [Google Scholar]
- 6. Drance S,, Anderson DR,, Schulzer M. Collaborative normal-tension glaucoma study group. Risk factors for progression of visual field abnormalities in normal tension glaucoma. Am J Ophthalmol. 2001; 131: 699–708. [DOI] [PubMed] [Google Scholar]
- 7. Lee EJ,, Kim T-W,, Weinreb RN,, Park KH,, Kim SH,, Kim DM. Trend-based analysis of retinal nerve fiber layer thickness measured by optical coherence tomography in eyes with localized nerve fiber layer defects. Invest Ophthalmol Vis Sci. 2011; 52: 1138–1144. [DOI] [PubMed] [Google Scholar]
- 8. De Moraes CGV,, Juthani VJ,, Liebmann JM,, et al. Risk factors for visual field progression in treated glaucoma. Arch Ophthalmol. 2011; 129: 562–568. [DOI] [PubMed] [Google Scholar]
- 9. Caprioli J,, Mock D,, Bitrian E,, et al. A method to measure and predict rates of regional visual field decay in glaucoma. Invest Ophthalmol Vis Sci. 2011; 52: 4765–4773. [DOI] [PubMed] [Google Scholar]
- 10. Thissen D,, Steinberg L,, Kaung D. Quick and easy implementation of the Benjamini-Hockberg procedure for controlling the false positive rate in multiple comparison. J Educ Behav Stat. 2002; 27: 77–83. [Google Scholar]
- 11. Anderson DR. Automated Static Perimetry 1992. St. Louis: CV Mosby; 1992. [Google Scholar]
- 12. Thomas R,, Paul P,, Muliyil J. Use of pattern standard deviation instead of corrected pattern standard deviation in Anderson's criteria. J Glaucoma. 2000; 9: 480–482. [DOI] [PubMed] [Google Scholar]
- 13. Werner EB,, Berashow J. Peripheral nasal field defect in glaucoma. Ophthalmology. 1979; 86: 1875–1878. [DOI] [PubMed] [Google Scholar]
- 14. Lau LI,, Liu CJ,, Chou JC,, et al. Patterns of visual field defects in chronic angle-closure glaucoma with different disease severity. Ophthalmology. 2003; 110: 1890–1894. [DOI] [PubMed] [Google Scholar]
- 15. Bonomi L,, Marraffa M,, Marchini G,, et al. Perimetric defects after a single acute angle-closure glaucoma attack. Graefes Arch Clin Exp Ophthalmol. 1999; 237: 908–914. [DOI] [PubMed] [Google Scholar]
- 16. Park SC,, De Moraes CG,, Teng CCW,, Tello C,, Liebmann JM,, Ritch R. Initial parafoveal versus peripheral scotomas in glaucoma: risk factors and visual field characteristics. Ophthalmology. 2011; 118: 1782–1789. [DOI] [PubMed] [Google Scholar]
- 17. Sun J,, Zhou X,, Kang Y,, et al. Prevalence and risk factors for primary open-angle glaucoma in a rural northeast China population: a population-based survey in Bin County, Harbin. Eye. 2012; 26: 283–291. [DOI] [PMC free article] [PubMed] [Google Scholar]
- 18. Hulsman CA,, Vingerling JR,, Hofman A,, Witteman JC,, de Jong PT. Blood pressure, arterial stiffness, and open-angle glaucoma: the Rotterdam study. Arch Ophthalmol. 2007; 125: 805–812. [DOI] [PubMed] [Google Scholar]
- 19. Mitchell P,, Lee AJ,, Rochtchina E,, Wang JJ. Open-angle glaucoma and systemic hypertension: the Blue Mountains Eye Study. J Glaucoma. 2004; 13: 319–326. [DOI] [PubMed] [Google Scholar]
- 20. Memarzadeh F,, Ying-Lai M,, Chung J,, Azen SP,, Varma R. Blood pressure perfusion pressure, and open-angle glaucoma: the Los Angeles Latino Eye Study. Invest Ophthalmol Vis Sci. 2010; 51: 2872–2877. [DOI] [PMC free article] [PubMed] [Google Scholar]
- 21. Leske MC,, Heijl A,, Hyman L,, Bengtsson B,, Dong L,, Yang Z. Predictors of long-term progression in the early manifest glaucoma trial. Ophthalmology. 2007; 114: 1965–1972. [DOI] [PubMed] [Google Scholar]
- 22. Leske MC,, Wu SY,, Hennis A,, Honkanen R,, Nemesure B. Risk factors for incident open-angle glaucoma: the Barbados Eye Studies. Ophthalmology. 2008; 115: 85–93. [DOI] [PubMed] [Google Scholar]
- 23. Zhao D,, Cho J,, Kim MH,, Guallar E. The association of blood pressure and primary open-angle glaucoma: a meta-analysis. Am J Ophthalmol. 2014; 158: 615–627. [DOI] [PubMed] [Google Scholar]
- 24. Leske MC,, Connell AM,, Wu SY,, et al. Risk factors for open-angle glaucoma. The Barbados Eye Study. Arch Ophthalmol. 1995; 113: 918–924. [DOI] [PubMed] [Google Scholar]
- 25. Bonomi L,, Marchini G,, Marraffa M,, et al. Vascular risk factors for primary open angle glaucoma: the Egna–Neumarkt Study. Ophthalmology. 2000; 107: 1287–1293. [DOI] [PubMed] [Google Scholar]
- 26. Sung KR,, Cho JW,, Lee S,, et al. Characteristics of visual field progression in medically treated normal-tension glaucoma patients with unstable ocular perfusion pressure. Invest Ophthalmol Vis Sci. 2011; 52: 737–743. [DOI] [PubMed] [Google Scholar]
- 27. Klein BE,, Klein R,, Knudtson MD. Intraocular pressure and systemic blood pressure: longitudinal perspective: the Beaver Dam Eye Study. Br J Ophthalmol. 2005; 89: 284–287. [DOI] [PMC free article] [PubMed] [Google Scholar]
- 28. Xu L,, Wang H,, Wang Y,, et al. Intraocular pressure correlated with arterial blood pressure: the Beijing eye study. Am J Ophthalmol. 2007; 144: 461–462. [DOI] [PubMed] [Google Scholar]
- 29. Hvidberg A,, Kessing SV,, Fernandes A. Effect of changes in CWO2 and body positions on intraocular pressure during general anaesthesia. Acta Ophthalmol (Copenh). 1981; 59: 465–475. [DOI] [PubMed] [Google Scholar]
- 30. Leung H,, Wang JJ,, Rochtchina E,, et al. Relationships between age, blood pressure, and retinal vessel diameters in older population. Invest Ophthalmol Vis Sci. 2003; 44: 2900–2904. [DOI] [PubMed] [Google Scholar]
- 31. Kang JW,, Park B,, Cho BJ. Comparison of risk factors for initial central scotoma versus initial peripheral scotoma in normal-tension glaucoma. Korean J Ophthalmol. 2015; 29: 102–108. [DOI] [PMC free article] [PubMed] [Google Scholar]
- 32. Leske MC,, Heijl A,, Hyman L,, et al. for the EMGT Group. Predictors of long-term progression in the Early Manifest Glaucoma Trial. Ophthalmology. 2007; 114: 1965–1972. [DOI] [PubMed] [Google Scholar]
- 33. Miglior S,, Torri V,, Zeyen T,, et al. for the European Glaucoma Prevention Study (EGPS) Group. Intercurrent factors associated with the development of open-angle glaucoma in the European Glaucoma Prevention Study. Am J Ophthalmol. 2007; 144: 266–275. [DOI] [PubMed] [Google Scholar]
- 34. Suh MH,, Park KH,, Kim HJ,, et al. Glaucoma progression after the first-detected optic disc hemorrhage by optical coherence tomography. J Glaucoma. 2012; 21: 358–366. [DOI] [PubMed] [Google Scholar]
- 35. Siegner SW,, Netland PA. Optic disc hemorrhages and progression of glaucoma. Ophthalmology. 1996; 103: 1014–1024. [DOI] [PubMed] [Google Scholar]
- 36. Ishida K,, Yamamoto T,, Sugiyama K,, et al. Disc hemorrhage is a significantly negative prognostic factor in normal tension glaucoma. Am J Ophthalmology. 2000; 129: 707–714. [DOI] [PubMed] [Google Scholar]
- 37. Jeung JW,, Park KH,, Kim DM,, et al. Optic disc hemorrhage may be associated with retinal nerve fiber loss in otherwise normal eyes. Ophthalmology. 2008; 115: 2132–2140. [DOI] [PubMed] [Google Scholar]
- 38. Quigley HA,, Addicks EM,, Green WR,, Maumenee AE. Optic nerve damage in human glaucoma. II. The site of injury and susceptibility to damage. Arch Ophthalmol. 1981; 99: 635–649. [DOI] [PubMed] [Google Scholar]
- 39. Mayama C,, Suzuki Y,, Araie M,, et al. Myopia and advanced-stage open-angle glaucoma. Ophthalmology. 2002; 109: 2072–2077. [DOI] [PubMed] [Google Scholar]
- 40. Kim JM,, Jeoung JW,, Bitrian E,, et al. Comparison of clinical characteristics between Korean and western normal-tension glaucoma patients. Am J Ophthalmol. 2013; 155: 852–857. [DOI] [PubMed] [Google Scholar]
- 41. Park SH,, Park KH,, Kim JM,, Choi CY. Relation between axial length and ocular parameters. Ophthalmologica. 2010; 224: 188–193. [DOI] [PubMed] [Google Scholar]
- 42. Ferreras A,, Pablo LE,, Garway-Heath DF,, Fogagnolo P,, Garcia-Feijoo J. Mapping standard automated perimetry to the peripheral retinal nerve fiber layer in glaucoma. Invest Ophthalmol Vis Sci. 2008; 49: 3018–3025. [DOI] [PubMed] [Google Scholar]
- 43. Horn FK,, Mardin CY,, Laemmer R,, et al. Correlation between local glaucomatous visual field defects and loss of nerve fiber layer thickness measured with polarimetry and spectral domain OCT. Invest Ophthalmol Vis Sci. 2009; 50: 1971–1977. [DOI] [PubMed] [Google Scholar]
- 44. Jung KI,, Park HY,, Park CK. Characteristics of optic disc morphology in glaucoma patients with parafoveal scotoma compared to peripheral scotoma. Invest Ophthalmol Vis Sci. 2012; 20; 53: 4813–4820. [DOI] [PubMed] [Google Scholar]
- 45. Hood DC,, Raza AS,, de Moraes CG,, et al. Initial arcuate defects within the central 10 degrees in glaucoma. Invest Ophthalmol Vis Sci. 2011; 16; 52: 940–946. [DOI] [PMC free article] [PubMed] [Google Scholar]
- 46. Lee M,, Cho EH,, Lew HM,, Ahn J. Relationship between ocular pulse amplitude and glaucomatous central visual field defect in normal-tension glaucoma. J Glaucoma. 2012; 21: 596–600. [DOI] [PubMed] [Google Scholar]


