Abstract
Background
Term birth is a gestational age from 259 days to 293 days. However trends in mortality according to gestational ages in days have not yet been described in this time period.
Methods and Findings
Based on nation-wide registries, we conducted a population-based cohort study among all children born at term in Denmark from 1997 to 2004 to estimate differences in mortality across gestational ages in days among singletons born at term. We studied early-neonatal mortality, neonatal mortality, infant mortality, and five-year mortality. Children were followed from birth up to the last day of the defined mortality period or December 31, 2009. A total of 360,375 singletons born between 259 and 293 days of gestation were included in the study. Mortality decreased with increasing gestational age in days and the highest mortality was observed among children born at 37 week of gestation. A similar pattern was observed when analyses were restricted to children born to by mothers without pregnancy complications.
Conclusions
This study demonstrates heterogeneity in mortality rates even among singletons born at term. The highest mortality was observed among children born 37 weeks of gestation, which call for cautions when inducing labor in term pregnancies just reaching 37 weeks of gestation. The findings support that 37 weeks of gestation should be defined as early term.
Introduction
The International Classification of Diseases defines a term pregnancy as a delivery between 259 days (37 weeks 0 days) and 293 days (41 weeks 6 days).[1] Increasing evidence indicates that births between 37 weeks 0 days and 38 weeks 6 days are associated with an increased mortality and morbidity[2–6] and redefining “term pregnancy” has therefore been proposed,[5,7,8] for example to classify early-term birth as delivery between 37 weeks 0 day and 38 weeks 6 days, full-term birth as delivery between 39 weeks 0 day through 40 weeks 6 days, and late-term birth as delivery between 41 weeks 0 day through 41 weeks 6 days.[9] To our best knowledge that all the evidences were based on completed gestational week. However, fetal growth and development is rapid and using completed gestational week may be too crude. Little is known about mortality across gestational age measured in days among children born at term.
We conducted a descriptive population-based cohort study to examine trends in all-cause mortality including early-neonatal mortality, neonatal mortality, infant mortality, and five-year mortality according to gestational age measured in days among children born at term (from day 259 through day 293 of gestation). We took maternal morbidity during pregnancy, stillbirth, and congenital malformation into consideration.
Materials and Methods
Ethic Statement
According to Danish law, register-based studies do not require consent from individuals when personal identifiers are encrypted and stored by a trusted third party (Statistic Denmark). This study was approved by the Danish Data Protection Agency (J.nr.2008-41-2680).
Study population
We identified live-born singletons of women giving birth from January 1 1997 to December 31 2004 in Denmark (N = 504,519) according to the Danish Medical Birth Register (DMBR) which includes all births in Denmark since 1973.[10] DMBR holds information on maternal age, maternal parity at birth, gestational age, and birth weight.[10] All live-born children and new residents in Denmark are assigned a unique civil registration number, which we used to link information from several national registries at the individual level.
Gestational age
Information on gestational age was reported in days by the midwife attending the delivery using a mandatory coding sheet.[11] Antenatal care is tax paid in Denmark and ultrasound measurements have been widely used to determine gestational age in nearly all pregnancies since 1995.[12,13] Gestational age was measured based on either early biparietal diameter (BPD) measurement or detailed information on the woman’s last menstrual period (LMP).[14] A discrepancy may exist between gestational age estimated by LMP and BPD [15,16] and a difference between the two methods exceeding 1 or 2 weeks, gestational age estimated from LMP will be “corrected” according to local ultrasound guidelines.[14]
Outcomes: mortality
We explored both short-term and longer-term all-cause mortality rates. Early-neonatal mortality was any death up to 7 days after birth, neonatal mortality was any death up to 28 days after birth, infant mortality was any death up to 365 days after birth, and five-year mortality was any death up to 1825 days after birth.
Covariates
Information on caesarean section was based on the Danish version of the 10th revision (ICD-10: O82) obtained from the National Hospital Register that holds nationwide data on all admissions to any Danish hospital since 1977 and on all outpatient visits since 1995.[17] Data on maternal education and marital status at the time of birth from 1997 through 2004 were obtained from Statistics Denmark. Missing values on maternal education were replaced by available information in the preceding or following five years year. Missing values on marital status were replaced by available information in the preceding or following three years, whichever came first.
Congenital malformations and stillbirth
Information on any congenital malformation obtained from the Danish Hospital Register using ICD-10: Q00 –Q99. Information on stillbirth obtained from the Denmark statistics and the Danish Hospital register.
Maternal morbidity
We identified all hospital records within one year before delivery or within 30 days after delivery except for hospital visit due to prenatal care (ICD10 codes: Z00 –Z99) and delivery (ICD10 codes: O80 –O84).
Statistical Analyses
We used Cox regression model to estimate hazard ratios (HRs) with 95% confidence interval (95% CI). Children were followed from birth, until death, emigration, the end day of the defined mortality period (7, 28, 365, or 1825 days after birth), or December 31 2009, whichever came first to estimate hazard ratios for earl-neonatal mortality, neonatal mortality, infant mortality, and five-year mortality, respectively. Statistical analyses were performed using STATA version 11 (Stata Corp., College Station, Texas, USA).
Mortality by gestational age in days was modelled by using restricted cubic splines with four knots (266 days, 273 days, 280 days, and 287 days) and using 280 days of gestational age as the reference. We performed crude, adjusted, and restricted analyses. In Model 1, results were adjusted for caesarean section (yes or no), maternal age (<25, 25–30, 30–35, > = 35), parity (1, 2, and 3), and birth year (1997–1999, 2000–2002, 2003–2005, and 2006–2008). In Model 2, the results were additionally adjusted for maternal education (low, middle, and high) and maternal cohabitant status during birth (yes, no). Afterwards, we restricted our analyses to pregnancies without any registered morbidity within one year before delivery or within 30 days after delivery using the same adjustments as in Model 2. Finally, we restricted our analyses to children without any congenital malformations.
Sensitivity analyses
In order to know how sensitive when gestational days are grouped as gestational week, we repeated the above analyses by categorizing gestational age in days into week 37 (between 259 and 265 days), week 38 (between 266 and 272 days), week 39 (between 273 and 279 days), week 40 (between 280 and 286 days), and week 41 (between 287 and 293 days). We also explored the distribution of the stillbirth according gestational age in days.
Results
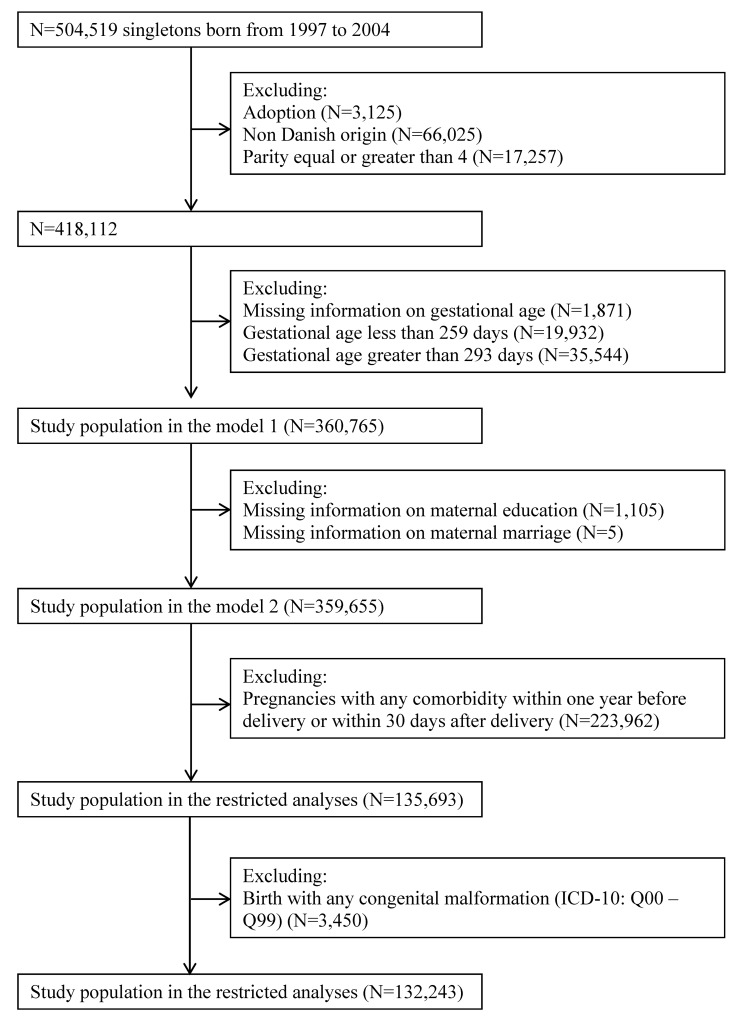
Among live-born singletons born between January 1 1997 and December 31 2004 in Denmark (N = 504,519), we excluded children who were adopted (n = 3,512), singletons whose mothers were not of Danish origin (N = 66,025), maternal parity at birth larger than three (N = 17,257), missing information on gestational age (N = 1,871), gestational age less than 259 days (N = 19,932) or larger than 293 days (N = 35,544) leaving 360,765 singletons in the study population. We also generated a subset of the study population with 359,655 singletons after excluding singletons with missing information on maternal education (N = 1,105) and maternal cohabitant status (N = 5) (Fig 1).
Fig 1. Study population.
A total of 360,375 singletons were born between 259 and 293 days of gestation from 1997 to 2004. The proportion of early term birth (between 37 weeks 0 days and 38 weeks 6 days) increased with birth year while late term birth (between 41 week 0 and 7 days) decreased. The proportion of caesarean section was higher among children born early-term (Table 1).
Table 1. Characteristics of the study population according to completed gestational week.
| Competed gestational week | ||||||||||
|---|---|---|---|---|---|---|---|---|---|---|
| Week 37 | Week 38 | Week 39 | Week 40 | Week 41 | ||||||
| No. | % | No. | % | No. | % | No. | % | No. | % | |
| Gender | ||||||||||
| Boy | 9,923 | 53·14 | 25,315 | 52·08 | 45,733 | 50·69 | 60,415 | 50·18 | 41,943 | 50·62 |
| Girl | 8,750 | 46·86 | 23,296 | 47·92 | 44,496 | 49·31 | 59,979 | 49·82 | 40,915 | 49·38 |
| Caesarean | ||||||||||
| No | 13,904 | 74·46 | 34,073 | 70·09 | 76,873 | 85·20 | 110,009 | 91·37 | 74,104 | 89·43 |
| Yes | 4,769 | 25·54 | 14,538 | 29·91 | 13,356 | 14·80 | 10,385 | 8·63 | 8,754 | 10·57 |
| Parity | ||||||||||
| 1 | 8,926 | 47·80 | 20,266 | 41·69 | 38,898 | 43·11 | 52,478 | 43·59 | 38,467 | 46·43 |
| 2 | 6,939 | 37·16 | 20,301 | 41·76 | 38,101 | 42·23 | 50,220 | 41·71 | 32,734 | 39·51 |
| 3 | 2,808 | 15·04 | 8,044 | 16·55 | 13,230 | 14·66 | 17,696 | 14·70 | 11,657 | 14·07 |
| Maternal age | ||||||||||
| <25 | 2,640 | 14·14 | 6,154 | 12·66 | 11,924 | 13·22 | 15,677 | 13·02 | 10,700 | 12·91 |
| 25- | 6,950 | 37·22 | 17,309 | 35·61 | 33,901 | 37·57 | 46,037 | 38·24 | 31,719 | 38·28 |
| 30- | 6,310 | 33·79 | 17,391 | 35·78 | 31,995 | 35·46 | 42,995 | 35·71 | 29,629 | 35·76 |
| 35- | 2,773 | 14·85 | 7,757 | 15·96 | 12,409 | 13·75 | 15,685 | 13·03 | 10,810 | 13·05 |
| Birth year | ||||||||||
| 1997 | 2,020 | 10·82 | 5,435 | 11·18 | 11,391 | 12·62 | 16,674 | 13·85 | 11,113 | 13·41 |
| 1998 | 2,134 | 11·43 | 5,416 | 11·14 | 10,882 | 12·06 | 15,893 | 13·20 | 11,052 | 13·34 |
| 1999 | 2,124 | 11·37 | 5,461 | 11·23 | 11,099 | 12·30 | 15,417 | 12·81 | 10,941 | 13·20 |
| 2000 | 2,371 | 12·70 | 5,980 | 12·30 | 11,845 | 13·13 | 15,262 | 12·68 | 10,566 | 12·75 |
| 2001 | 2,294 | 12·29 | 5,953 | 12·25 | 11,057 | 12·25 | 14,631 | 12·15 | 10,298 | 12·43 |
| 2002 | 2,423 | 12·98 | 6,241 | 12·84 | 11,058 | 12·26 | 14,118 | 11·73 | 9,911 | 11·96 |
| 2003 | 2,571 | 13·77 | 6,779 | 13·95 | 11,290 | 12·51 | 14,191 | 11·79 | 9,787 | 11·81 |
| 2004 | 2,736 | 14·65 | 7,346 | 15·11 | 11,607 | 12·86 | 14,208 | 11·80 | 9,190 | 11·09 |
| Maternal education | ||||||||||
| Low | 4,505 | 24·13 | 10,998 | 22·62 | 19,718 | 21·85 | 25,998 | 21·59 | 17,575 | 21·21 |
| Middle | 7,239 | 38·77 | 18,744 | 38·56 | 34,590 | 38·34 | 45,472 | 37·77 | 30,835 | 37·21 |
| High | 6,848 | 36·67 | 18,722 | 38·51 | 35,632 | 39·49 | 48,574 | 40·35 | 34,210 | 41·29 |
| Missing | 81 | 0·43 | 147 | 0·30 | 289 | 0·32 | 350 | 0·29 | 238 | 0·29 |
| Marriage | ||||||||||
| Others | 8,915 | 47·74 | 21,694 | 44·63 | 40,687 | 45·09 | 54,057 | 44·90 | 37,562 | 45·33 |
| Married | 9,758 | 52·26 | 26,916 | 55·37 | 49,541 | 54·91 | 66,334 | 55·10 | 45,295 | 54·67 |
| Missing | 0 | 0·00 | 1 | 0·00 | 1 | 0·00 | 3 | 0·00 | 1 | 0·00 |
| Comorbidity | ||||||||||
| No | 5,842 | 31·29 | 16,863 | 34·69 | 35,046 | 38·84 | 47,324 | 39·31 | 30,993 | 37·40 |
| Yes | 12,831 | 68·71 | 31,748 | 65·31 | 55,183 | 61·16 | 73,070 | 60·69 | 51,865 | 62·60 |
| Stillbirth | ||||||||||
| Yes | 131 | 127 | 128 | 179 | 155 | |||||
| Missing | 1 | 2 | 2 | 3 | 3 | |||||
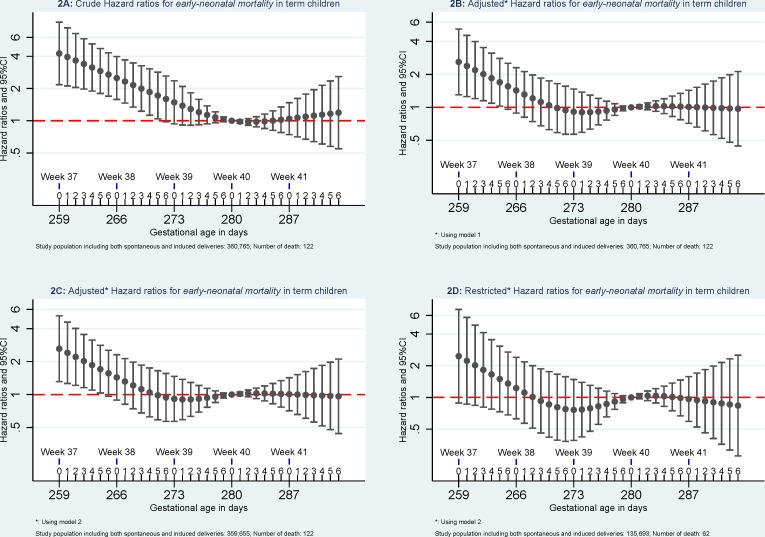
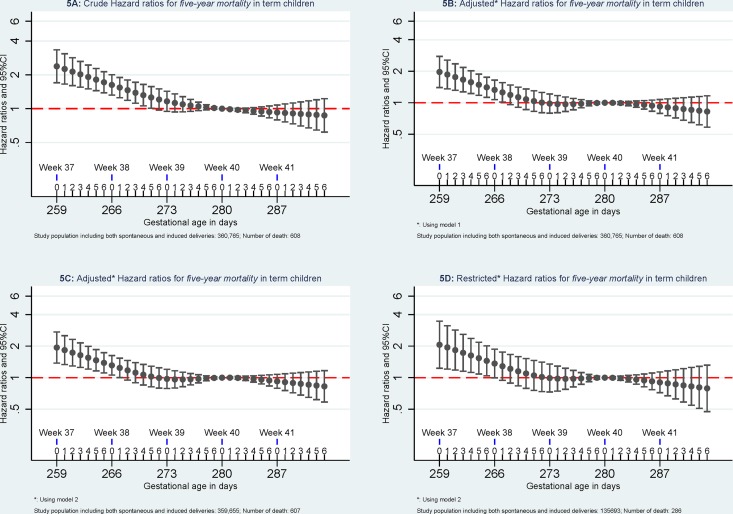
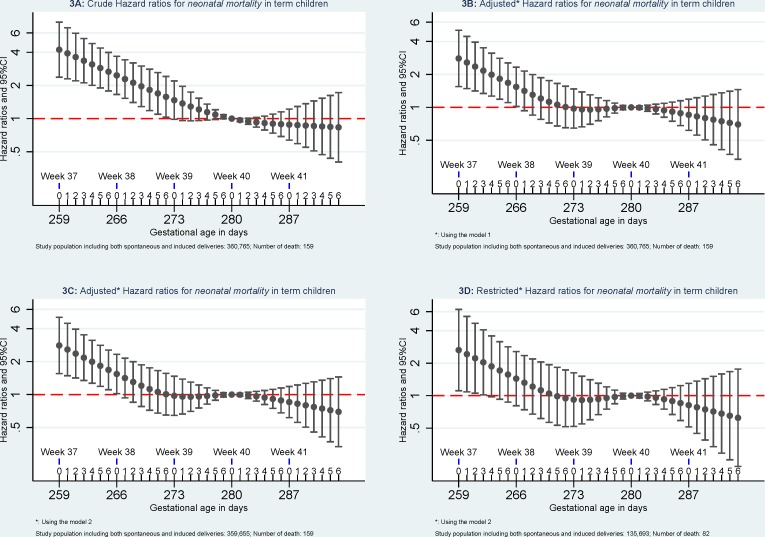
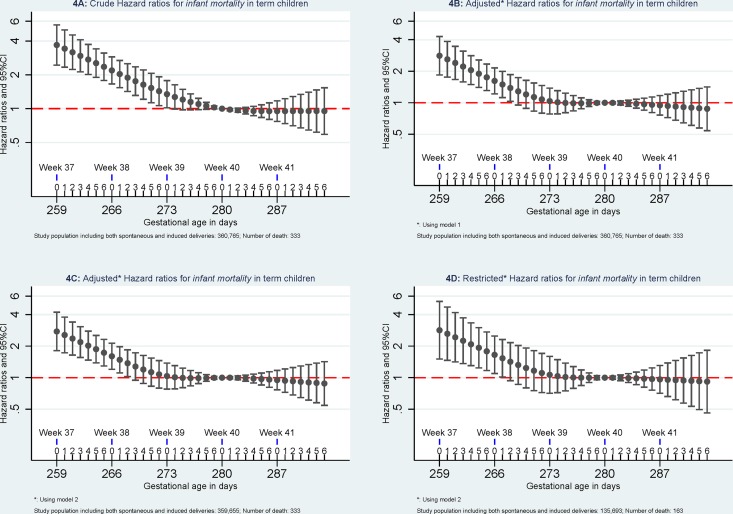
Compared to mortality of singletons born at 280 days of gestational age, the highest mortality was found among singletons born at week 37 of gestational age. Mortality decreased with increasing gestational age in days until 280 days of gestation. (Figs 2–5).
Fig 2. Hazard ratios for early neonatal mortality.
Model 1: the results were adjusted for caesarean section (yes or no), maternal age (<25, 25–30, 30–35, > = 35), parity (1, 2, and 3), and birth year (1997–1999, 2000–2002, 2003–2005, and 2006–2008). Model 2, the results were additionally adjusted for maternal education (low, middle, and high) and maternal cohabitant status during birth (yes, no). Restricted analyses: the analyses were restricted to pregnancies without registered morbidity within one year before delivery or within 30 days after delivery using the same adjustments in Model 2.
Fig 5. Hazard ratios for five-year mortality.
Model 1: the results were adjusted for caesarean section (yes or no), maternal age (<25, 25–30, 30–35, > = 35), parity (1, 2, and 3), and birth year (1997–1999, 2000–2002, 2003–2005, and 2006–2008). Model 2, the results were additionally adjusted for maternal education (low, middle, and high) and maternal cohabitant status during birth (yes, no). Restricted analyses: the analyses were restricted to pregnancies without registered morbidity within one year before delivery or within 30 days after delivery using the same adjustments in Model 2.
Fig 3. Hazard ratios for neonatal mortality.
Model 1: the results were adjusted for caesarean section (yes or no), maternal age (<25, 25–30, 30–35, > = 35), parity (1, 2, and 3), and birth year (1997–1999, 2000–2002, 2003–2005, and 2006–2008). Model 2, the results were additionally adjusted for maternal education (low, middle, and high) and maternal cohabitant status during birth (yes, no). Restricted analyses: the analyses were restricted to pregnancies without registered morbidity within one year before delivery or within 30 days after delivery using the same adjustments in Model 2.
Fig 4. Hazard ratios for infant mortality.
Model 1: the results were adjusted for caesarean section (yes or no), maternal age (<25, 25–30, 30–35, > = 35), parity (1, 2, and 3), and birth year (1997–1999, 2000–2002, 2003–2005, and 2006–2008). Model 2, the results were additionally adjusted for maternal education (low, middle, and high) and maternal cohabitant status during birth (yes, no). Restricted analyses: the analyses were restricted to pregnancies without registered morbidity within one year before delivery or within 30 days after delivery using the same adjustments in Model 2.
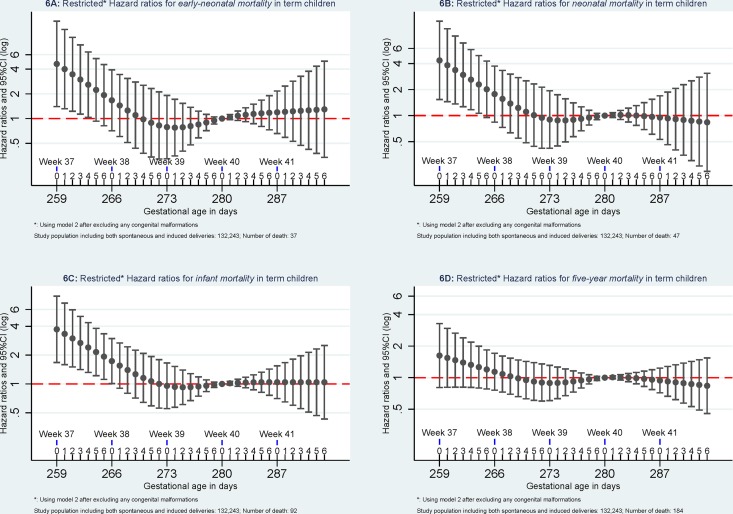
When excluding pregnancies with any morbidity within one year before delivery or within 30 days after delivery, early-neonatal mortality and neonatal mortality attenuated and were no longer significant but similar patterns were observed for infant mortality and five-year mortality. When further excluding children with congenital malformation, mortality at 37 of gestation remained significant higher for early-neonatal mortality, neonatal mortality, and infant mortality but not for five-year mortality (Fig 6).
Fig 6. Mortality after excluding pregnancies with any maternal diseases and children with any congenital malformations.
The analyses were done using Model 2 and excluding pregnancies without registered morbidity within one year before delivery or within 30 days after delivery and excluding children with any registered congenital malformations.
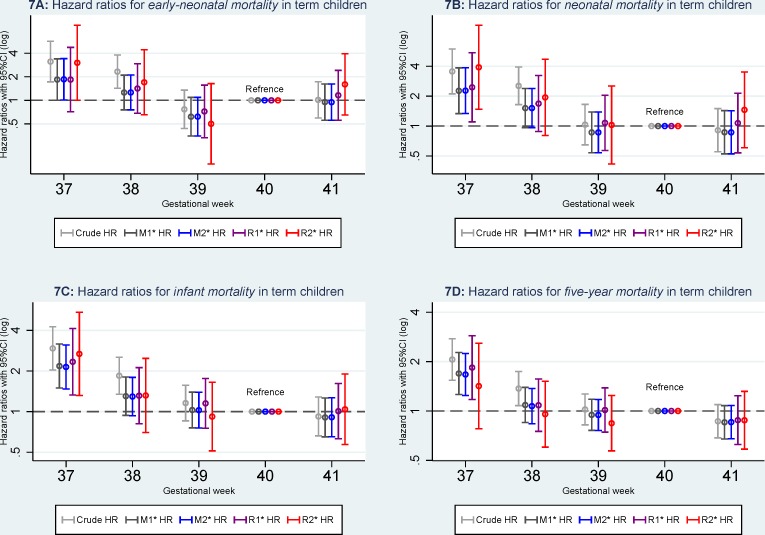
When gestational age in days was categorized as week, an increased mortality remained higher (Fig 7) for children born week 37 for early-neonatal mortality (HR3.02, 95%CI: 1.00–9.09), neonatal mortality (HR = 3.91, 95%CI: 1.48–10.33), and infant mortality (HR = 2.68, 95%CI: 1.31–5.45) even excluding children born with any congenital malformations but not for five-year mortality (HR = 1.42, 95%CI: 0.78–2.59).
Fig 7. Hazard ratios for mortality according to gestational age in weeks.
M1: Model 1, the results were adjusted for caesarean section (yes or no), maternal age (<25, 25–30, 30–35, > = 35), parity (1, 2, and 3), and birth year (1997–1999, 2000–2002, 2003–2005, and 2006–2008). M2: model 2, the results were additionally adjusted for maternal education (low, middle, and high) and maternal cohabitant status during birth (yes, no). R1: Restricted analyses 1, the analyses were restricted to pregnancies without registered morbidity within one year before delivery or within 30 days after delivery using the same adjustments in Model 2. R2: Restricted analyses 2: the analyses were further restricted to pregnancies without registered morbidity within one year before delivery or within 30 days after delivery and children without any registered congenital malformations using the same adjustments in Model 2.
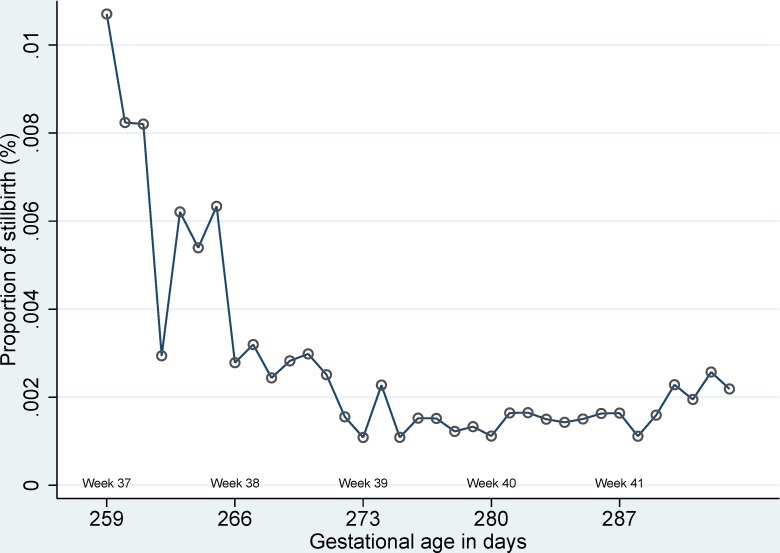
Information on gestational age was obtained for 1,527 stillbirth out of a total of 1,549 stillbirths (98.6%) from 1997 to 2004. A total of 720 (47.2%) of term stillbirths took place between 37 and 41 of gestational week and 11 out of 720 stillbirth only had information on completed gestational week but missing data on gestational days.). The highest proportion of stillbirth was observed at 37 of gestational age (Fig 8).
Fig 8. Proportion of stillbirth according to gestational age in days.
Discussion
The highest risk of death was observed for children born at week 37 of gestational week. Both short-term and long-term mortality decreased with increasing gestational age in days.
When gestational age in days was classified as gestational week, the mortality for children born at 37-gestataion was higher compared to later-term birth[4,6,18,19] but we did not observe an increased mortality for children born at 38-gestataion. Therefore, classifying both 37 and 38 weeks of gestation as early-term will hide the true underlying mortality for children born in week 37.
A spontaneous childbirth before its optimal due date has reasons it could be diseases in the mother or the child to explain the increased child mortality.[20] The attenuation of mortality when pregnancies with any morbidity before and during pregnancy were excluded shown as expected that maternal morbidity affect mortality in the offspring. However, short term (including early-neonatal, neonatal, and infant) mortality remained higher but not for long-term (five-year) morality after excluding pregnancies with any registered morbidity within one year before delivery or within 30 days after delivery and excluding births with any congenital malformations, which could indicate that the timing of birth is a risk factor in itself and it is independently associated with at least short term mortality. Therefore, using the label ‘early term’ for babies being born in 37 week may give a most justified message.
We had almost complete follow-up and selection bias does not explain the results. The trend of stillbirth also decreased with increasing gestational age and highest risk of stillbirth was also observed at 37 of gestational week. We could adjust for several potential confounders but not for maternal smoking, maternal body mass index, but restricting analyses among pregnancies without any comorbidity should reflect true mortality of children born to healthy or health-conscious pregnancies.
Pregnancies with parity equal or bigger than four may be different in many ways compared to pregnancies with parities smaller than four. In order to disentangle when gestational age is independently associated with mortality, we excluded any pregnancies with parity equal or bigger than four, therefore, the findings may not necessarily reflect this population.
Conclusions
This study shows heterogeneity in mortality rates among singletons born at term according to gestational age in days. The highest mortality and stillbirth was observed in children born at 37 weeks of gestation, therefore, 37 weeks of gestational age should be categorized as early term birth. Gestational age is independently associated with short term mortality but longer follow-up is needed to observer if gestational age is independently associated with long-term mortality.
Data Availability
This national cohort study was based on data from the Danish Medical Birth Register (MBR). According to Danish law and Data Protect Agency, the authors are not able to share the register data used in this study with other researchers. The register is kept by the above mentioned institutions and not by any one individual person. Therefore readers may only contact the institutions—Statistics Denmark, Sejrøgade 11, DK-2100 Copenhagen (www.dst.dk)—The Danish Data Protection Agency, Borgergade 28, 5, 1300 Copenhagen. However, there is limited information on the register in Danish can be found from the following link: http://www.ssi.dk/Sundhedsdataogit/Registre%20og%20kliniske%20databaser/De%20nationale%20sundhedsregistre/Graviditet%20fodsler%20born/Fodselsregister.aspx.
Funding Statement
Chun Sen Wu is supported by the individual postdoctoral grants from the Danish Medical Research Council (FSS: 12-32232). Access to data was supported by European Research Council (ERC-2010-StG-260242-PROGEURO). The funders had no role in study design, data collection and analysis, decision to publish, or preparation of the manuscript.
References
- 1.(2013) World Health Organization. ICD-10: International Statistical Classification of Diseases and Related Health Problems, Tenth Revision: Volume 2: Second Edition.
- 2. Moster D, Wilcox AJ, Vollset SE, Markestad T, Lie RT (2010) Cerebral palsy among term and postterm births. JAMA 304: 976–982. 304/9/976 [pii]; 10.1001/jama.2010.1271 [DOI] [PMC free article] [PubMed] [Google Scholar]
- 3. Fang YM, Guirguis P, Borgida A, Feldman D, Ingardia C, Herson V (2013) Increased neonatal morbidity despite pulmonary maturity for deliveries occurring before 39 weeks. J Matern Fetal Neonatal Med 26: 79–82. 10.3109/14767058.2012.728647 [DOI] [PubMed] [Google Scholar]
- 4. Crump C, Sundquist K, Winkleby MA, Sundquist J (2013) Early-term birth (37–38 weeks) and mortality in young adulthood. Epidemiology 24: 270–276. 10.1097/EDE.0b013e318280da0f [DOI] [PubMed] [Google Scholar]
- 5. Engle WA (2011) Morbidity and mortality in late preterm and early term newborns: a continuum. Clin Perinatol 38: 493–516. S0095-5108(11)00060-1 [pii]; 10.1016/j.clp.2011.06.009 [DOI] [PubMed] [Google Scholar]
- 6. Zhang X, Kramer MS (2009) Variations in mortality and morbidity by gestational age among infants born at term. J Pediatr 154: 358–62, 362. S0022-3476(08)00781-6 [pii]; 10.1016/j.jpeds.2008.09.013 [DOI] [PubMed] [Google Scholar]
- 7. Clark SL, Fleischman AR (2011) Term pregnancy: time for a redefinition. Clin Perinatol 38: 557–564. S0095-5108(11)00065-0 [pii]; 10.1016/j.clp.2011.06.014 [DOI] [PubMed] [Google Scholar]
- 8. Wetta L, Tita AT (2012) Early term births: considerations in management. Obstet Gynecol Clin North Am 39: 89–97. S0889-8545(11)00125-2 [pii]; 10.1016/j.ogc.2011.12.002 [DOI] [PubMed] [Google Scholar]
- 9. Spong CY (2013) Defining "term" pregnancy: recommendations from the Defining "Term" Pregnancy Workgroup. JAMA 309: 2445–2446. 1685467 [pii]; 10.1001/jama.2013.6235 [DOI] [PubMed] [Google Scholar]
- 10. Knudsen LB, Olsen J (1998) The Danish Medical Birth Registry. Dan Med Bull 45: 320–323. [PubMed] [Google Scholar]
- 11.[Anonymous] (2013) Documentation for the Danish Medical Birth Register in Danish (http://www.ssi.dk/Sundhedsdataogit/Registre%20og%20kliniske%20databaser/De%20nationale%20sundhedsregistre/Graviditet%20fodsler%20born/Fodselsregister.aspx).
- 12. Jorgensen FS (1999) Epidemiological studies of obstetric ultrasound examinations in Denmark 1989–1990 versus 1994–1995. Acta Obstet Gynecol Scand 78: 305–309. [DOI] [PubMed] [Google Scholar]
- 13. Kristensen FB (1992) Antenatal care in Denmark. Assessments of program, staff competence, compliance, and outcome. Int J Technol Assess Health Care 8 Suppl 1: 25–32. [DOI] [PubMed] [Google Scholar]
- 14. Kristensen J, Langhoff-Roos J, Skovgaard LT, Kristensen FB (1996) Validation of the Danish Birth Registration. J Clin Epidemiol 49: 893–897. 0895-4356(96)00018-2 [pii]. [DOI] [PubMed] [Google Scholar]
- 15. Nguyen T, Larsen T, Engholm G, Moller H (2000) A discrepancy between gestational age estimated by last menstrual period and biparietal diameter may indicate an increased risk of fetal death and adverse pregnancy outcome. BJOG 107: 1122–1129. [DOI] [PubMed] [Google Scholar]
- 16. Nguyen TH, Larsen T, Engholm G, Moller H (1999) Evaluation of ultrasound-estimated date of delivery in 17,450 spontaneous singleton births: do we need to modify Naegele's rule? Ultrasound Obstet Gynecol 14: 23–28. 10.1046/j.1469-0705.1999.14010023.x [DOI] [PubMed] [Google Scholar]
- 17. Andersen TF, Madsen M, Jorgensen J, Mellemkjoer L, Olsen JH (1999) The Danish National Hospital Register. A valuable source of data for modern health sciences. Dan Med Bull 46: 263–268. [PubMed] [Google Scholar]
- 18. Donovan EF, Besl J, Paulson J, Rose B, Iams J (2010) Infant death among Ohio resident infants born at 32 to 41 weeks of gestation. Am J Obstet Gynecol 203: 58–5. S0002-9378(10)00101-8 [pii]; 10.1016/j.ajog.2010.01.071 [DOI] [PubMed] [Google Scholar]
- 19. Reddy UM, Bettegowda VR, Dias T, Yamada-Kushnir T, Ko CW, Willinger M (2011) Term pregnancy: a period of heterogeneous risk for infant mortality. Obstet Gynecol 117: 1279–1287. 10.1097/AOG.0b013e3182179e28;00006250-201106000-00005 [pii]. [DOI] [PMC free article] [PubMed] [Google Scholar]
- 20. Spong CY, Mercer BM, D'alton M, Kilpatrick S, Blackwell S, Saade G (2011) Timing of indicated late-preterm and early-term birth. Obstet Gynecol 118: 323–333. 10.1097/AOG.0b013e3182255999 [DOI] [PMC free article] [PubMed] [Google Scholar]
Associated Data
This section collects any data citations, data availability statements, or supplementary materials included in this article.
Data Availability Statement
This national cohort study was based on data from the Danish Medical Birth Register (MBR). According to Danish law and Data Protect Agency, the authors are not able to share the register data used in this study with other researchers. The register is kept by the above mentioned institutions and not by any one individual person. Therefore readers may only contact the institutions—Statistics Denmark, Sejrøgade 11, DK-2100 Copenhagen (www.dst.dk)—The Danish Data Protection Agency, Borgergade 28, 5, 1300 Copenhagen. However, there is limited information on the register in Danish can be found from the following link: http://www.ssi.dk/Sundhedsdataogit/Registre%20og%20kliniske%20databaser/De%20nationale%20sundhedsregistre/Graviditet%20fodsler%20born/Fodselsregister.aspx.


