Abstract
Sublethal levels of oxidative stress are commonly associated with various pathophysiological conditions. Cardiomyocytes have the highest content of mitochondria among all cell types, allowing the study of mitochondria in cells surviving oxidative stress and address whether nuclear factor–erythroid-derived 2–related factor 2 (Nrf2) can reverse these changes. Mitochondria normally exist in elaborated networks, which were replaced by predominately individual punctuate mitochondria 24 h after exposure to a nonlethal dose of H2O2. Electron microscopy revealed that cells surviving H2O2 show swelling of mitochondria with disorganized cristae and areas of condensation. Measurements of functional mitochondria showed a H2O2 dose-dependent decrease over a course of 5 d. At the protein and mRNA levels, cells surviving H2O2 treatment show a reduction of mitochondrial components, cytochrome c, and cytochrome b. Nrf2 overexpression prevented H2O2 from inducing mitochondria morphologic changes and reduction of cytochrome b/c. Although Nrf2 is known as a transcription factor regulating antioxidant and detoxification genes, Nrf2 overexpression did not significantly reduce the level of protein oxidation. Instead, Nrf2 was found to associate with the outer mitochondrial membrane. Mitochondria prepared from the myocardium of Nrf2 knockout mice are more sensitive to permeability transition. Our data suggest that Nrf2 protects mitochondria from oxidant injury likely through direct interaction with mitochondria.—Strom, J., Xu, B., Tian, X., Chen, Q. M. Nrf2 protects mitochondrial decay by oxidative stress.
Keywords: cell survival, loss of mitochondria, transcription factor, mitochondrial outer membrane
An elevated level of oxidative stress has been detected in association with a number of heart diseases, particularly myocardial infarction (MI). MI, most commonly resulting from coronary artery blockage, causes an impaired metabolic function of the mitochondria and inactivation of superoxide dismutase and glutathione peroxidase, resulting in an elevated level of H2O2 in the ischemic region of the myocardium. With experimental animals, H2O2 concentration reaches 4 to 6 μM in the ischemic heart (1). Although current medical technology allows quick rescue of ischemia by angioplasty-based percutaneous coronary intervention, ∼35% of patients experience periprocedural myocardial injury and have an increased risk of subsequent MI (2, 3). This is related to the fact that reperfusion enhances oxidant generation through abnormal mitochondrial function as well as activation of xanthine oxidase. The level of H2O2 increases to 11–13 μM in the myocardium of experimental animals during reperfusion (1). In addition to H2O2, hydroxyl radicals and superoxide have been detected in the myocardium (1, 4–6). The myocardium surviving ischemia and reperfusion undergoes repair and remodeling, rooted to changes occurring at the cellular and molecular levels. Although the mitochondria have been studied extensively as an important regulator of cell death, the role of mitochondria in cells surviving oxidative stress has not been addressed.
Mammalian cells contain innate defense systems that are capable of combating damage and promoting cell survival. Whereas oxidants at high levels can overwhelm the defense systems, damage macromolecules, and ultimately result in cell death, the majority of cells can survive with low to mild doses of oxidants (7). We have found that cardiomyocytes surviving oxidative stress later develop hypertrophy, with enlarged cell size, increased protein content, and expression of biomarkers of heart failure (7, 8). Early in the time course after cells survive oxidative stress, elevation of nuclear factor–erythroid-derived 2–related factor 2 (Nrf2) protein and activation of Nrf2 transcription factor have been observed (9, 10).
Nrf2 is a basic leucine zipper transcription factor that acts as a master regulator of antioxidant defenses. It is commonly known that Nrf2 translocates to the nucleus upon activation by oxidative or electrophilic stress, where Nrf2 binds to the antioxidant response element in the promoter of several antioxidant and detoxification genes, such as superoxide dismutase 1, glutathione transferases, glutamate cysteine ligase, and heme oxygenase-1 (HO-1). Overexpression of Nrf2 has been demonstrated to be cytoprotective in multiple tissues, whereas knockout (KO) of Nrf2 has been shown to increase the sensitivity to tissue injuries (11–15). Despite the fact that many types of tissue injuries involve damage to the mitochondria, whether Nrf2 protects mitochondria from damage is not known. Cardiomyocytes contain the highest content of mitochondria among all cell types (16), providing a valid experimental system to study the response of mitochondria during cell survival. Here we address the impact of oxidative stress on mitochondria in cardiomyocytes and whether elevation of Nrf2 serves to protect mitochondria in cardiomyocytes.
MATERIALS AND METHODS
Cell culture and H2O2 treatment
Cardiomyocytes were prepared from 1- to 2-d-old newborn rats as described previously (7). Cells were seeded at a density of 0.3 × 10⁶ cells per well in 6-well plates or 2.5 × 10⁶ cells per 100 mm dish. Freshly isolated cells were cultured in low glucose DMEM containing 10% fetal bovine serum (FBS) and 1% penicillin/streptomycin for 3 d. Cells were placed in 0.5% FBS/DMEM for 24 h prior to 2 h treatment with H2O2 (50–400 μM). After 2 h H2O2 treatment, culture medium was changed to fresh 10% FBS/DMEM. H2O2 preconditioning was achieved by a 10 min pretreatment with 100 μM H2O2 followed by 1 h recovery in fresh 0.5% FBS/DMEM before subsequent H2O2 treatments.
Fluorescence staining of mitochondria
Cells grown on glass coverslips were stained with MitoTracker Deep Red (Thermo Fisher Scientific, Waltham, MA, USA) for fluorescent microscopy. After incubation with MitoTracker dye diluted in DMEM at a concentration of 200 nM for 30 min under culture condition, cells were fixed with formalin for mounting on glass slides. Images were acquired under an Olympus (Tokyo, Japan) BX53 microscope with an attached DP72 digital camera.
For mitochondrial membrane potential measurements, cells grown in 6-wells plates were washed with PBS and stained with MitoTracker Orange CMTMRos dye (Thermo Fisher Scientific)diluted in DMEM at a concentration of 200 nM for 30 min under culture conditions. The fluorescence was detected using a BioTek Synergy 2 plate reader with 550Ex/575Em filters (BioTek Instruments, Winooski, VT, USA). Following fluorescence quantification, cells were lysed and protein content was determined by Bradford assay (Bio-Rad, Hercules, CA, USA) for expression of relative fluorescent unit over protein concentration.
Electron microscopy
Cells were fixed with phosphate-buffered 2.5% glutaraldehyde (pH 7.4) for 4 h followed by postfixation with 1% OsO4 for 1 h. Fixed cells were dehydrated and resin embedded for standard electron microscopy procedures as described previously (17).
Western blot analyses
Cell lysates were obtained by scraping cells in lysis buffer (1% Triton X-100, 150 mM NaCl, 0.1% SDS, 0.5% sodium deoxycholate, 50 mM Tris, pH 8.0) with freshly added protease inhibitors (Sigma-Aldrich, St. Louis, MO, USA). Protein concentrations were measured using the Bradford method (Bio-Rad) or bicinchoninic acid assay (Pierce, Rockford, IL, USA). Proteins were separated by SDS-PAGE and were transferred to PVDF membrane (10). Western blot was performed using antibodies for Nrf2, cytochrome b, bcl-xL, OPA1, GAPDH, VDAC, β-actin (Santa Cruz Biotechnology, Santa Cruz, CA, USA), Nrf2, vinculin (VCL), TATA binding protein (Abcam, Cambridge, MA, USA), and cytochrome c (Cell Signaling Technology, Danvers, MA, USA). Secondary antibodies conjugated with horseradish peroxidase (Santa Cruz Biotechnology) were used for enhanced chemiluminescence reaction. VCL protein levels were found stable under the conditions tested and were used as a loading control for whole-cell lysates. GAPDH (cytosolic), ND2 (mitochondrial), OPA1 (inner mitochondrial membrane), Bcl-xL [outer mitochondrial membrane (OMM)] and TATA binding protein (nuclear) are proteins predominately localized to specific cellular compartments, were used to assess purity of subcellular fractions. Protein bands from Western blot analyses were quantified by densitometry using ImageJ (National Institutes of Health, Bethesda, MD, USA) software for graphical representation. Each protein band was normalized against the corresponding loading control protein band.
Real-time RT-PCR
Total RNA extracted using Trizol was used as a template for RT-PCR. cDNA syntheses were performed using a commercial cDNA synthesis kit (Thermo Fisher Scientific) with random hexamers. PCR primers were purchased from Sigma with the sequences of 5′-GCAGCTTAACATTCCGCCCAATCA-3′ (forward) and 5′-TACTGGTTGGCCTCCGATTCATGT-3′ (reverse) for cytochrome b; 5′-ACAATGTTTTTGTTGGACAGCCCCG-3′ (forward) and 5′-TGAAGCACGGGTGAGTCTTCTTG-3′ (reverse) for cytochrome c; 5′-AGCCATGTACGTAGCCATCC-3′ (forward) and 5′-CTCTCAGCTGTGGTGGTGAA-3′ (reverse) for β-actin; 5′-TCAACTTTCGATGGTAGTCGCCGT-3′ (forward) and 5′-TCCTTGGATGTGGTAGCCGTTTCT-3′ (reverse) for 18S rRNA; and 5′-TGACTCTACCCACGGCAAGTT-3′ (forward) and 5′-ACGACATACTCAGCACCAGCA-3′ (reverse) for GAPDH. Quantitative real-time PCR was performed with the CFX96 Thermal Cycler (Bio-Rad) and Cyber Green dye (Fermentas). Real-time PCR was performed with initial denaturation at 95°C for 10 min and 40 cycles of 95°C for 15 s for denaturation, 60°C for 30 s for annealing and 72°C for 30 s for extension. Melting curve analysis was performed at the end of PCR to verify the specificity of the product. Bio-Rad CFX Manager software was used for data analyses. The expression values were calculated as RQgene = Egene^(CT(control) − CT(sample)), NEsample = RQsample/(RQreference 1 × RQreference × … × RQreference n)(1/n), where E = efficiency of primer set, calculated as (% efficiency × 0.01) + 1, where 100% efficiency = 2, RQ is relative quantity, and NE is normalized expression.
Adenovirus-mediated Nrf2 overexpression
Replication-deficient Nrf2, dominant-negative (DN) Nrf2, and empty vector adenovirus were a kind gift from Dr. Jeffrey Johnson (University of Wisconsin, Madison, WI, USA). Cells were transduced at a multiplicity of infection of 100. Cells were incubated with the adenovirus in 10% FBS/DMEM for 4 h at 37°C, followed by 24 h culture in fresh 10% FBS/DMEM for 24 h. The adenovirus contains a green fluorescence protein (GFP) protein, allowing us to examine the transducing efficiency. Approximately 90% cells were positive with GFP prior to H2O2 treatment or various measurements.
3-(4,5-Dimethyl-2-thiazolyl)-2,5-diphenyl-2H-tetrazolium bromide assay
3-(4,5-Dimethyl-2-thiazolyl)-2,5-diphenyl-2H-tetrazolium bromide (MTT) is reduced to a blue formazan by mitochondrial succinate dehydrogenase. With cells plated in 24-well culture dishes, 200 µl of 5 mg/ml MTT was added to each well for 2 h incubation in the dark under culture conditions. Following washes with PBS, the formazan product was dissolved in an isopropanol solvent containing 0.1 M HCl and 1% Triton X-100 for measurements at wavelength 590 nm with a reference wavelength of 630 nm using a BioTek Synergy 2 plate reader.
Protein carbonyl assay
A colorimetric protein carbonyl assay kit was used according to manufacturer’s specifications (Cayman Chemicals, Ann Arbor, MI, USA). Briefly, cells were collected in ice-cold homogenization buffer (50 mM phosphate, pH 6.7, 1 mM EDTA). Following a brief sonication, cell lysates were centrifuged at 10,000 g for 15 min at 4°C. Aliquots of cell lysates were incubated with 2,4-dinitrophenylhydrazine (DNPH) or 2.5 M HCl (control) for 1 h in the dark. Protein was precipitated by addition of 20% trichloroacetic acid and centrifugation at 10,000 g for 10 min. Following washes with 10% trichloroacetic acid and ethanol/ethyl acetate, protein pellets were resuspended in guanidine hydrochloride. Absorbance at a wavelength of 370 nm was measured using BioTek Synergy 2 plate reader. Absorbance of the DNPH sample was subtracted from the corresponding control of each cell lysate to generate corrected absorbance. Protein carbonyl concentration was calculated using the extinction coefficient for DNPH of 0.022 μM−1 cm−1.
Subcellular fractionation
Cells in culture were collected in fractionation buffer (250 mM sucrose, 20 mM HEPES pH 7.4, 1 mM EGTA, 1 mM EDTA, 1.5 mM MgCl2, 10 mM KCl, 1 mM DTT). After homogenization using a glass dounce and passing through a 25-gauge needle 10 times, cell lysates were centrifuged at 800 g for 5 min to collect nuclear fraction. The supernatant was centrifuged at 10,000 g for 10 min for collection of mitochondrial fractions. The supernatant constituted the cytosolic fraction, which was purified by second centrifugation at 10,000 g for 10 min. The nuclear and mitochondria fractions in pellets were resuspended in the lysis buffer for passing through a 25-gauge needle 10 times again before second centrifugation at 800 or 10,000 g, respectively. The nuclear and mitochondrial pellets were resuspended in the lysis buffer for measurements of protein concentrations by the Bradford assay (Bio-Rad) along with the cytosolic fraction.
To isolate mitochondria from animal tissues, excised rat hearts or livers were washed in Mg2+ and Ca2+-free PBS, minced in homogenization buffer (250 mM sucrose, 10 mM MOPS-pH 7.4, 1 mM EGTA, 2 mM MgCl2, 0.1% bovine serum albumin) and briefly homogenized using a glass dounce. The homogenized mixture was centrifuged twice at 800 g for 5 min to remove the nuclear fraction. The supernatant was collected and centrifuged twice at 10,000 g for 10 min for collection of mitochondrial fraction. All procedures were performed on ice.
The submitochondrial fractions were obtained from isolated mitochondria after suspension in 10 mM KH2PO4 (pH 7.4) for 15 min, followed by addition of an equal volume of mitochondrial fractionation buffer [32% (w/v) sucrose, 30% (w/v) glycerol, 10 mM MgCl2, 10 mM KH2PO4 (pH 7.4)]. Following another 15 min incubation, the suspension was sonicated twice for 15 s with a 1 min interval. The suspension was centrifuged at 12,000 g for 10 min at 4°C for separation of the supernatant and pellet. The pellet was resuspended in homogenization buffer (250 mM sucrose, 10 mM MOPS-pH 7.4, 1 mM EGTA, 2 mM MgCl2, 0.1% bovine serum albumin). The pellet and supernatant fractions were loaded on separate discontinuous sucrose gradients composed of 2 ml each of 25, 37.5, and 50% (w/v) sucrose in 10 mM KH2PO4 (pH 7.4) and centrifuged in a type 90Ti rotor at 210,000 g for 3 h at 4°C. The OMM fraction was collected at the 25/37.5% interface of the gradient loaded with the supernatant. The mitoplast fraction was collected as the pellet from the gradient loaded with the pellet suspension. The OMM and mitoplast fractions were washed with homogenization buffer and centrifuged at 160,000 g for 1 h or at 12,000 g for 10 min, respectively. All steps were performed on ice or at 4°C.
Immunocytochemistry
Following MitoTracker Deep Red dye staining and fixation with 10% formalin, cells grown on glass coverslips were permeabilized in 0.25% Triton X-100. After 1 h incubation with blocking buffer (1% bovine serum albumin and 0.1% Tween 20 in PBS), cells were incubated 1 h with primary antibody against Nrf2 (H-300, 1:200 dilution; Santa Cruz Biotechnology). Cells were washed 5 times in blocking buffer prior to 1 h incubation with Alexa Fluor 488–conjugated secondary antibody (1:800 dilution; Invitrogen Molecular Probes) diluted in blocking buffer. Images were acquired under an Olympus BX53 microscope with an attached DP72 digital camera.
Mitochondrial swelling assay
Mitochondria isolated from Nrf2 KO or wild-type (WT) littermates were diluted in swelling buffer (250 mM sucrose, 10 mM MOPS, 5 μM EGTA, 2 mM MgCl2, 5 mM KH2PO4, 5 mM pyruvate, 5 mM malate) at a final concentration of 400 μg protein/ml. A volume of 200 μl of this mitochondrial suspension was placed in a 96-well plate for measuring absorption at 520 nm over 20 min at 37°C with reading every 30 s. Preparations of mitochondria were analyzed simultaneously with or without the addition of calcium chloride (CaCl2) at a final concentration of 150 μM.
Statistical analysis
Two-tailed Student’s t test was used to compare 2 means. One-way or 2-way ANOVA with a Bonferroni correction was used to compare multiple (>2) means with 1 or 2 independent variables, respectively. A value of P < 0.05 was used as the cutoff for statistical significance. Means labeled with a different letter represent significant difference between P < 0.05.
RESULTS
Alteration of mitochondrial morphology and content due to H2O2 treatment
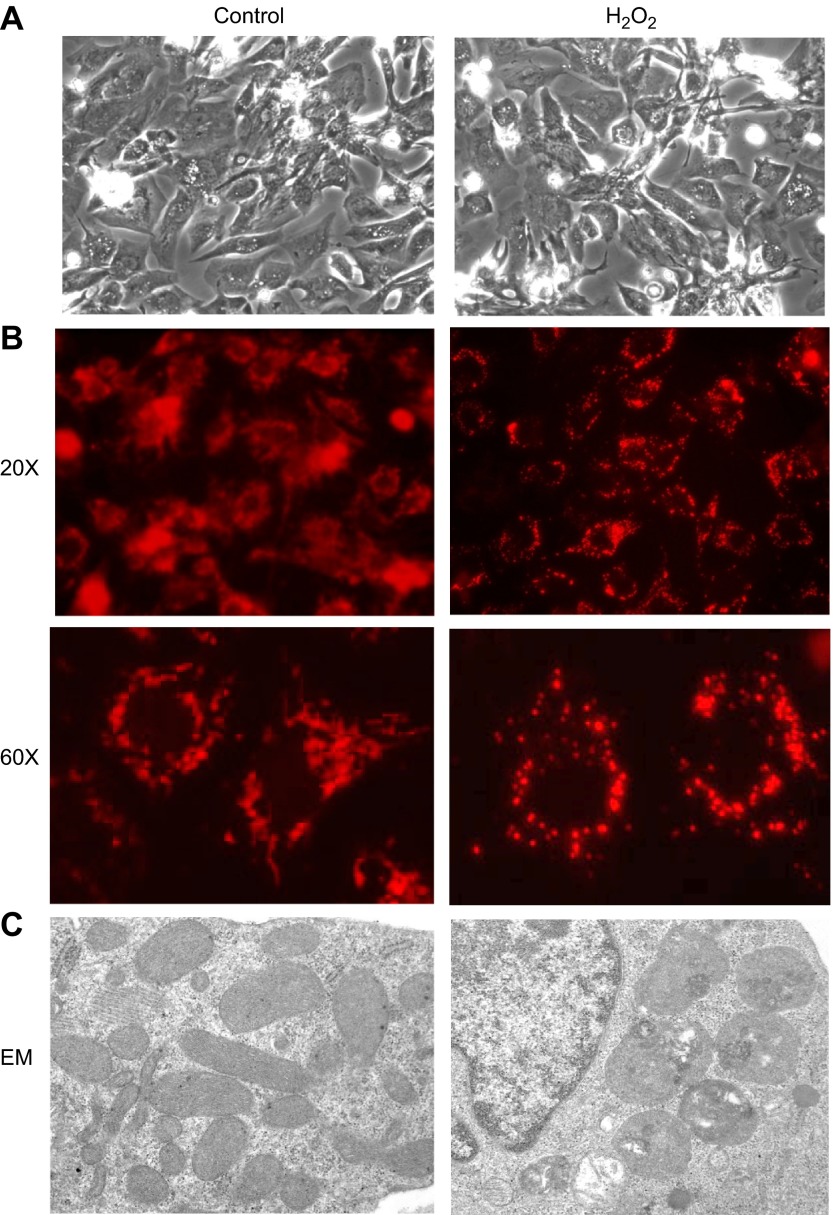
Careful dose–response studies for cell survival with H2O2 treatment have been reported previously from our laboratory (7). The majority of primary cultured neonatal rat cardiomyocytes can survive the exposure to H2O2 up to 500 μM (7). A small fraction of cells die and detach from the culture dishes within 24 h, allowing removal by changing culture medium (7). Cells surviving H2O2 treatment maintain normal morphology (Fig. 1A) but develop hypertrophy after 4 to 5 d (7). Cells surviving H2O2 treatment were examined for mitochondrial morphology under a fluorescent microscope following MitoTracker Deep Red staining. We observed that mitochondria in untreated cells appear in clusters or diffusing networks (Fig. 1B). In contrast, H2O2-treated cells appear to have a reduced content of mitochondria and the mitochondria appear as individualized punctuate dots (Fig. 1B). Electron microscopy examination revealed that normal cells contain abundant mitochondria in rod shapes with well-organized and evenly distributed cristae (Fig. 1C). H2O2-treated cells contain reduced number of mitochondria, and the mitochondria are enlarged and rounded with disorganized cristae, vacuolar structures, and areas of condensation (Fig. 1C).
Figure 1.
Cardiomyocytes surviving H2O2 treatment show abnormal mitochondrial morphology. Neonatal rat cardiomyocytes were treated with 300 μM H2O2 or equivalent volume of PBS for 2 h and kept under tissue culture condition for 24 h before recording for morphology (A) or analyses of mitochondrial morphology (B, C). Cells seeded on glass coverslips were stained with MitoTracker Deep Red 633 as described in Materials and Methods (B). The images were acquired by Olympus DP72 digital camera attached to Olympus BX53 fluorescent microscope (B). Cells were fixed in phosphate-buffered 2.5% glutaraldehyde (pH 7.4) followed by osmium tetraoxide prior to resin embedment for electron microscopy (EM) (C). A representative image from ×31,000 amplification is shown for control or H2O2-treated cardiomyocytes (C).
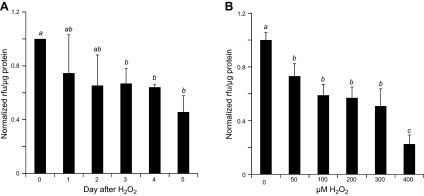
To quantify the impact of H2O2 treatment on the function of mitochondria, we measured mitochondrial membrane potential using MitoTracker Orange CMTMRos, which selectively accumulates in the mitochondria with intact membrane potential in live cells. Cells challenged with H2O2 showed a time-dependent decrease in MitoTracker Orange signal over a course of 5 d (Fig. 2A). A dose-dependent decline in mitochondrial membrane potential was observed starting with 50 μM and reached the lowest with 200 to 300 μM H2O2 (Fig. 2B). These data are consistent with a decline of functional mitochondria in cells surviving H2O2 treatment.
Figure 2.
Cells surviving H2O2 treatment show decreases in cellular content of functional mitochondria. Neonatal rat cardiomyocytes seeded in 6-well plates were treated with 300 μM for 2 h and assayed over a time course of 5 d (A) or were treated with various concentration of H2O2 for 2 h and cultured for 5 d (B). Cells were loaded with MitoTracker Orange CMTMRos for measurements of mitochondria membrane potential using a fluorescence plate reader. Fluorescence intensity was normalized to protein content from the corresponding well and expressed as the ratio of means ± sd from 3 independent experiments. The letter a indicates significant difference (P < 0.05) from means labeled with b or c as determined by 1-way ANOVA with Bonferroni correction. The mean labeled ab is not significantly different from that labeled with a or b, although a mean labeled with a is significant different from that labeled with b.
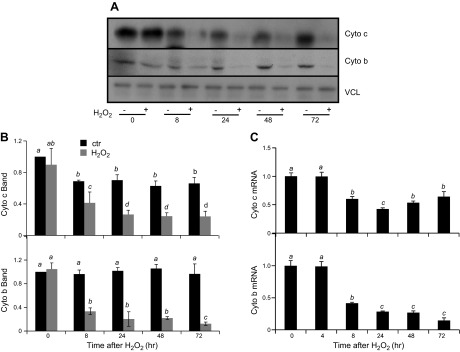
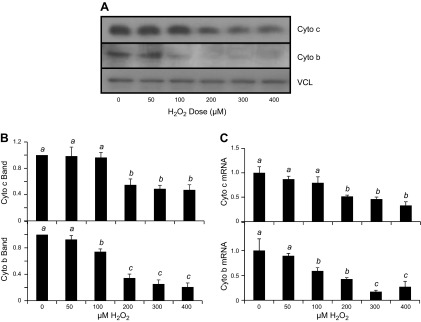
We measured mitochondrial proteins, cytochrome c and cytochrome b, to demonstrate the decrease of mitochondrial content or function in cells surviving H2O2 treatment. Cytochrome c is encoded by nuclear DNA, whereas cytochrome b is encoded by mitochondrial DNA. Western blot analyses revealed that H2O2 exposure resulted in decreased levels of cytochrome c and cytochrome b proteins. The decrease of cytochrome c and cytochrome b protein levels were observed within 8 h after H2O2 exposure and persisted for 3 d after exposure (Fig. 3A, B). Corresponding to the observed decrease at the protein level, cytochrome c and cytochrome b mRNA levels were also reduced following H2O2 treatment (Fig. 3C). A dose-dependent decrease in cytochrome b and cytochrome c was observed at both protein and mRNA levels (Fig. 4). Cytochrome c protein levels were reduced after exposure to 200–400 μM H2O2, while cytochrome b protein levels were reduced at H2O2 concentrations as low as 100 μM (Fig. 4B). Cytochrome c and cytochrome b mRNA followed a similar trend as the protein, with 200 and 100 μM H2O2 being sufficient to cause a significant reduction, respectively (Fig. 3D). These data indicate that both cytochrome b and cytochrome c expression decreased due to H2O2 treatment.
Figure 3.
H2O2 treatment causes decreases in expression of mitochondrial proteins over time. Neonatal rat cardiomyocytes were exposed to 300 μM H2O2 for 2 h and harvested at the indicated time points for Western blot (A, B) or real-time RT-PCR (C). The band intensity from Western blot was quantified using ImageJ software and normalized to the corresponding loading control VCL band for numeric presentation (B). The data represent the means ± sd from 3 independent experiments. The letter a indicates significant difference (P < 0.05) from means labeled with a letter b, c, or d as determined by 1-way ANOVA with Bonferroni correction. The mean labeled ab is not significantly different from that labeled with a or b, although a mean labeled with a is significant different from that labeled with b.
Figure 4.
H2O2 dose-dependent decrease of mitochondrial protein expression. Neonatal rat cardiomyocytes were exposed to H2O2 at the concentration indicated for 2 h before harvesting at 48 h after for measurements of cytochrome c or cytochrome b protein by Western blot (A, B) or mRNA by real-time RT-PCR (C). The band intensity from Western blot was quantified using ImageJ software and normalized to the corresponding loading control VCL band for numeric presentation (B). The data represent the means ± sd from 3 independent experiments. A letter a indicates significant difference (P < 0.05) from means labeled with a letter b or c as determined by 1-way ANOVA with Bonferroni correction.
Nrf2 overexpression preserves mitochondrial morphology and function following H2O2 exposure
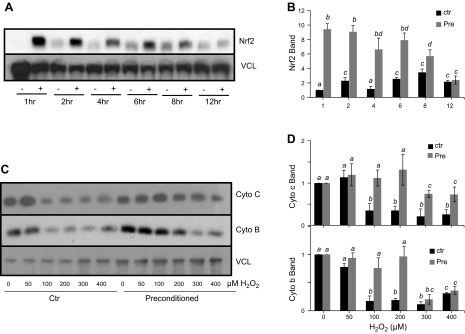
A brief treatment of H2O2 causes rapid elevation of Nrf2 protein due to de novo protein synthesis in cardiomyocytes (10, 18, 19). To address whether this condition of inducing Nrf2 protein results in protection against mitochondrial damage, cells were pretreated with 100 μM H2O2 for 10 min, followed by a 1 h recovery period. This condition causes a maximal induction of Nrf2 protein as reported from our laboratory (9, 20). An elevation of Nrf2 protein was detected at 1 h after pretreatment, which was before the second treatment of various doses of H2O2 (Fig. 5A, B). Nrf2 protein remained elevated for 8 h after the 1 h preconditioning treatment and returned to baseline levels by 12 h (Fig. 5A, B). When cytochrome c was measured at 48 h after treatment of 50–400 μM H2O2, cells receiving H2O2 preconditioning exhibited a preservation of cytochrome c protein levels compared with the cells without H2O2 preconditioning (Fig. 5C, D). The preservation of cytochrome b protein levels was observed for 50–200 μM H2O2 treatment (Fig. 5C, D).
Figure 5.
Preconditioning with H2O2 protects against the decreases of cytochrome c and cytochrome b. Rat cardiomyocytes were pretreated with 100 μM H2O2 for 10 min followed by 1 h of recovery in fresh medium. Cells were collected at the time point indicated for measurements of Nrf2 protein (A, B). Cells with or without 10 min 100 μM H2O2 pretreatment were treated at 1 h after for varying concentrations of H2O2 for 2 h before harvesting 48 h later for Western blot analysis to measure cytochrome c and cytochrome b protein levels (C, D). The band intensity from Western blot was quantified using ImageJ software and normalized to the corresponding loading control VCL band for numeric presentation (B, D). The data are from 1 experiment representative of 3 (A, C) or means ± sd from 3 experiments (B, D).
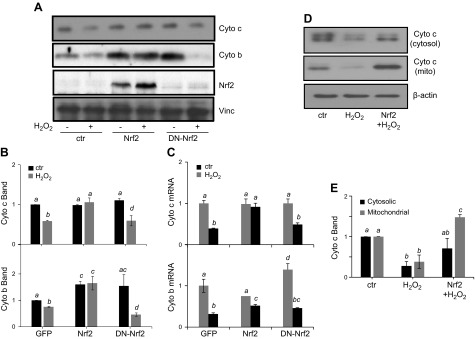
To determine whether Nrf2 elevation is sufficient for preserving mitochondrial morphology and content, adenovirus containing Nrf2 gene cloned into a vector containing a soluble GFP was used for Nrf2 overexpression. GFP allows the determination of gene transfer efficiency, which is about 90% in cardiomyocytes. A DN-Nrf2, which has the dimerization and DNA-binding domains but lacks the N-terminal transactivation domain, was included as a negative control. This mutant inhibits activation of endogenous Nrf2 transcription factor (9). When cytochrome c and cytochrome b were measured, we found that Nrf2 overexpression attenuated the decrease in cytochrome c and cytochrome b at both the protein and mRNA levels from H2O2 treatment (Fig. 6A–C). Interestingly, overexpression of either full-length Nrf2 or DN-Nrf2 augmented the basal level of cytochrome b protein, but only full-length Nrf2 was capable of attenuating the decreases associated with H2O2 exposure (Fig. 6A, B). Reversal of cytochrome c protein decrease was observed with cytosolic and mitochondrial fractions (Fig. 6D, E).
Figure 6.
Nrf2 overexpression attenuates decreases in expression of mitochondrial proteins. Rat cardiomyocytes were infected with adenovirus for expression of GFP, Nrf2, or DN-Nrf2. At 48 h after infection, cells were treated with 300 μM H2O2 for 2 h and were collected at 48 h after H2O2 treatment for measurements of Nrf2, cytochrome c, and cytochrome b by Western blot (A, B) or real-time RT-PCR (C). Cytosolic and mitochondrial fractions were purified as described in Materials and Methods for Western blot analysis of cytochrome c protein levels (D, E). The band intensity from Western blot was quantified using ImageJ software and normalized to the corresponding loading control VCL or β-actin band for numeric presentation (B, E). Values represent the means ± sd from 3 independent experiments. A letter a indicates significant difference (P < 0.05) from means labeled with a letter b, c, or bc as determined by 1-way ANOVA with Bonferroni correction. The mean labeled ac or bc is not significantly different from that labeled with a or c, or b or c, respectively.
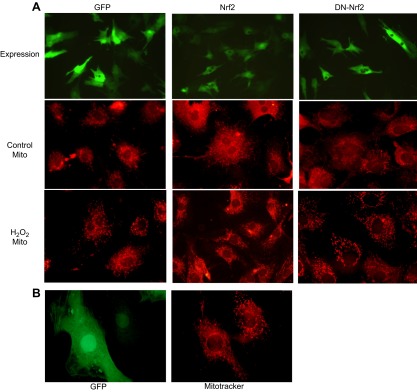
Following treatment with H2O2, cells overexpressing Nrf2 were resistant to alteration of mitochondrial morphology shown as lack of disruption of mitochondrial networks (Fig. 7A). The DN-Nrf2–expressing cells maintained normal mitochondrial morphology prior to H2O2 exposure, but experienced a similar degree of mitochondrial morphologic change as cells expressing GFP alone (Fig. 7A). Because the transducing efficiency is about 90% with adenovirus-mediated gene delivery, we were able to find cells not overexpressing Nrf2 within the same culture where the majority of cells were transduced (Fig. 7B). Only the cells overexpressing Nrf2 had maintained normal mitochondrial morphology following H2O2 exposure, whereas within the same culture, cells that did not show high-level Nrf2 transduction presented with mitochondrial fragmentation in response to H2O2 exposure (Fig. 7B).
Figure 7.
Nrf2 inhibits alteration of mitochondrial morphology following H2O2 exposure. Neonatal rat cardiomyocytes seeded on glass coverslips were infected with adenovirus for expression of GFP, Nrf2, or DN-Nrf2 (A). At 48 h after infection, cells were exposed 2 h to PBS (control) or 300 μM H2O2. Following 24 h of recovery, cells were stained with MitoTracker Deep Red 633 for observation under an Olympus BX53 fluorescent microscope with attached Olympus DP72. A view from Nrf2 adenovirus-infected cells treated with H2O2 showing the difference in mitochondrial morphology in the cells expressing Nrf2 vs. the cells not expressing Nrf2 (B).
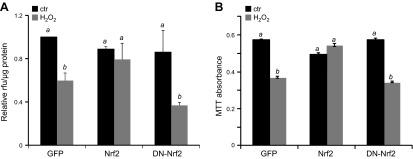
We found that Nrf2 overexpression, but not DN-Nrf2, prevented the decrease in mitochondrial membrane potential as qualified by labeling with MitoTracker Orange CMTMRos (Fig. 8A). The conversion of MTT to its formazan product is dependent on mitochondrial succinate dehydrogenase. As such, this MTT assay has been used as a measure of metabolic function of the mitochondria. Exposure to H2O2 caused a reduction in mitochondrial metabolism in cells infected with GFP (Fig. 8B). Cells overexpressing DN-Nrf2 experienced a reduction in MTT conversion following H2O2 exposure similar to GFP-infected cells; however, overexpression of Nrf2 prevented this decrease in mitochondrial metabolism after H2O2 exposure (Fig. 8B).
Figure 8.
Nrf2 prevents the decrease of mitochondrial function from H2O2 exposure. Neonatal rat cardiomyocytes were infected with adenovirus for expression of GFP, Nrf2, or DN-Nrf2. At 48 h after infection, cells were treated with 300 μM H2O2 for 2 h. At 5 d after H2O2 exposure, cells were stained using MitoTracker Orange CMTMRos for quantification of membrane potential (A). Fluorescence intensity was normalized to protein content from the corresponding well (A). Mitochondrial succinate dehydrogenase activity was assessed by incubation of cells with MTT (B). Values represent the means ± sd from 3 independent experiments. A letter a indicates significant difference (P < 0.05) from means labeled with a letter b as determined by 1-way ANOVA with Bonferroni correction.
Nrf2 localizes to the outer membrane of the mitochondria
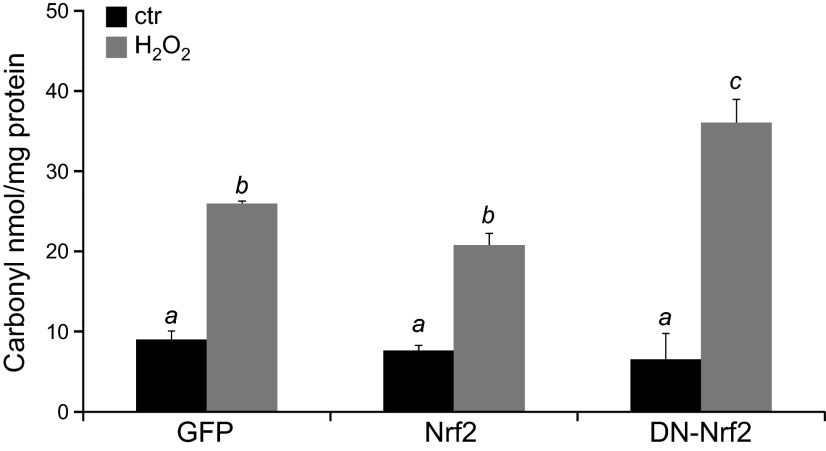
Nrf2 is known as a transcription factor regulating the expression of antioxidant and detoxification genes containing the antioxidant response element in the promoter. This has led many of us to assume that Nrf2 elevation results in a decrease in the level of oxidative stress. The levels of protein carbonyl were assayed to determine the effect of Nrf2 overexpression on protein oxidation. Previous work from our laboratory found that cardiomyocytes showed the highest increase of protein carbonyl content within 2 h of H2O2 treatment and the level of protein carbonyl returned to the basal level within 1–2 d (8). We observed that 2 h of H2O2 treatment caused a 2.6-fold increase of protein carbonyls in control GFP-transduced cells. Overexpression of Nrf2 resulted in an insignificant protection against protein carbonyl formation (25.8 ± 0.6 vs. 22.4 ± 1.2; Fig. 9). As expected, the dominant negative mutant causes an enhancement of carbonyl formation (Fig. 9). This suggests that despite Nrf2 overexpression, the cells experienced a similar level of protein oxidation as the cells not overexpressing Nrf2.
Figure 9.
Nrf2 fails to reduce protein oxidation by H2O2 treatment. Neonatal rat cardiomyocytes were infected with adenovirus for expression of GFP, Nrf2, or DN-Nrf2. At 48 h after infection, cells were treated with 300 μM H2O2 for 2 h. Cells were harvested immediately for measurements of protein carbonyl. Values represent the means ± sd from 3 independent experiments. A letter a indicates significant difference (P < 0.05) from means labeled with b or c as determined by 1-way ANOVA with Bonferroni correction.
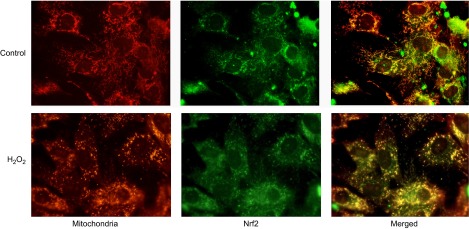
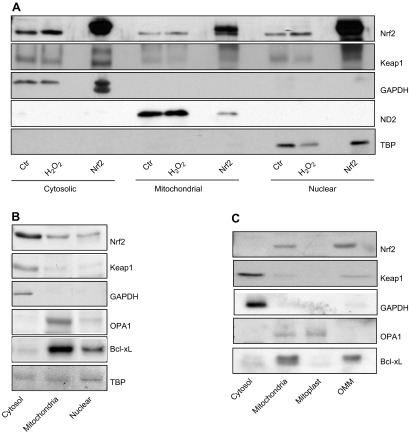
We addressed the possibility of whether the protection of mitochondria is through a direct interaction of Nrf2 with mitochondria. Immunocytochemical staining revealed colocalization of Nrf2 with mitochondria in cardiomyocytes (Fig. 10A). Mitochondrial localization of Nrf2 was confirmed by measurements of Nrf2 protein following subcellular fractionation of cell lysates (Fig. 11A). To reveal the specific site of Nrf2 localization within mitochondria, animal tissues were used because cells in culture are not capable of providing enough material for fractionating mitochondria into outer membrane of mitochondria (OMM) vs. mitoplasts. When mitochondria were collected from rat hearts, subfractionation into OMM vs. mitoplasts was not successful as the OMM fractions were contaminated with mitoplasts and vice versa. This is likely due to the fact that myocytes in the myocardium are linked together and mitochondria are packed tightly between the myofibril structures. Nevertheless, mitochondria isolated from rat hearts show the presence of Nrf2 protein (Fig. 11B). Liver tissues provide an alternative for obtaining clean fractions of mitochondria, allowing subfractionation of the mitochondria. Subfractionation of mitochondria isolated from rat livers revealed the OMM as the site where Nrf2 is localized (Fig. 11C).
Figure 10.
Colocalization of Nrf2 with mitochondria. Neonatal rat cardiomyocytes were grown on glass cover slips. Following 300 μM H2O2 treatment for 2 h and 24 h of recovery, cells were fixed with formalin after 30 min of MitoTracker Deep Red uptake. Nrf2 was detected by immunocytochemistry as described in Materials and Methods.
Figure 11.
Association of Nrf2 protein with mitochondria. Neonatal rat cardiomyocytes with or without Nrf2 adenoviral transfection were treated with 300 μM H2O2 for 2 h. Cells were immediately harvested and fractionated into cytosolic, mitochondrial, and nuclear fractions for Western blot analysis of Nrf2 and Keap-1, along with protein markers of each fraction: GAPDH (cytosol), ND2 (mitochondria), and TBP (nucleus) (A). An equal amount of proteins from cytosolic, mitochondrial, or nuclear fractions isolated from rat heart tissues were used for Western blot to detect for Nrf2 and Keap-1 with protein markers (B). Mitochondria isolated from rat liver were subfractionated into whole mitochondria, mitoplast, and outer mitochondria membrane as described in Materials and Methods for Western blot analysis of Nrf2 and protein markers of each fraction: GAPDH (cytosol), OPA1 (mitoplasts), and Bcl-xL (OMM) (C).
The Nrf2 signaling pathway is coordinated largely through an interaction with Keap1. Under normal homeostatic conditions, Keap1 negatively regulates Nrf2 protein levels through a direct interaction. This Nrf2–Keap1 interaction appears to be maintained on the mitochondria, as Keap1 is similarly present in mitochondrial fractions (Fig. 11B) and specifically the OMM (Fig. 11C).
The observation that Nrf2 localizes to the OMM suggests that Nrf2 may have a direct impact on preserving mitochondria. Calcium-induced swelling of isolated mitochondria is a measurement of mitochondrial dysfunction and has been used as an indicator of mitochondrial permeability transition pore opening (21–23). Mitochondria isolated from the hearts of WT and Nrf2 KO mice were subjected to calcium-induced swelling indicated by a reduction in absorbance at 540 nm. In the absence of calcium, mitochondria from WT and Nrf2 KO mice maintained relatively stable absorbance readings at 540 nm (Fig. 12A). Following the addition of calcium, mitochondria from WT showed a gradual decrease in 540 nm absorbance. Mitochondria isolated from Nrf2 KO mice had an enhanced sensitivity to swelling compared with WT mitochondria, as indicated by the greater decrease in 540 nm absorbance (Fig. 12B). These data suggest that lack of Nrf2 results in an increased sensitivity to mitochondrial membrane permeability transition and mitochondrial swelling.
Figure 12.
Loss of Nrf2 increases mitochondrial sensitivity to calcium-induced swelling. Mitochondria were isolated from the hearts of WT or Nrf2 KO mice and challenged with calcium to induce mitochondria swelling. Swelling was monitored by a decrease in absorbance at 520 nm over a 20 min period at 37°C after addition of PBS (control) or calcium (A). Decrease in absorbance (%) following addition of calcium was calculated compared with WT or Nrf2 KO controls (B). Values represent the means ± sem from 3 independent experiments. The letter a indicates significant difference (P < 0.05) from means labeled with a letter b or c as determined by 1-way ANOVA with Bonferroni correction.
DISCUSSION
The work presented here points to a novel function of Nrf2 in protecting the mitochondria in cardiomyocytes. Knocking out Nrf2 results in an increased susceptibility to mitochondrial swelling. With isolated cardiomyocytes, overexpression of Nrf2 prevented H2O2 from inducing changes in mitochondria, such as disruption of mitochondrial networks, loss of mitochondrial membrane potential, and decreased expression of cytochrome c and cytochrome b. The finding of Nrf2 localization to the outer membrane of the mitochondria suggests a direct interaction of Nrf2 with components of mitochondria in the preservation of mitochondrial integrity and function.
Nrf2 signaling may crosstalk with mitochondria-related reactive oxygen species (ROS) generation and membrane permeability transition. Nrf2 KO mice have been shown to be hypersensitive to mitochondrial toxins (24). Multiple lines of evidence support an increased production of ROS in cells or tissues due to Nrf2 gene KO, and such scenario has been documented in cardiomyocytes and mouse embryonic fibroblasts in culture (25, 26). In contrast, Nrf2 activation resulted in decreased ROS production by mitochondria and cytosolic NADPH oxidase system (26). Through induction of HO-1 and NAD(P)H quinone oxidoreductase 1 gene expression, Nrf2 is capable of maintaining mitochondrial function and promoting removal of damaged mitochondrial units (27–29). Apparently, HO-1 can translocate to the mitochondria and such localization corresponds to reduction of oxidant production (30–32). In addition to protection of mitochondria via induction of HO-1, Nrf2 appears to regulate mitochondrial fatty acid oxidation (33, 34), which affects oxidative phosphorylation and therefore ROS production. Relevant to a role of Nrf2 in inhibition of mitochondrial production of ROS, mitochondrial membrane potential is decreased in cells deficient in Nrf2, while activation of Nrf2 resulted in an increased mitochondrial membrane potential (33). Under the conditions of mitochondrial stress or damage, such as oxidative stress and calcium overload, mitochondria undergo membrane permeability transition, causing dissipation of the mitochondrial membrane potential. Our observations of isolated mitochondria from Nrf2 KO mice experiencing an enhanced sensitivity of swelling due to calcium overloading and OMM localization of Nrf2 support a role of Nrf2 protein in maintaining mitochondrial membrane integrity possibly involving mitochondrial membrane permeability transition.
Historically the mitochondria have been viewed as a stable independent organelle. Increasing evidence suggests that the mitochondria are in fact highly dynamic and constantly undergoing fission and fusion. Mitochondrial fission and fusion are important for removal of damaged components, maintenance of energy metabolism, or initiation of cell death (35–38). The morphology of mitochondria we observed in untreated cells is consistent with the report indicating intricate mitochondria networks formed in cardiomyocytes (38). Mitochondria in networks offer several advantages over individual units, allowing for sharing mitochondrial components, including the complementation of mitochondrial DNA and respiratory chain proteins (38). This gives a greater flexibility to respond to various stressors, thereby maintaining the membrane potential, metabolic activity for ATP production and localization of cytochrome c. In vivo, induction of oxidative stress by ischemic reperfusion causes a shift in mitochondrial composition from an intricate interconnected network to a population of fragmented and individualized units (38–40). Our observation of H2O2 converting the mitochondria networks into individualized mitochondria suggests that isolated cardiomyocytes serve well as a cellular model for studying the mechanism of such change. Augmentation of mitochondrial fission or inhibition of mitochondria fusion can contribute to the morphologic change (41, 42). Whereas fusion is important for formation of an intricate network of mitochondria, fission allows segregation of damaged or dysfunctional components for removal by mitophagy. A number of mammalian proteins have recently been identified to facilitate the process of fission or fusion, including Drp1, Drp2, hFis-1, mitofusin 1, mitofusin 2, and OPA1. Whether Nrf2 protects the mitochondria by modulating the activities of these proteins remains to be tested.
Mitochondrial fission and fusion play an integral role in mitochondrial turnover essential for maintaining a functional mitochondrial population (37, 43). Replacement of mitochondria requires a complex and coordinated effort between nuclear and mitochondrial genomes for the expression of essential mitochondrial proteins (44). The human mitochondrial genome contains 16,569 base pairs of DNA or 37 genes, encoding mitochondrial tRNA or rRNA and 13 proteins for mitochondrial respiration chain. The availability of these gene products is essential for mitochondrial biogenesis and maintenance of the health and integrity of mitochondria. Decreases in mitochondrial copy number result in reduced expression of mitochondrial DNA–encoded genes such as cytochrome b. Mitochondrial turnover and biogenesis is tightly connected to expression of nuclear encoded mitochondrial proteins, for example, cytochrome c. Our findings suggest that H2O2 prompts decreases in the expression of both mitochondrial and nuclear encoded components of the electron transport chain. This points to an imbalance in mitochondrial turnover, possibly an enhanced mitophagy triggered by mitochondrial damage in the absence of sufficient biogenesis.
An increase in mitophagy could contribute to the observed decreases in functional mitochondria. Damaged or dysfunctional mitochondria are degraded through an autophagosomal system in a process termed mitophagy (45–47). Several laboratories have studied the relationship between autophagy and Nrf2/Keap-1 signaling pathway. The p62 (Sequestosome 1 or p62/SQSTM1), an adaptor protein important for recruiting LC3 to form autophagosomes, apparently competes with Nrf2 for Keap-1 binding, and phosphorylation of p62 increases its interaction with Keap-1, resulting in activation of Nrf2 (48–50). As a transcription factor, Nrf2 can regulate the expression of autophagy adaptor protein NDP52 and p62/SQSTM1, presumably facilitating autophagy (51, 52). However, knocking down Nrf2 resulted in an increase of autophagy, suggesting a suppressive role of Nrf2 in autophagy (53–55). Although suppression of mitophagy may contribute to an inhibition of mitochondrial loss, a deficit in mitophagy results in the accumulation of dysfunctional mitochondria characterized by mitochondrial swelling, loss of cristae structure, decreased membrane potential, and decreased capacity for metabolism (56, 57). The preservation of mitochondrial morphologic change and membrane potential by Nrf2 expression in our system argues against the possibility of Nrf2 inhibiting mitophagy. In fact, augmentation of the mitophagic pathways can restore mitochondrial function and metabolic capacity (57). Assuming Nrf2 increases mitophagy under the condition of oxidative stress, an increase of mitochondria biogenesis would be necessitated to maintain the balance of functional mitochondria.
Mitochondrial biogenesis has been studied in clinical settings associated with oxidative stress. Whether oxidative stress in various forms of cardiomyopathy is associated with an increase or decrease of mitochondrial biogenesis remains controversial (58). However, it is clear that peroxisome proliferator-activated receptor γ coactivator 1-α (PGC-1α) is an important mediator of mitochondrial biogenesis and expression of PGC-1α gene is regulated by oxidants downstream of epidermal growth factor receptor, Src, and p38 MAPK activation (59, 60). Early studies from our laboratory indicate rapid but transient and H2O2 dose-dependent activation of these signaling molecules (61, 62), suggesting the possibility of mitochondrial biogenesis earlier in the time course following H2O2 treatment or with low doses of H2O2 that induces Nrf2. Although it remains to be tested whether or not Nrf2 regulates PGC-1α gene expression, Nrf2 drives the expression of the nuclear respiratory factor 1, which leads to mitochondrial biogenesis (27). In addition, Nrf2 downstream gene HO-1 has been shown to regulate mitochondrial biogenesis (27). These lines of evidence support a role of Nrf2 in mitochondrial biogenesis.
The work presented here indicates a localization of Nrf2 to the OMM; however, the mechanism for Nrf2 recruitment to mitochondria remains unknown. Nrf2 protein does not appear to be actively imported into the mitochondria matrix as detection of Nrf2 protein was limited to the OMM fraction. Sequence analysis and localization prediction software failed to identify a mitochondrial localization signal in Nrf2 or Keap-1 protein. In the absence of an internal mitochondrial localization signal, it is likely that Nrf2/Keap-1 complex is trafficked to mitochondria by a chaperone. Keap-1 has previously been reported to be tethered to the OMM through an interaction with phosphoglycerate mutase family member PGAM5, a protein first identified as a Bcl-xL interacting protein (63). PGAM5 contains a mitochondrial targeting sequence, which directs it to the outer membrane of mitochondria. The ternary complex of Nrf2-Keap-1–PGAM5 was found to localize to the mitochondria (63). Interestingly, disabling such mitochondrial location by knocking down PGAM5 resulted in an increased activity of Nrf2 transcription factor, suggesting the possibility that mitochondrial localization of Keap-1–Nrf2 may serve as a sensor for ROS production from the mitochondria and regulate Nrf2 release from Keap-1 and shuffling to the nucleus.
Several nuclear transcription factors have been found to exhibit mitochondrial localization. Among the list of these transcription factors are the Forkhead Box Class O, signal transducer and activator of transcription 3, high mobility group A1, activator protein-1, and most notably, p53 tumor suppressor (64–67). The p53 protein has been detected in the mitochondrial matrix and plays a role in maintaining mitochondrial DNA integrity (68, 69). When entering mitochondria, a transcription factor may function to regulate mitochondrial gene expression. However, in the case of Nrf2, lacking of a presence in the mitochondrial matrix excludes the interaction of Nrf2 with mitochondrial DNA for transcriptional regulation of mitochondrial genes. The fact that Nrf2 was detected in the nuclei as well as mitochondria and some of Nrf2 downstream genes encode for proteins localizing to and protecting mitochondria indicate the multiplicity in the molecular pathways linking Nrf2 protein and mitochondrial protection.
Acknowledgments
This work was supported by U.S. National Institutes of Health (NIH) National Heart, Lung, and Blood Institute Grant R01 HL089958, NIH National Institute of Environmental Sciences Grants R21 ES017473 and T32 ES007091, and NIH National Institute of General Medicine Sciences Grant R01 GM111337 and a University of Arizona Sarver Heart Center Anonymous Award for Heart Failure Research.
Glossary
- DN
dominant negative
- DNPH
2,4-dinitrophenylhydrazine
- FBS
fetal bovine serum
- GFP
green fluorescence protein
- HO-1
heme oxygenase-1
- Nrf2
nuclear factor–erythroid-derived 2–related factor 2
- MI
myocardial infarction
- MTT
3-(4,5-dimethyl-2-thiazolyl)-2,5-diphenyl-2H-tetrazolium bromide
- OMM
outer mitochondrial membrane; PGC-1α, peroxisome proliferator-activated receptor γ coactivator 1-α
- ROS
reactive oxygen species
- VCL
vinculin
- WT
wild-type
REFERENCES
- 1.Goldhaber J. I. (1997) Metabolism in normal and ischemic myocardium. In The Myocardium (Langer G. A., ed.), pp. 325–393, Academic Press, San Diego, CA, USA: [Google Scholar]
- 2.Babu G. G., Walker J. M., Yellon D. M., Hausenloy D. J. (2011) Peri-procedural myocardial injury during percutaneous coronary intervention: an important target for cardioprotection. Eur. Heart J. 32, 23–31 [DOI] [PubMed] [Google Scholar]
- 3.Herrmann J. (2005) Peri-procedural myocardial injury: 2005 update. Eur. Heart J. 26, 2493–2519 [DOI] [PubMed] [Google Scholar]
- 4.Kloner R. A., Przyklenk K., Whittaker P. (1989) Deleterious effects of oxygen radicals in ischemia/reperfusion. Resolved and unresolved issues. Circulation 80, 1115–1127 [DOI] [PubMed] [Google Scholar]
- 5.Opie L. H. (1989) Reperfusion injury and its pharmacologic modification. Circulation 80, 1049–1062 [DOI] [PubMed] [Google Scholar]
- 6.Chen Y. R., Zweier J. L. (2014) Cardiac mitochondria and reactive oxygen species generation. Circ. Res. 114, 524–537 [DOI] [PMC free article] [PubMed] [Google Scholar]
- 7.Chen Q. M., Tu V. C., Wu Y., Bahl J. J. (2000) Hydrogen peroxide dose dependent induction of cell death or hypertrophy in cardiomyocytes. Arch. Biochem. Biophys. 373, 242–248 [DOI] [PubMed] [Google Scholar]
- 8.Xie L., Terrand J., Xu B., Tsaprailis G., Boyer J., Chen Q. M. (2010) Cystatin C increases in cardiac injury: a role in extracellular matrix protein modulation. Cardiovasc. Res. 87, 628–635 [DOI] [PMC free article] [PubMed] [Google Scholar]
- 9.Purdom-Dickinson S. E., Lin Y., Dedek M., Morrissy S., Johnson J., Chen Q. M. (2007) Induction of antioxidant and detoxification response by oxidants in cardiomyocytes: evidence from gene expression profiling and activation of Nrf2 transcription factor. J. Mol. Cell. Cardiol. 42, 159–176 [DOI] [PMC free article] [PubMed] [Google Scholar]
- 10.Purdom-Dickinson S. E., Sheveleva E. V., Sun H., Chen Q. M. (2007) Translational control of nrf2 protein in activation of antioxidant response by oxidants. Mol. Pharmacol. 72, 1074–1081 [DOI] [PubMed] [Google Scholar]
- 11.Lee J. M., Calkins M. J., Chan K., Kan Y. W., Johnson J. A. (2003) Identification of the NF-E2-related factor-2-dependent genes conferring protection against oxidative stress in primary cortical astrocytes using oligonucleotide microarray analysis. J. Biol. Chem. 278, 12029–12038 [DOI] [PubMed] [Google Scholar]
- 12.Nguyen T., Nioi P., Pickett C. B. (2009) The Nrf2-antioxidant response element signaling pathway and its activation by oxidative stress. J. Biol. Chem. 284, 13291–13295 [DOI] [PMC free article] [PubMed] [Google Scholar]
- 13.Li W., Kong A. N. (2009) Molecular mechanisms of Nrf2-mediated antioxidant response. Mol. Carcinog. 48, 91–104 [DOI] [PMC free article] [PubMed] [Google Scholar]
- 14.Ma Q. (2013) Role of nrf2 in oxidative stress and toxicity. Annu. Rev. Pharmacol. Toxicol. 53, 401–426 [DOI] [PMC free article] [PubMed] [Google Scholar]
- 15.Kensler T. W., Wakabayashi N., Biswal S. (2007) Cell survival responses to environmental stresses via the Keap1-Nrf2-ARE pathway. Annu. Rev. Pharmacol. Toxicol. 47, 89–116 [DOI] [PubMed] [Google Scholar]
- 16.Barth E., Stämmler G., Speiser B., Schaper J. (1992) Ultrastructural quantitation of mitochondria and myofilaments in cardiac muscle from 10 different animal species including man. J. Mol. Cell. Cardiol. 24, 669–681 [DOI] [PubMed] [Google Scholar]
- 17.Chen Q. M., Merrett J. B., Dilley T., Purdom S. (2002) Down regulation of p53 with HPV E6 delays and modifies cell death in oxidant response of human diploid fibroblasts: an apoptosis-like cell death associated with mitosis. Oncogene 21, 5313–5324 [DOI] [PubMed] [Google Scholar]
- 18.Zhang J., Dinh T., Kapperler K., Tsaprailis, G., Chen Q. (2012) La autoantigen mediates oxidant induced de novo nrf2 protein translation. Mol. Cell. Proteomics 11, M111.015032 [DOI] [PMC free article] [PubMed] [Google Scholar]
- 19.Xu B., Zhang J., Strom J., Lee S., Chen Q. M. (2014) Myocardial ischemic reperfusion induces de novo Nrf2 protein translation. Biochim. Biophys. Acta 1842, 1638–1647 [DOI] [PMC free article] [PubMed] [Google Scholar]
- 20.Alam J., Stewart D., Touchard C., Boinapally S., Choi A. M., Cook J. L. (1999) Nrf2, a Cap’n’Collar transcription factor, regulates induction of the heme oxygenase-1 gene. J. Biol. Chem. 274, 26071–26078 [DOI] [PubMed] [Google Scholar]
- 21.Petit P. X., Goubern M., Diolez P., Susin S. A., Zamzami N., Kroemer G. (1998) Disruption of the outer mitochondrial membrane as a result of large amplitude swelling: the impact of irreversible permeability transition. FEBS Lett. 426, 111–116 [DOI] [PubMed] [Google Scholar]
- 22.Baines C. P., Kaiser R. A., Purcell N. H., Blair N. S., Osinska H., Hambleton M. A., Brunskill E. W., Sayen M. R., Gottlieb R. A., Dorn G. W., Robbins J., Molkentin J. D. (2005) Loss of cyclophilin D reveals a critical role for mitochondrial permeability transition in cell death. Nature 434, 658–662 [DOI] [PubMed] [Google Scholar]
- 23.Borillo G. A., Mason M., Quijada P., Völkers M., Cottage C., McGregor M., Din S., Fischer K., Gude N., Avitabile D., Barlow S., Alvarez R., Truffa S., Whittaker R., Glassy M. S., Gustafsson A. B., Miyamoto S., Glembotski C. C., Gottlieb R. A., Brown J. H., Sussman M. A. (2010) Pim-1 kinase protects mitochondrial integrity in cardiomyocytes. Circ. Res. 106, 1265–1274 [DOI] [PMC free article] [PubMed] [Google Scholar]
- 24.Lee J. M., Shih A. Y., Murphy T. H., Johnson J. A. (2003) NF-E2-related factor-2 mediates neuroprotection against mitochondrial complex I inhibitors and increased concentrations of intracellular calcium in primary cortical neurons. J. Biol. Chem. 278, 37948–37956 [DOI] [PubMed] [Google Scholar]
- 25.He X., Kan H., Cai L., Ma Q. (2009) Nrf2 is critical in defense against high glucose-induced oxidative damage in cardiomyocytes. J. Mol. Cell. Cardiol. 46, 47–58 [DOI] [PubMed] [Google Scholar]
- 26.Kovac S., Angelova P. R., Holmström K. M., Zhang Y., Dinkova-Kostova A. T., Abramov A. Y. (2015) Nrf2 regulates ROS production by mitochondria and NADPH oxidase. Biochim. Biophys. Acta 1850, 794–801 [DOI] [PMC free article] [PubMed] [Google Scholar]
- 27.Piantadosi C. A., Carraway M. S., Babiker A., Suliman H. B. (2008) Heme oxygenase-1 regulates cardiac mitochondrial biogenesis via Nrf2-mediated transcriptional control of nuclear respiratory factor-1. Circ. Res. 103, 1232–1240 [DOI] [PMC free article] [PubMed] [Google Scholar]
- 28.Kwon J., Han E., Bui C. B., Shin W., Lee J., Lee S., Choi Y. B., Lee A. H., Lee K. H., Park C., Obin M. S., Park S. K., Seo Y. J., Oh G. T., Lee H. W., Shin J. (2012) Assurance of mitochondrial integrity and mammalian longevity by the p62-Keap1-Nrf2-Nqo1 cascade. EMBO Rep. 13, 150–156 [DOI] [PMC free article] [PubMed] [Google Scholar]
- 29.Athale J., Ulrich A., MacGarvey N. C., Bartz R. R., Welty-Wolf K. E., Suliman H. B., Piantadosi C. A. (2012) Nrf2 promotes alveolar mitochondrial biogenesis and resolution of lung injury in Staphylococcus aureus pneumonia in mice. Free Radic. Biol. Med. 53, 1584–1594 [DOI] [PMC free article] [PubMed] [Google Scholar]
- 30.Bindu S., Pal C., Dey S., Goyal M., Alam A., Iqbal M. S., Dutta S., Sarkar S., Kumar R., Maity P., Bandyopadhyay U. (2011) Translocation of heme oxygenase-1 to mitochondria is a novel cytoprotective mechanism against non-steroidal anti-inflammatory drug-induced mitochondrial oxidative stress, apoptosis, and gastric mucosal injury. J. Biol. Chem. 286, 39387–39402 [DOI] [PMC free article] [PubMed] [Google Scholar]
- 31.Bolisetty S., Traylor A., Zarjou A., Johnson M. S., Benavides G. A., Ricart K., Boddu R., Moore R. D., Landar A., Barnes S., Darley-Usmar V., Agarwal A. (2013) Mitochondria-targeted heme oxygenase-1 decreases oxidative stress in renal epithelial cells. Am. J. Physiol. Renal Physiol. 305, F255–F264 [DOI] [PMC free article] [PubMed] [Google Scholar]
- 32.Slebos D. J., Ryter S. W., van der Toorn M., Liu F., Guo F., Baty C. J., Karlsson J. M., Watkins S. C., Kim H. P., Wang X., Lee J. S., Postma D. S., Kauffman H. F., Choi A. M. (2007) Mitochondrial localization and function of heme oxygenase-1 in cigarette smoke-induced cell death. Am. J. Respir. Cell Mol. Biol. 36, 409–417 [DOI] [PMC free article] [PubMed] [Google Scholar] [Retracted]
- 33.Holmström K. M., Baird L., Zhang Y., Hargreaves I., Chalasani A., Land J. M., Stanyer L., Yamamoto M., Dinkova-Kostova A. T., Abramov A. Y. (2013) Nrf2 impacts cellular bioenergetics by controlling substrate availability for mitochondrial respiration. Biol. Open 2, 761–770 [DOI] [PMC free article] [PubMed] [Google Scholar]
- 34.Ludtmann M. H., Angelova P. R., Zhang Y., Abramov A. Y., Dinkova-Kostova A. T. (2014) Nrf2 affects the efficiency of mitochondrial fatty acid oxidation. Biochem. J. 457, 415–424 [DOI] [PMC free article] [PubMed] [Google Scholar]
- 35.Estaquier J., Arnoult D. (2007) Inhibiting Drp1-mediated mitochondrial fission selectively prevents the release of cytochrome c during apoptosis. Cell Death Differ. 14, 1086–1094 [DOI] [PubMed] [Google Scholar]
- 36.Hoppins S., Lackner L., Nunnari J. (2007) The machines that divide and fuse mitochondria. Annu. Rev. Biochem. 76, 751–780 [DOI] [PubMed] [Google Scholar]
- 37.Youle R. J., van der Bliek A. M. (2012) Mitochondrial fission, fusion, and stress. Science 337, 1062–1065 [DOI] [PMC free article] [PubMed] [Google Scholar]
- 38.Ong S. B., Hausenloy D. J. (2010) Mitochondrial morphology and cardiovascular disease. Cardiovasc. Res. 88, 16–29 [DOI] [PMC free article] [PubMed] [Google Scholar]
- 39.Brady N. R., Hamacher-Brady A., Gottlieb R. A. (2006) Proapoptotic BCL-2 family members and mitochondrial dysfunction during ischemia/reperfusion injury, a study employing cardiac HL-1 cells and GFP biosensors. Biochim. Biophys. Acta 1757, 667–678 [DOI] [PubMed] [Google Scholar]
- 40.Dominic E. A., Ramezani A., Anker S. D., Verma M., Mehta N., Rao M. (2014) Mitochondrial cytopathies and cardiovascular disease. Heart 100, 611–618 [DOI] [PubMed] [Google Scholar]
- 41.Dagda R. K., Cherra S. J. III, Kulich S. M., Tandon A., Park D., Chu C. T. (2009) Loss of PINK1 function promotes mitophagy through effects on oxidative stress and mitochondrial fission. J. Biol. Chem. 284, 13843–13855 [DOI] [PMC free article] [PubMed] [Google Scholar]
- 42.Wu S., Zhou F., Zhang Z., Xing D. (2011) Mitochondrial oxidative stress causes mitochondrial fragmentation via differential modulation of mitochondrial fission-fusion proteins. FEBS J. 278, 941–954 [DOI] [PubMed] [Google Scholar]
- 43.Chan D. C. (2012) Fusion and fission: interlinked processes critical for mitochondrial health. Annu. Rev. Genet. 46, 265–287 [DOI] [PubMed] [Google Scholar]
- 44.Scarpulla R. C., Vega R. B., Kelly D. P. (2012) Transcriptional integration of mitochondrial biogenesis. Trends Endocrinol. Metab. 23, 459–466 [DOI] [PMC free article] [PubMed] [Google Scholar]
- 45.Elmore S. P., Qian T., Grissom S. F., Lemasters J. J. (2001) The mitochondrial permeability transition initiates autophagy in rat hepatocytes. FASEB J. 15, 2286–2287 [DOI] [PubMed] [Google Scholar]
- 46.Kim I., Rodriguez-Enriquez S., Lemasters J. J. (2007) Selective degradation of mitochondria by mitophagy. Arch. Biochem. Biophys. 462, 245–253 [DOI] [PMC free article] [PubMed] [Google Scholar]
- 47.Kubli D. A., Gustafsson A. B. (2012) Mitochondria and mitophagy: the yin and yang of cell death control. Circ. Res. 111, 1208–1221 [DOI] [PMC free article] [PubMed] [Google Scholar]
- 48.Lau A., Wang X. J., Zhao F., Villeneuve N. F., Wu T., Jiang T., Sun Z., White E., Zhang D. D. (2010) A noncanonical mechanism of Nrf2 activation by autophagy deficiency: direct interaction between Keap1 and p62. Mol. Cell. Biol. 30, 3275–3285 [DOI] [PMC free article] [PubMed] [Google Scholar]
- 49.Komatsu M., Kurokawa H., Waguri S., Taguchi K., Kobayashi A., Ichimura Y., Sou Y. S., Ueno I., Sakamoto A., Tong K. I., Kim M., Nishito Y., Iemura S., Natsume T., Ueno T., Kominami E., Motohashi H., Tanaka K., Yamamoto M. (2010) The selective autophagy substrate p62 activates the stress responsive transcription factor Nrf2 through inactivation of Keap1. Nat. Cell Biol. 12, 213–223 [DOI] [PubMed] [Google Scholar]
- 50.Ichimura Y., Waguri S., Sou Y. S., Kageyama S., Hasegawa J., Ishimura R., Saito T., Yang Y., Kouno T., Fukutomi T., Hoshii T., Hirao A., Takagi K., Mizushima T., Motohashi H., Lee M. S., Yoshimori T., Tanaka K., Yamamoto M., Komatsu M. (2013) Phosphorylation of p62 activates the Keap1-Nrf2 pathway during selective autophagy. Mol. Cell 51, 618–631 [DOI] [PubMed] [Google Scholar]
- 51.Jo C., Gundemir S., Pritchard S., Jin Y. N., Rahman I., Johnson G. V. (2014) Nrf2 reduces levels of phosphorylated tau protein by inducing autophagy adaptor protein NDP52. Nat. Commun. 5 [DOI] [PMC free article] [PubMed] [Google Scholar]
- 52.Rao V. A., Klein S. R., Bonar S. J., Zielonka J., Mizuno N., Dickey J. S., Keller P. W., Joseph J., Kalyanaraman B., Shacter E. (2010) The antioxidant transcription factor Nrf2 negatively regulates autophagy and growth arrest induced by the anticancer redox agent mitoquinone. J. Biol. Chem. 285, 34447–34459 [DOI] [PMC free article] [PubMed] [Google Scholar]
- 53.Darvekar S. R., Elvenes J., Brenne H. B., Johansen T., Sjøttem E. (2014) SPBP is a sulforaphane induced transcriptional coactivator of NRF2 regulating expression of the autophagy receptor p62/SQSTM1. PLoS One 9, e85262 [DOI] [PMC free article] [PubMed] [Google Scholar]
- 54.Chung S. D., Lai T. Y., Chien C. T., Yu H. J. (2012) Activating Nrf-2 signaling depresses unilateral ureteral obstruction-evoked mitochondrial stress-related autophagy, apoptosis and pyroptosis in kidney. PLoS One 7, e47299 [DOI] [PMC free article] [PubMed] [Google Scholar]
- 55.Joshi G., Gan K. A., Johnson D. A., Johnson J. A. (2015) Increased Alzheimer’s disease-like pathology in the APP/ PS1ΔE9 mouse model lacking Nrf2 through modulation of autophagy. Neurobiol. Aging 36, 664–679 [DOI] [PMC free article] [PubMed] [Google Scholar]
- 56.Dutta D., Calvani R., Bernabei R., Leeuwenburgh C., Marzetti E. (2012) Contribution of impaired mitochondrial autophagy to cardiac aging: mechanisms and therapeutic opportunities. Circ. Res. 110, 1125–1138 [DOI] [PMC free article] [PubMed] [Google Scholar]
- 57.Hoshino A., Mita Y., Okawa Y., Ariyoshi M., Iwai-Kanai E., Ueyama T., Ikeda K., Ogata T., Matoba S. (2013) Cytosolic p53 inhibits Parkin-mediated mitophagy and promotes mitochondrial dysfunction in the mouse heart. Nat. Commun. 4 [DOI] [PubMed] [Google Scholar]
- 58.Cooper M. P. (2013) Interplay of mitochondrial biogenesis and oxidative stress in heart failure. Circulation 127, 1932–1934 [DOI] [PubMed] [Google Scholar]
- 59.LeBleu V. S., O’Connell J. T., Gonzalez Herrera K. N., Wikman H., Pantel K., Haigis M. C., de Carvalho F. M., Damascena A., Domingos Chinen L. T., Rocha R. M., Asara J. M., Kalluri R. (2014) PGC-1α mediates mitochondrial biogenesis and oxidative phosphorylation in cancer cells to promote metastasis. Nat. Cell Biol. 16, 992–1003, 1–15 [DOI] [PMC free article] [PubMed] [Google Scholar]
- 60.Rasbach K. A., Schnellmann R. G. (2007) Signaling of mitochondrial biogenesis following oxidant injury. J. Biol. Chem. 282, 2355–2362 [DOI] [PubMed] [Google Scholar]
- 61.Tu V., Chen Q. (2003) Distinct roles of ERKs and p38 MAPK in oxidant induced cardiomyocyte hypertrophy. Cardiovasc. Toxicol. 3, 119–133 [DOI] [PubMed] [Google Scholar]
- 62.Purdom S., Chen Q. M. (2005) Epidermal growth factor receptor-dependent and -independent pathways in hydrogen peroxide-induced mitogen-activated protein kinase activation in cardiomyocytes and heart fibroblasts. J. Pharmacol. Exp. Ther. 312, 1179–1186 [DOI] [PubMed] [Google Scholar]
- 63.Lo S. C., Hannink M. (2008) PGAM5 tethers a ternary complex containing Keap1 and Nrf2 to mitochondria. Exp. Cell Res. 314, 1789–1803 [DOI] [PMC free article] [PubMed] [Google Scholar]
- 64.Caballero-Caballero A., Engel T., Martinez-Villarreal J., Sanz-Rodriguez A., Chang P., Dunleavy M., Mooney C. M., Jimenez-Mateos E. M., Schindler C. K., Henshall D. C. (2013) Mitochondrial localization of the forkhead box class O transcription factor FOXO3a in brain. J. Neurochem. 124, 749–756 [DOI] [PubMed] [Google Scholar]
- 65.Tammineni P., Anugula C., Mohammed F., Anjaneyulu M., Larner A. C., Sepuri N. B. (2013) The import of the transcription factor STAT3 into mitochondria depends on GRIM-19, a component of the electron transport chain. J. Biol. Chem. 288, 4723–4732 [DOI] [PMC free article] [PubMed] [Google Scholar]
- 66.Dement G. A., Treff N. R., Magnuson N. S., Franceschi V., Reeves R. (2005) Dynamic mitochondrial localization of nuclear transcription factor HMGA1. Exp. Cell Res. 307, 388–401 [DOI] [PubMed] [Google Scholar]
- 67.Ogita K., Fujinami Y., Kitano M., Yoneda Y. (2003) Transcription factor activator protein-1 expressed by kainate treatment can bind to the non-coding region of mitochondrial genome in murine hippocampus. J. Neurosci. Res. 73, 794–802 [DOI] [PubMed] [Google Scholar]
- 68.Achanta G., Sasaki R., Feng L., Carew J. S., Lu W., Pelicano H., Keating M. J., Huang P. (2005) Novel role of p53 in maintaining mitochondrial genetic stability through interaction with DNA Pol gamma. EMBO J. 24, 3482–3492 [DOI] [PMC free article] [PubMed] [Google Scholar]
- 69.Bakhanashvili M., Grinberg S., Bonda E., Simon A. J., Moshitch-Moshkovitz S., Rahav G. (2008) p53 in mitochondria enhances the accuracy of DNA synthesis. Cell Death Differ. 15, 1865–1874 [DOI] [PubMed] [Google Scholar]


