

Abstract
Brainstem nuclei (Bn) in humans play a crucial role in vital functions, such as arousal, autonomic homeostasis, sensory and motor relay, nociception, sleep, and cranial nerve function, and they have been implicated in a vast array of brain pathologies. However, an in vivo delineation of most human Bn has been elusive because of limited sensitivity and contrast for detecting these small regions using standard neuroimaging methods. To precisely identify several human Bn in vivo, we employed a 7 Tesla scanner equipped with multi-channel receive-coil array, which provided high magnetic resonance imaging sensitivity, and a multi-contrast (diffusion fractional anisotropy and T2-weighted) echo-planar-imaging approach, which provided complementary contrasts for Bn anatomy with matched geometric distortions and resolution. Through a combined examination of 1.3 mm3 multi-contrast anatomical images acquired in healthy human adults, we semi-automatically generated in vivo probabilistic Bn labels of the ascending arousal (median and dorsal raphe), autonomic (raphe magnus, periaqueductal gray), and motor (inferior olivary nuclei, two subregions of the substantia nigra compatible with pars compacta and pars reticulata, two subregions of the red nucleus, and, in the diencephalon, two subregions of the subthalamic nucleus) systems. These labels constitute a first step toward the development of an in vivo neuroimaging template of Bn in standard space to facilitate future clinical and research investigations of human brainstem function and pathology. Proof-of-concept clinical use of this template is demonstrated in a minimally conscious patient with traumatic brainstem hemorrhages precisely localized to the raphe Bn involved in arousal.
Key words: : 7 Tesla, ascending arousal system, autonomic system, high spatial resolution diffusion-weighted imaging, human brainstem nuclei, in vivo preliminary neuroimaging template, motor system, multi-contrast EPI
Introduction
Despite spectacular advances in neuroimaging of the human cerebral gray matter (GM), in vivo visualization of human brainstem nuclei (Bn) is more challenging. Except for a few midbrain and diencephalic nuclei [e.g., the substantia nigra (SN), the red nucleus (RN), and the subthalamic nucleus (STh) (Chowdhury et al., 2013; Keuken et al., 2014; Kwon et al., 2012; Menke et al., 2010; Xiao et al., 2014)], a major obstacle to precisely localizing individual Bn in vivo is the limited sensitivity and contrast between these small regions and adjacent white matter (WM) using standard neuroimaging methods, such as relaxivity-based magnetic resonance imaging (MRI).
Current understanding of human Bn structure is mostly derived from extrapolations from animal studies (Niblock et al., 2005; Paxinos, 2012; Paxinos and Watson, 2007) and postmortem human brain specimens (Aggarwal et al., 2013; Edlow et al., 2012; Naidich et al., 2009; Niblock et al., 2005; Soria et al., 2011). However, the three-dimensional (3D) structure and connections of Bn with forebrain regions, including the cerebral cortex, are known to vary across species between rodents, cats, primates, and man (Niblock et al., 2005; Paxinos et al., 2012). Moreover, the extrapolation of visual inspections of postmortem human brainstem atlases (Naidich et al., 2009; Paxinos and Huang, 1995) to generate in vivo human models with neuroimaging techniques is most likely associated with imprecision in boundary contours and poor inter-observer reproducibility.
Diagnostic and research investigations would therefore greatly benefit from a neuroimaging template of human Bn that can be used to reliably define Bn contours in an individual subject.
Currently, clinicians request brainstem imaging to exclude major structural lesions (e.g., large hemorrhages, tumors, infarcts, and vascular malformations), but there is no imaging tool that allows for precise neuroanatomic delineation of the Bn that is affected by a particular lesion.
For our group in particular, a major question is what tiny subcomponents of the ascending arousal network (e.g., raphe nuclei) are affected in disorders of consciousness—including coma, vegetative state, and minimally conscious state—because each nucleus subserves pathways that are functionally different and that entail different neurotransmitters (Parvizi and Damasio, 2001). Involvement of one versus another nucleus may carry distinct prognostic and therapeutic implications (Brown et al., 2010; Edlow et al., 2013). For neuroimaging of Bn to keep pace with recent advances in cortical imaging techniques, new tools are needed to precisely identify in vivo human Bn, as a key step toward elucidating specific pathologies restricted to them.
Here, we report a novel approach for neuroimaging several human Bn in living adults at ultra-high magnetic fields and provide a probabilistic template of these Bn to aid in vivo research and clinical investigation of brainstem structure and function. We employed a 7 Tesla scanner and multi-channel receive-coil array to acquire echo-planar-imaging (EPI)-based multi-contrast (diffusion- and T2-weighted) anatomical images with matched geometric distortions and resolution (1.1 mm isotropic resolution resulting in a 1.3 mm3 voxel volume), which provided good sensitivity and contrast for identifying several Bn.
We hypothesized that a diffusivity-based MRI contrast would provide complementary information to relaxivity-based MRI contrast (e.g., T2-weighted contrast, mostly related to tissue iron content) to delineate several in vivo Bn. Specifically, we focused on the diffusion fractional anisotropy (FA, computed from diffusion-weighted MRI), which reflects the degree to which water diffusion is restricted by axonal, neuronal, and glial microstructures. We hypothesized that diffusion FA maps would reveal several Bn as hypointense islands enclosed by hyperintense adjacent WM fiber bundles, and that they would also reveal subregions of Bn displaying different morphological properties and density of microstructures (myelin fibers, dendrites, and neurons) that anisotropically restrict water diffusion.
In this feasibility study, we focused on Bn of the ascending arousal and autonomic system because of our group's clinical and research focus on disorders of consciousness. These nuclei included the median raphe (MnR), the dorsal raphe (DR), the raphe magnus (RMg), and the periaqueductal gray (PAG). To demonstrate the reliability of our approach, we also defined motor relay nuclei already identified in previous work using in vivo relaxivity-based images (Chowdhury et al., 2013; Keuken et al., 2014; Kwon et al., 2012; Menke et al., 2010; Xiao et al., 2014), such as the SN, the RN, and, in the diencephalon, the STh. Notably, to advance the in vivo investigation of these motor Bn in humans, we exploited our multi-contrast method to parcellate each of these nuclei into anatomically distinct subnuclei (e.g., by dividing the SN into two subregions compatible with pars compacta and pars reticulata).
Finally, we provided a proof-of-concept clinical use of the developed template by mapping brainstem hemorrhages delineated on conventional MRI to discrete Bn pertaining to the template in standard space for a patient in a minimally conscious state caused by severe traumatic brain injury (TBI).
Materials and Methods
Experimental design
Twelve (six males, six females, age 28±1 years) healthy subjects underwent 7 Tesla MRI (Siemens Healthcare, Erlangen, Germany), after giving written informed consent. The human subject protocol was approved by the Institutional Review Board of the Massachusetts General Hospital (MGH).
During the 7 Tesla MRI session, subjects were asked to rest while lying down in the scanner during image acquisition; head motion was minimized by the use of foam pads, placed in the space between the interior coating of the MRI detector array and the subject's head. Radiofrequency transmission was provided by a detunable band-pass birdcage coil, and a custom-built 32-channel radiofrequency loop coil head array was used for reception.
MRI data acquisition
We adopted a common single-shot two-dimensional EPI readout for diffusion-weighted, T2-weighted, and T2*-weighted sagittal MRI. This protocol yielded multi-contrast anatomical images with an exactly matched resolution and geometric distortions (related to static magnetic field in-homogeneity). Common parameters for each EPI contrast were as follows: resolution=1.1×1.1×1.1 mm, field of view (FOV)=198×264, matrix=180×240, GRAPPA factor=3, and nominal echo-spacing=0.82 msec. Additional MRI parameters for each EPI contrast were as follows:
Diffusion-weighted spin-echo EPI
61 slices, unipolar diffusion weighting gradients, echo time (TE)=60.8 msec, repetition time (TR)=5.6 sec, phase encoding direction: anterior/posterior, bandwidth: 1488 Hz/pixel, partial Fourier: 6/8, 60 diffusion directions (b-value ∼1000 sec/mm2), seven interspersed “b0” images (non-diffusion weighted, b-value ∼0 sec/mm2, used as T2-weighted MRI, see below), four repetitions, and acquisition time/repetition 6′ 43″. Of note, to obtain high-quality diffusion-weighted MRI at 7 Tesla (where tissue displays shorter T2 values than at lower field strengths), we employed a unipolar rather than a bipolar scheme, which allowed us to shorten the TE by 30 msec.
T2-weighted spin-echo EPI
61 slices, TE=60.8 msec, TR=5.6 sec, 28 volumes (the b0 images of the diffusion-weighted protocol were used as T2-weighted MRI).
T2*-weighted gradient-echo EPI
123 slices, TE=32 msec, TR=2.5 sec, flip angle=75°, 28 volumes, simultaneous-multi-slice factor=3.
We also acquired a 1 mm isotropic T1-weighted magnetization-prepared rapid acquisition gradient echo (MPRAGE) image:
T1-weighted MRI
multi-echo MPRAGE, TR=2.51 sec; four echoes with TEs=[1.6, 3.5, 5.3, 7.2] ms, inversion time=1.5 sec, flip angle=7°, FOV=256×256×176 mm3, 256×256×176 matrix, bandwidth=651 Hz/pixel, GRAPPA factor=2, acquisition time: 6′ 04″.
MRI data analysis
Diffusion-weighted MRI
Data from different repetitions were concatenated, and standard pre-processing (FMRIB's Diffusion Toolbox, Oxford, UK) was applied (including eddy-current distortion correction and motion correction using as reference the first b0 image). At each voxel, we estimated the diffusion tensor (FMRIB's Diffusion Toolbox) and then computed the diffusion FA from the tensor eigenvalues. FA (range 0–1) represents the degree of anisotropy of a diffusion process (FA=0 if all eigenvalues are identical, and the diffusion of water molecules is isotropic; FA=1 if only one eigenvalue differs from zero, and the water diffusion is confined to one direction). The mean diffusivity was also computed from the diffusion tensor and employed to generate cerebrospinal fluid (CSF) masks (see below).
T2-, T2*-, and T1-weighted MRI
For each subject, after motion correction, T2- and T2*-weighted images were averaged across repetitions and co-registered to diffusion-weighted data via affine transformation. The multi-echo MPRAGE images were combined to form a root-mean-square T1-weighted image, which was also co-registered to diffusion-weighted data (via affine transformation).
Single-subject labeling of Bn
We employed two contrasts (FA maps and T2-weighted images) to identify Bn. T2*- and T1-weighted images were only used for display purposes (see for instance Fig. 1 and Supplementary Fig. S1; Supplementary Data are available online at www.liebertpub.com/brain). In this work, T1-weighted images were discarded, because they displayed only moderate contrast for the Bn that we aimed at delineating in this work (see Fig. 1), and the use of a conventional multi-echo MPRAGE sequence rather than an EPI sequence prevented a precise distortion matching to the other EPI-based contrasts. Further, T2-weighted imaging was used for the delineation of Bn rather than T2*-weighted imaging, because the latter is affected by the presence of static field effects (e.g., due to the static magnetic field inhomogeneity of the scanner and tissue susceptibility effects); these are non-local (e.g., extend outside of the region of interest) and might yield segmented Bn with less precise boundary contours. To generate single-subject labels (i.e., masks including only the identified Bn) of several Bn, for each subject we employed a semi-automatic procedure comprising the following steps (see Fig. 2): (a) A CSF mask was generated from the mean diffusivity map (CSFmask1, mean diffusivity values >0.001), and 1−CSFmask1 was applied to the FA map and T2-weighted image before segmentation of Bn to exclude CSF; to segment the PAG and DR only (which are in direct proximity to CSF spaces), a less conservative CSF mask (CSFmask2) was used (mean diffusivity values >0.0015); (b) after CSF masking, the FA map (used to segment the inferior olivary nuclei [ION], left and right, RMg and MnR) or the T2-weighted image (used to segment left and right RN, SN, and STh, and a region comprising both the PAG and the DR) was supplied to an automatic clustering algorithm implemented in Matlab 8.0 (The MathWorks, Natick, MA) based on the intensity values of the input data (method: k-means clustering; distance function: normalized squared Euclidean distance; maximum number of iterations: 300, which always guaranteed algorithm convergence; randomized initialization, with cluster re-ordering across the group to provide consistent inter-individual clustering; number of clusters: four, when CSFmask1 was used, and five, when CSFmask2 was used); (c) the cluster containing the Bn of interest was identified (cluster with the lowest quartile intensity value for ION, RMg, MnR, RN, SN, STh; clusters with the third and fourth quintile intensity value for the region comprising both the PAG and the DR), and labels of 3D-connected neighborhood components were automatically extracted using Matlab; within these labels, the Bn labels of interest were identified by centroid matching (centroid location defined manually); when distinct neighboring anatomical structures (for instance, a Bn of interest and an adjacent GM region) displayed similar intensity values, a “disconnection-mask” (obtained by manually delineating externally the shared border between the Bn of interest and the neighboring region, or by using a mask of the neighboring region when available) was applied before extraction of the 3D-connected components to exclude the neighboring region from the Bn label of interest (for instance, this procedure was used to “disconnect” the RMg from the ION, see Fig. 2, or the RN from the SN, and the SN from the STh). Then, for each subject, to yield distinct labels of the PAG and the DR, we iterated steps (a)–(c) as follows: (a) The label of the region comprising both the PAG and the DR (generated as explained earlier) was used as a mask on the FA map; (b) the clustering algorithm was applied to the masked FA map (same parameters as described earlier in (b), number of clusters: four); and (c) labels of the PAG and the DR were automatically generated (the cluster with the lower quartile FA value was assigned to the PAG, whereas the remaining three were assigned to the DR). Finally, for each subject, to automatically identify two subregions of the RN, SN, and STh (both left and right), steps (a)–(c) were iterated as follows: (a) The label of each of these six regions (generated as detailed earlier) was applied as a mask to the FA map; (b) each masked FA map was supplied to the same clustering algorithm described earlier in (b) (except for the number of clusters: two); and (c) each of the two non-overlapping clusters (having lower and higher FA value within each region) was labeled as subregions 1 and 2, respectively.
FIG. 1.

Magnetic resonance imaging (MRI) contrast for in vivo delineation of several human brainstem nuclei (Bn). The fractional anisotropy (FA) map (coronal view shown) computed from 1.1 mm isotropic diffusion-weighted MRI data at an ultra-high magnetic field (∼24 min acquisition, example dataset, native echo-planar-imaging (EPI) space) displays good gray matter–white matter contrast in the brainstem, which provides complementary information to relaxivity-based (T2-, T2*-, and T1-weighted) MRI. On the FA map, the locations of several Bn are indicated: periaqueductal gray (PAG, pink arrow), mesencephalic tegmental nuclei (yellow arrows), raphe nuclei (green arrows), pontine nuclei (blue arrows), and inferior olivary nuclei (ION, red arrows).
FIG. 2.

Flowchart showing the steps of single-subject labeling of Bn (raphe magnus [RMg], in this example). For an example dataset: (a) FA map after masking out CSF areas; (b) automatic clustering of the image shown in (a) into four clusters (dark gray/white indicates, respectively, the cluster with lower/higher intensity values); (c) left panel, the cluster (dark gray) containing the RMg (white arrow) was identified; middle panel, a “disconnection-mask” (green) was manually drawn to delineate externally the shared border between the RMg and the left and right ION; right panel, labels of three-dimensional (3D) connected neighborhood components were automatically extracted (for instance, red label corresponding to the RMg, and blue/yellow labels corresponding to the left/righ ION), and within these labels, the RMg label (red) was identified by centroid matching (centroid location manually defined). In summary, the labeling procedure was automatic with some manual input, mainly provided to disconnect neighboring regions displaying similar intensity profiles, but pertaining to distinct anatomical structures. A similar procedure was applied to label the median raphe (MnR), ION, red nucleus (RN), substantia nigra (SN), subthalamic nucleus (STh), and a region comprising both the PAG and the dorsal raphe (DR), see Materials and Methods section).
Alignment to standard space and probabilistic labeling
Single-subject images (FA, T2-weighted) and Bn labels were aligned to a brain diffusion template in Montreal Neurological Institute (MNI) space (Illinois Institute of Technology [IIT] human brain atlas, v.3, Chicago, IL) (Varentsova et al., 2014). Specifically, FA maps in single-subject native space were registered to the mean FA image (n=72) of the IIT human brain atlas (alignment-Native-to-IITMNI) by the use of the Advanced Normalization Tool (ANTs, Philadelphia, PA) (Avants et al., 2011). Non-linear registration to the IIT human brain atlas included a generic affine transformation (computed by concatenating center-of mass alignment, rigid, similarity, and fully affine transformations) followed by a high-dimensional non-linear transformation (symmetric diffeomorphic normalization transformation model with neighborhood cross correlation, regular sampling, gradient step size: 0.2, four multi-resolution levels, smoothing sigmas: 3, 2, 1, 0 voxels [fixed image space], shrink factors: 6, 4, 2, 1 voxels [fixed image space], histogram matching of images before registration, data winsorization [quantiles: 0.005, 0.995], convergence criterion: slope of the normalized energy profile over the past 10 iterations <10−8). The IIT FA image was chosen as a registration target in order to ensure the use of only intra-modality registration steps. The diffusion IIT human brain atlas is in MNI152 standard (MNI152_T1_1 mm) space, which has been adopted by the International Consortium for Brain mapping and is commonly used as a standard space for functional MRI analysis. However, given a small misalignment between the IIT human brain atlas space (which we call IIT MNI space) and the MNI152 space in the brainstem (especially in pontine and medullary regions), we also computed the affine and non-linear transformations necessary to align the T1-weighted image of the IIT human brain atlas to the MNI152_T1_1 mm image (alignment-IITMNI-to-MNI152). Finally, we concatenated the transformations alignment-Native-to-IITMNI and alignment-IITMNI-to-MNI152 into a single warp field, and mapped the single-subject images and labels into MNI152 space using a single interpolation step, in order to minimize re-sampling errors. In both IIT MNI and MNI152 spaces, we averaged FA maps and T2-weighted images across subjects, to be used as background images for label overlay. We thus generated an in vivo template of Bn in both spaces in the form of average probability maps (highest probability=100% overlap across subjects, n=12) of each label. In both spaces, we computed the maximum of the overlap (maximum accuracy) within each probabilistic label (see Table 1). For each subject and label, we also computed the label volume in native space and reported the mean (SE) volume across subjects (Table 1). The development of the template in both IIT MNI and MNI152 spaces may facilitate its use for both diffusion and functional MRI studies.
Table 1.
Accuracy of Probabilistic Labels in MNI Space and Label Volume in Native Space
| Bn label | MnR | RMg | DR | PAG | IONr | IONl | SN1r | SN2r | SN1l | SN2l | RN1r | RN2r |
|---|---|---|---|---|---|---|---|---|---|---|---|---|
| Maximum accuracy (%) of probabilistic labela | 92 | 83 | 100 | 100 | 100 | 100 | 100 | 100 | 100 | 100 | 100 | 100 |
| Label volume (mm3)b | 14 (2) | 16 (3) | 345 (29) | 185 (24) | 227 (15) | 221 (13) | 276 (26) | 187 (20) | 293 (27) | 225 (28) | 125 (16) | 99 (13) |
| Bn label | RN1l | RN2l | STh1r | STh2r | STh1l | STh2l | SNrc | SNlc | RNrc | RNlc | SThrc | SThlc |
|---|---|---|---|---|---|---|---|---|---|---|---|---|
| Maximum accuracy (%) of probabilistic labela | 100 | 100 | 100 | 83 | 92 | 83 | 100 | 100 | 100 | 100 | 100 | 100 |
| Label volume (mm3)b | 135 (16) | 118 (13) | 86 (14) | 69 (6) | 102 (9) | 70 (6) | 463 (42) | 518 (52) | 224 (29) | 253 (27) | 155 (19) | 172 (15) |
Maximum label accuracy (accuracy=average overlap across subjects, %) within each probabilistic label in MNI space (the same results were obtained for the IIT MNI and MNI152 spaces). The minimum label accuracy was 8% for each label (1 out of 12 subjects).
Label volume in native space, mean (SE) across subjects displayed.
We also report the label accuracy and volume of the whole (left and right) SN, RN, and STh label to facilitate comparisons with previous work.
DR, dorsal raphe; IIT, Illinois Institute of Technology; ION, inferior olivary nuclei; MNI, Montreal Neurological Institute; MnR, median raphe; PAG, periaqueductal gray; RN, red nucleus; RMg, raphe magnus; SN, substantia nigra; STh, subthalamic nucleus.
Single-case analysis of a patient with severe TBI
A 23-year-old woman underwent an MRI scan 146 days (∼5 months) after a severe TBI. The patient was a pedestrian who was hit by a car. Her Glasgow Coma Scale score was 5 (eyes=1, verbal=1, motor=3) on arrival to the Emergency Department at MGH, which was consistent with coma. By the time of the MRI scan, she had recovered to a minimally conscious state based on an assessment with the Coma Recovery Scale–Revised (Giacino et al., 2004). MRI data were acquired on a clinical Siemens Skyra 3 Tesla scanner using a 32-channel head coil. MRI parameters for each MRI contrast were as follows.
Susceptibility-weighted MRI
Three-dimensional acquisition with TE=20 msec, TR=30 msec, FA=15°, resolution=0.86×0.86×1.8 mm, bandwidth=120 Hz/pixel, acquisition time=4′ 33″.
T1-weighted MRI
One millimeter isotropic multi-echo MPRAGE, TR=2.53 sec; four echoes with TEs=[1.69, 3.55, 5.41, 7.27] ms, inversion time=1.2 sec, FA=7°, bandwidth=650 Hz/pixel, GRAPPA factor=2, acquisition time: 4′ 30″.
To align the susceptibility-weighted MRI (SWI) to the IIT MNI space, we computed the affine transformation from the SWI to the MPRAGE, and a non-linear transformation (five multi-resolution levels, smoothing sigmas: 6, 4, 2, 1, 0 voxels, shrink factors: 12, 8, 4, 2, 1 voxels, data winsorization [quantiles: 0.002, 0.992], other parameters as described earlier) of the MPRAGE to the T1-weighted IIT MNI (including an affine initialization step as described earlier). We then concatenated the two transformations and applied them to the SWI in a single interpolation step. A mask of traumatic brainstem hemorrhages, likely caused by hemorrhagic traumatic axonal injury, was defined by setting an upper threshold to the SWI (values <110). These hemorrhages are visible in the chronic stage of red blood cell degradation due to the persistent susceptibility effect of hemosiderin. To quantify how much each identified Bn was affected by the traumatic hemorrhages, we computed the percent overlap between each label (thresholded at 35%) of the Bn template and the mask of hemorrhages in MNI space (number of common voxels normalized by the number of voxels in the Bn label).
Results
In all subjects, FA maps displayed good GM-WM contrast for delineation of several Bn, providing complementary information to relaxivity-based (T2-weighted) MRI (Fig. 1; for completeness, we also show T2*- and T1-weighted MRI). As an example, the signal in the right ION and in the neighboring WM for FA, T2-, T2*-, and T1-weighted MRI is shown in Supplementary Figure S1.
On a single-subject basis, we performed semi-automatic segmentation of several pontine and medullary nuclei based on the contrast provided by FA maps (Bn appeared as regions of hypointensity compared with WM); after alignment of the FA maps of all subjects to 1 mm resolution MNI stereotaxic space, we generated probabilistic labels of the left and right ION, RMg, and MnR (see Fig. 3, top and middle row panels). These nuclei were not readily visible in T2-weighted MRI (see Fig. 3, bottom row panels, and, for the ION also Supplementary Fig. S1). A region-based analysis of FA and T2-weighted values in the left and right ION, RMg, and MnR is shown in Supplementary Figure S2.
FIG. 3.
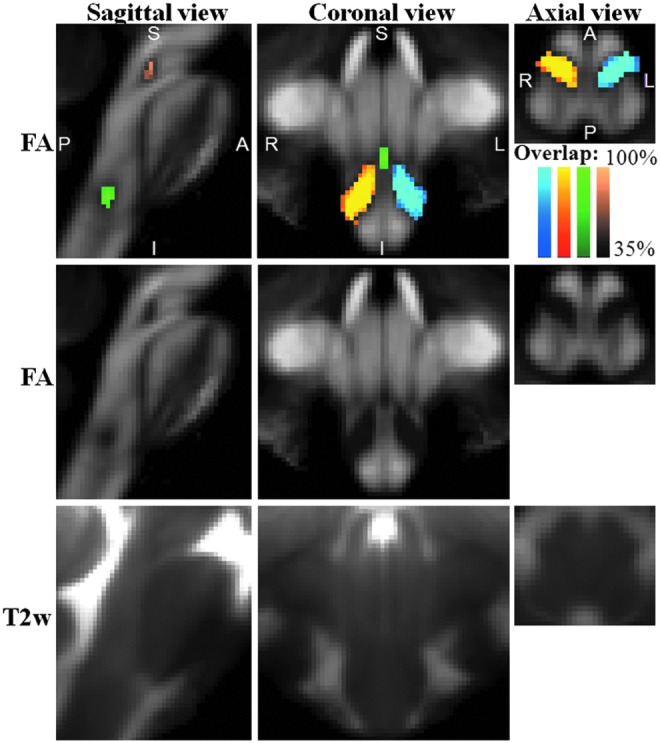
Probabilistic labels in Montreal Neurological Institute (MNI) space of some pontine and medullary nuclei. Top row panels: overlaid on the group average FA map (n=12) in Illinois Institute of Technology (IIT) MNI space (see Materials and Methods section for a definition of this standard space), probabilistic labels of left (blue to cyan) and right (red to yellow) ION, RMg (dark to light green), and MnR (dark to light brown) are shown. Very good spatial agreement of labels across subjects was observed, indicating the feasibility of delineating a probabilistic label of these Bn. Middle and bottom row panels: group average FA map and T2-weighted image (n=12) in IIT MNI space, respectively (same slices and views as in the top row panels).
In each subject, the PAG and DR (see probabilistic labels in Fig. 4) were identified using an iterative segmentation procedure based on the combined use of FA maps and T2-weighted images. First, we identified a cluster comprising both the PAG and DR, displaying a hypointense signal compared with neighboring regions (e.g., the colliculi) on T2-weighted images. Second, we segmented this cluster into two separate Bn (the PAG and the DR, respectively) on the basis of the FA. This segmentation was based on the observation that the PAG displayed a lower FA compared with the DR (see Fig. 4 and, for a region-based analysis of FA and T2-weighted values, Supplementary Fig. S2). The latter procedure yielded an automatic delineation of the medio-ventral borders of the PAG abutting with the DR.
FIG. 4.
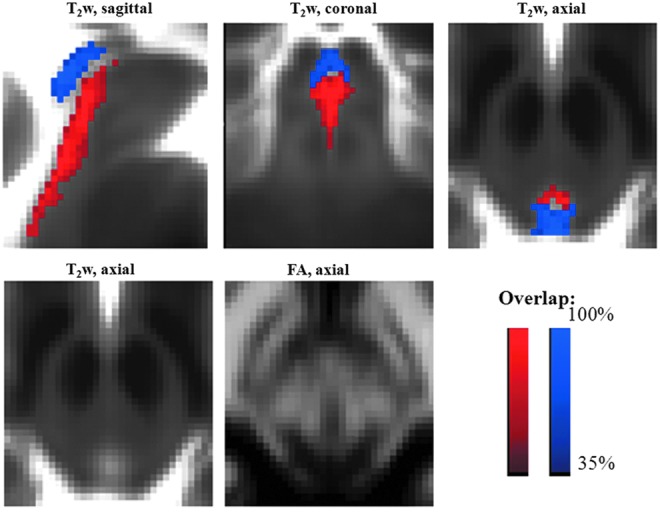
Probabilistic labels in MNI space of PAG and DR. Overlaid on the group average T2-weighted image (n=12) in IIT MNI space, probabilistic labels of the PAG (blue) and the DR (red) are shown. The PAG and the DR displayed similar T2-weighted signals (see, for example, in the bottom left panel the hypointense ring around the aqueduct of Sylvius) and differed by the level of FA (see bottom central panel), with the DR having a higher FA than the PAG, likely due to a higher content of oriented microstructures. The same coordinate system for sagittal (midline slice), coronal, and axial images as in Figure 3 is used (this is also the case for Figs. 5 and 6).
We further identified [as in previous work, see, for instance, Xiao et al. (2014)] midbrain nuclei, as the SN, the RN, and also, in the diencephalon, the STh (Fig. 5), by inspection of hypo-intense areas in T2-weighted images (see also Supplementary Fig. S2). Further, information conveyed by FA maps, which is complementary to conventional relaxivity (T2) properties, allowed the parcellation of each aforementioned nucleus visible in T2-weighted images into anatomically defined subnuclei based on their microstructural diffusion properties. With this complementary analysis of in vivo MRI data, we distinguished two sub-nuclei of the SN (SN1, SN2), with the former having lower FA values than the latter (Fig. 5, SN1 in blue and SN2 in red). SN1 and SN2 were compatible with pars reticulata (SNR) and pars compacta (SNC) of the SN, respectively, in terms of their location. The RN also contained a ventro-lateral region with lower FA (RN1) and a dorso-medial region of higher FA (RN2; Fig. 5). Finally, two roughly ellipsoid-shaped layers (a ventro-lateral, STh1, and dorso-medial, STh2, layer with lower and higher FA values, respectively) were visible in the STh (Fig. 5). FA and T2-weighted values in each subregion of the SN, RN, and STh are shown in Supplementary Figure S2. Notably, the developed multi-contrast approach employing resolution and distortion matched diffusion- and T2-weighted EPI provided images that naturally reside in a common space, hence avoiding misregistration-related confounds across anatomical images having different modality (e.g., contrast).
FIG. 5.
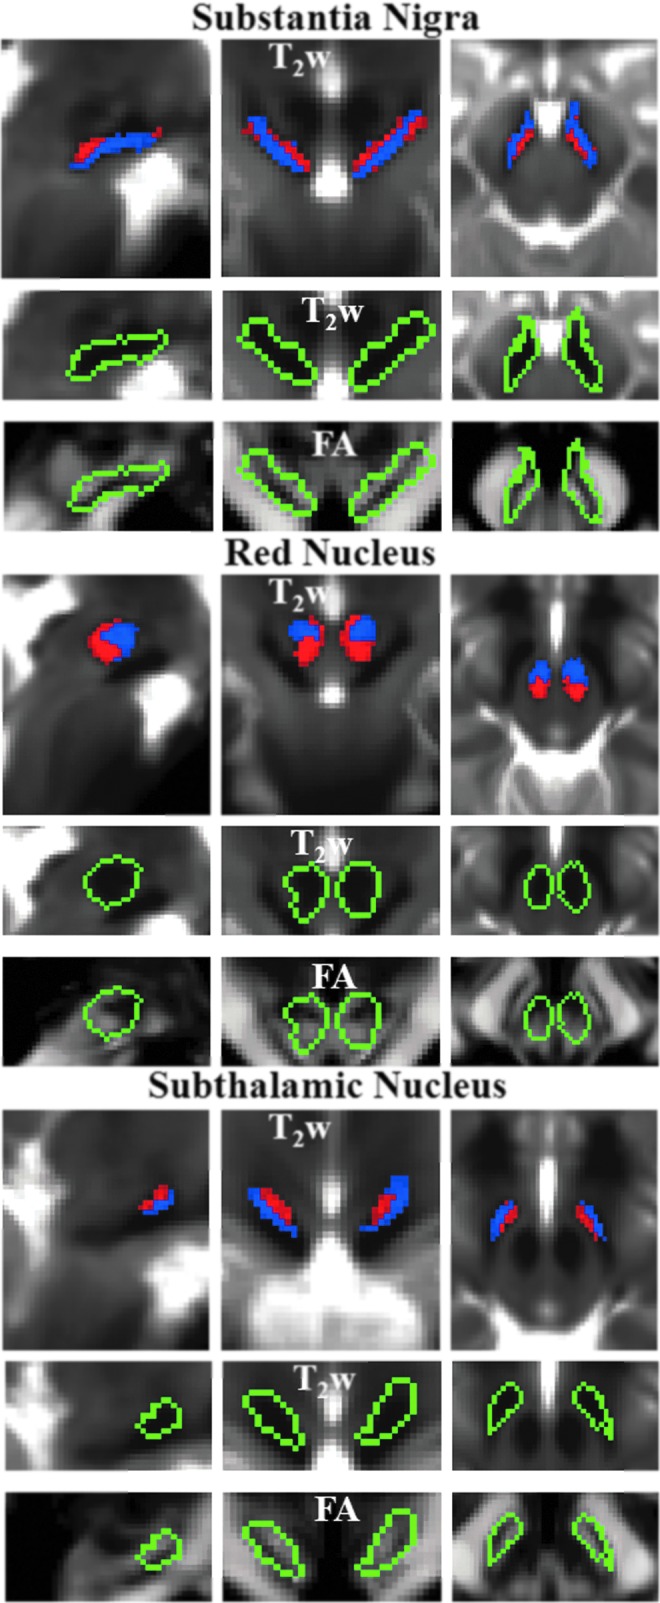
Probabilistic labels in MNI space of SN, RN, and STh. For each nucleus, we show: the probabilistic labels of two identified subregions (subregion 1/2=blue/red color, % overlap as in Fig. 4), overlaid on the group average T2-weighted image (n=12) in IIT MNI space on the top row panels; the contour plot (green) surrounding both subregions overlaid on the T2-weighted signal (zoomed view) in the middle row panels, and on the FA maps (zoomed view) in the bottom row panels. For each nucleus, the two subregions displayed similar T2-weighted signals but different diffusion FA values (subregion 1/2 having lower/higher FA values within each region). The two subregions of SN corresponded anatomically to SN pars reticulata (SNR) and pars compacta (SNC).
A high degree of spatial overlap was observed across subjects for all the developed Bn labels (Table 1): It should be noted that the maximum overlap was higher than 80% even for smaller Bn labels, such as the MnR, RMg, and STh [previous work, Keuken et al. (2014), reports a maximum overlap ranging between 53% and 77% for the STh and SN]. The volume (mean±SE across subjects) of each label in native space is also provided in Table 1.
The developed Bn labels constitute a preliminary neuroimaging template of Bn of the ascending arousal, autonomic, and motor systems; a 3D view of the template is shown in Figure 6.
FIG. 6.

Preliminary in vivo neuroimaging Bn template of the ascending arousal, autonomic, and motor systems. A 3D rendering (left/middle/right panel: lateral/fronto-lateral/posterior view) of all the developed Bn labels in MNI space is shown (background image: MNI152 T1-weighted MRI).
Finally, we investigated the use of the developed template of Bn to quantitatively evaluate brainstem hemorrhage in a severe TBI patient in a minimally conscious state who underwent 3 Tesla MRI. This analysis was performed to demonstrate the feasibility of clinical use of the developed Bn template in patients with disorders of consciousness due to brainstem lesions. In this case example, we aimed at localizing a patient's traumatic brainstem hemorrhages to specific Bn involved in arousal using conventional SWI acquired on a 3 Tesla MRI scanner and aligned to the template (MNI) space. The patient's traumatic hemorrhages were visible as hypointense regions in SWI, and involved primarily the DR (see Fig. 7), which contained the hemorrhages by 17.0% of its volume (3D volumetric measurement). Hemorrhage was also present (Fig. 7) in the left SN1 (13.5%), MnR (12.5%), left SN2 (11.9%), right SN1 (6.5%), right SN2 (3%), PAG (2%), and right STh2 (1.25%), while the other identified nuclei appeared unaffected by the hemorrhages (<1%).
FIG. 7.
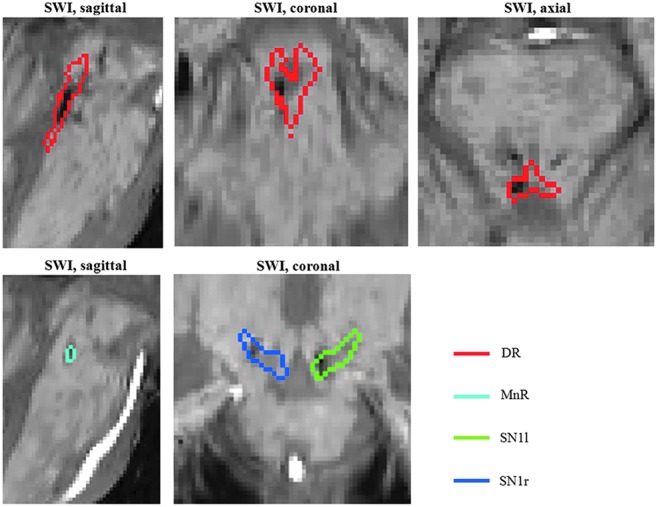
Quantitative evaluation of brainstem hemorrhage in a severe traumatic brain injury (TBI) patient in a minimal conscious state using the developed in vivo template of Bn. The susceptibility-weighted image (SWI) aligned to the IIT MNI space of the patient is shown, displaying hemorrhages (hypointense regions) within multiple Bn, including the DR (red contour plot), as well as the MnR and the SN1. For instance, the hemorrhages affected 17% of the DR's volume.
Discussion
In spite of the crucial functional role of Bn in human consciousness (Parvizi and Damasio, 2001), autonomic homeostasis, sensory-motor functions, sleep and wakefulness cycles, defensive behaviors, and nociception (Paxinos et al., 2012), visualization of Bn in vivo by structural MRI has shown slower progress compared with imaging of other brain areas. Indeed, except for a few midbrain nuclei (e.g., the SN and RN) and the STh (Chowdhury et al., 2013; Keuken et al., 2014; Kwon et al., 2012; Menke et al., 2010; Xiao et al., 2014), the lower relaxivity-based MRI contrast of Bn compared with the cortex (see for instance Fig. 1) has been a barrier to the in vivo structural identification of most Bn and hindered investigation of their functional and structural connections. For the clinician, these limitations prevent the precise localization of brainstem lesions, which would be relevant for diagnosis, prognosis, and therapeutic decision making in patients with brainstem pathology.
Here, we first emphasize the methodological advances that enabled us to overcome this barrier and to generate probabilistic labels of several Bn of the ascending arousal, autonomic, and motor systems. For each generated probabilistic label, we discuss the possible Bn contained in each label, and the tissue properties that might underlie the observed MRI contrasts (see Supplementary Materials). Finally, after highlighting the limitations of this work, we discuss the potential of the developed template to advance in vivo research and clinical investigation of the human brainstem.
Methodological advances
The findings of this work indicate that advanced MRI sequences and an ultra-high-field scanner enabled in vivo diffusion MRI with high sensitivity and spatial resolution [1.1 mm isotropic as opposed to the commonly employed 2 mm isotropic resolution (Dougherty et al., 2005; Kim et al., 2006) and to the 1.25 mm isotropic resolution employed in the Human Connectome Project (Sotiropoulos et al., 2013)], bringing a new level of detail and a valuable contrast for in vivo anatomical evaluation of the human brainstem. The use of a unipolar acquisition scheme (Stejskal and Tanner, 1965) enabled shortening of the TE by 30 msec, producing a sensitivity boost of ∼60% compared with a bipolar acquisition scheme (Reese et al., 2003). Our approach also included the application of a fully distortion- and resolution-matched multi-contrast anatomical acquisition in EPI space, which avoided co-registration-related confounding across contrasts and facilitated improved visualization of the anatomy in these complex brain regions. Crucially, the identification of several discrete human Bn was enabled by the use of high-resolution diffusion FA and T2-weighted MRI contrasts, which provided complementary information presumably related to differential myelin and iron contents, respectively. We speculate that the lack of T2-weighted contrast observed in this work between some Bn (for instance, the ION and the RMg) and neighboring WM might be due to a similar GM-WM iron content in these regions, which has been previously reported for some brain areas (Hallgren and Sourander, 1958). Under this circumstance, the use of the FA as an alternative contrast is, therefore, crucial to the identification of these nuclei.
In Supplementary Material, we discuss the labeling and tissue properties of each delineated Bn label.
Limitations of the in vivo preliminary template of Bn
In this work, we showed that FA was a crucial contrast in the identification of several Bn. Nevertheless, caution should be used when interpreting FA values, because they do not provide quantitative information about tissue content and structure, and can be affected by confounds. For example, crossing fibers rather than low myelin content might underlie low FA values. To further investigate the microstructural basis of the observed MRI contrasts, future work will involve postmortem imaging of human brain specimens with histological validation and in vivo evaluation of fiber orientation distributions.
Moreover, brainstem imaging is affected by physiological sources of instability related to heartbeat and respiration (mainly pulsatility in and around the CSF and larger vasculature). Therefore, physiological noise might have affected the definition of the borders of some Bn, such as the PAG and the DR (neighboring the CSF). In future work, it might be beneficial to investigate the use of physiologically gated EPI sequences or of retrospective correction (Mohammadi et al., 2013; O'Halloran et al., 2012) of physiological noise for Bn delineation.
In our multi-contrast MRI dataset, we identified additional areas of signal contrast compatible with Bn other than those examined here. However, this study was not intended to provide a comprehensive examination of all Bn. Instead, we aimed at demonstrating the feasibility of generating a probabilistic label of specific Bn relevant to our current research focus. Nonetheless, we predict that the methodology devised to outline the specific Bn presented in this work can be adapted to identify additional Bn. This may involve the use of the two signal contrasts analyzed here (diffusion- and T2-weighted imaging) as well as of additional types of MRI contrasts (for instance, quantitative susceptibility imaging, magnetization transfer, proton density, and quantitative relaxivity mapping) that have been used for brainstem imaging in previous studies (Chowdhury et al., 2013; Deistung at al., 2013; Lambert et al., 2013; Lehericy et al., 2014; Menke et al., 2010). In this context, different methodological approaches may also be explored, for instance, multi-channel segmentation rather than multi-parametric iterative segmentation of one contrast at a time, as adopted in this work.
Compared with extrapolations of postmortem human brainstem atlases into neuro-images, the developed Bn template, mostly based on MRI contrast, is expected to have higher spatial precision, and also a general validity at the population level (healthy adults). Nevertheless, this template might be refined in future work by using the developed Bn labels as spatial priors, as well as by using improved segmentation procedures. Crucially, future work using the developed Bn labels as spatial priors will also attempt fully automated segmentation of Bn in conventional (e.g., 3 Tesla) single-subject MRI in native space, to provide a fast and easy-to-use research and clinical tool that does not require intermediate registration steps.
Future studies will also focus on ex vivo histological validation with myelin and iron stains to elucidate the tissue properties underlying the observed MRI contrasts and to aid the identification of Bn pertaining to probabilistic labels. For very small Bn, it may be necessary to develop a brainstem template at a sub-millimeter spatial resolution. This high spatial resolution approach to expanding the template might also be explored for the purpose of developing a similar brainstem template in infants and children.
Potential of the in vivo preliminary template of Bn
This work presents a new neuroimaging tool, namely a preliminary in vivo 1 mm-isotropic template of several Bn of human adults in standard MNI space, which includes key Bn that mediate arousal, autonomic homeostasis, and components of the subcortical circuitry of the motor network. The template is a set of probabilistic labels, which will be publicly released at the MGH Athinoula A. Martinos Center for Biomedical Imaging website (http://InVivoBrainstemNucleiTemplate.martinos.org) as the “MGH Martinos Center In Vivo Probabilistic Template of Brainstem Nuclei.”
We foresee that this neuroimaging tool will bring new degrees of freedom to research and clinical investigation of several human Bn structure and function. In addition, this template can be used to elucidate the structural and functional connectivity of several human Bn within the arousal, autonomic, and motor networks. Considering that most fMRI and tractography methods employ ∼2 mm resolution data and 1 mm isotropic in vivo neuroimaging brain atlases of gray and WM structures (for instance, the HarvardOxford and JHU atlases, see description at http://fsl.fmrib.ox.ac.uk/fsl/fslwiki/Atlases), our tool is well suited for this purpose.
We also envision that the in vivo Bn template developed here might improve diagnosis, prognosis, and therapeutic decision making for a vast set of brainstem pathologies [e.g., disorders of consciousness (Edlow et al., 2013), sleep disorders (Brown et al., 2010; Saper et al., 2010), Parkinson's and motor diseases (Hanihara et al., 1998; Samii et al., 2004), chronic pain (Linnman et al., 2012), and altered autonomic functions (Kinney et al., 2009)]. For instance, the newly developed brainstem template in MNI space might be used in living patients to aid the localization of Bn relative to pathology (e.g., brainstem lesions) when the nuclei themselves are not visible with conventional MRI, to identify which pathways are implicated in the pathogenesis of diseases that involve the human brainstem, and to guide therapeutic interventions (e.g., pharmacologic neurotransmitter repletion and electro-physiologic deep brain stimulation). In this report, we underline the potential clinical utility of the template by using it to determine the specific Bn involved and percentage of tissue involvement in a minimally conscious patient with traumatic brainstem hemorrhages identified by conventional MRI. This case was selected because while brainstem lesions are implicated in the pathogenesis of coma and other disorders of consciousness after severe TBI (Edlow et al., 2013), there are currently no neuroimaging tools that allow precise localization of Bn affected by traumatic hemorrhages. As a consequence, the burden of injury within the brainstem arousal network that is critical to recovery of consciousness cannot be defined, severely limiting the accuracy of prognosis for patients with severe TBI. The results presented here enhance understanding of the specific Bn whose injury may have been implicated in causing this patient's acute coma and limited recovery to a minimally conscious state—information that was not available from the conventional clinical MRI data. Future studies might incorporate this information in prognostic models to improve the accuracy of outcome prediction for patients with traumatic coma and other disorders of consciousness.
Conclusion
In conclusion, in this work, we employed 7 Tesla multi-contrast imaging and semi-automated segmentation to demonstrate the feasibility of in vivo single-subject anatomical delineation of several human Bn. The developed procedure might prove useful in future in vivo 7 Tesla brainstem studies to identify these Bn on a single-subject basis. Further, we created a preliminary in vivo probabilistic neuroimaging template of 18 Bn in MNI stereotaxic space, which will be made available for research as well as for clinical use. The template might prove useful in localizing these Bn in future brainstem studies when the Bn themselves are not visible in conventional (e.g., 3 Tesla) neuroimages. We envision that this neuroimaging tool will facilitate diagnosis, prognosis, and therapeutic decision making in a vast array of brainstem disorders and enable a precise investigation of the functional and structural connectivity of the delineated Bn.
Supplementary Material
Acknowledgments
The authors thank Florian Beissner, Biancamaria Guarnieri, Karleyton C. Evans, Vitaly Napadow, and Valentina Calistri for fruitful discussion on Bn, and David Boas for his support. This work was supported by the following sources of funding: NIH NIBIB P41-RR014075, NIH NIBIB R01-EB000790, Center for Integration of Medicine and Innovative Technology (Boston, MA), the American Academy of Neurology, and the American Brain Foundation.
Author Disclosure Statement
No competing financial interest exists.
References
- Accolla EA, et al. . 2014. Brain tissue properties differentiate between motor and limbic basal ganglia circuits. Hum Brain Mapp 35:5083–5092 [DOI] [PMC free article] [PubMed] [Google Scholar]
- Aggarwal M, Zhang J, Pletnikova O, Crain B, Troncoso J, Mori S. 2013. Feasibility of creating a high-resolution 3D diffusion tensor imaging based atlas of the human brainstem: a case study at 11.7 T. Neuroimage 74:117–127 [DOI] [PMC free article] [PubMed] [Google Scholar]
- Armstrong DD, Assmann S, Kinney HC. 1999. Early developmental changes in the chemoarchitecture of the human inferior olive: a review. J Neuropathol Exp Neurol 58:1–11 [DOI] [PubMed] [Google Scholar]
- Avants BB, Tustison NJ, Song G, Cook PA, Klein A, Gee JC. 2011. A reproducible evaluation of ANTs similarity metric performance in brain image registration. Neuroimage 54:2033–2044 [DOI] [PMC free article] [PubMed] [Google Scholar]
- Benarroch EE. 2008. Subthalamic nucleus and its connections: anatomic substrate for the network effects of deep brain stimulation. Neurology 70:1991–1995 [DOI] [PubMed] [Google Scholar]
- Brown EN, Lydic R, Schiff ND. 2010. General anesthesia, sleep, and coma. N Engl J Med 363:2638–2650 [DOI] [PMC free article] [PubMed] [Google Scholar]
- Chowdhury R, Lambert C, Dolan RJ, Duzel E. 2013. Parcellation of the human substantia nigra based on anatomical connectivity to the striatum. Neuroimage 81:191–198 [DOI] [PMC free article] [PubMed] [Google Scholar]
- Deistung A, et al. . 2013. High-resolution MR imaging of the human brainstem in vivo at 7 Tesla. Front Hum Neurosci 7:710. [DOI] [PMC free article] [PubMed] [Google Scholar]
- Dougherty RF, Ben-Shachar M, Bammer R, Brewer AA, Wandell BA. 2005. Functional organization of human occipital-callosal fiber tracts. Proc Natl Acad Sci U S A 102:7350–7355 [DOI] [PMC free article] [PubMed] [Google Scholar]
- Duvernoy HM. 1999. Human Brain Stem Vessels: Including the Pineal Gland and Information on Brain Stem Infarction. Berlin: Springer [Google Scholar]
- Edlow BL, et al. . 2012. Neuroanatomic connectivity of the human ascending arousal system critical to consciousness and its disorders. J Neuropathol Exp Neurol 71:531–546 [DOI] [PMC free article] [PubMed] [Google Scholar]
- Edlow BL, et al. . 2013. Disconnection of the ascending arousal system in traumatic coma. J Neuropathol Exp Neurol 72:505–523 [DOI] [PMC free article] [PubMed] [Google Scholar]
- Francois C, Yelnik J, Tande D, Agid Y, Hirsch EC. 1999. Dopaminergic cell group A8 in the monkey: anatomical organization and projections to the striatum. J Comp Neurol 414:334–347 [PubMed] [Google Scholar]
- Giacino JT, Kalmar K, Whyte J. 2004. The JFK coma recovery scale-revised: measurement characteristics and diagnostic. Arch Phys Med Rehabil 85:2020–2029 [DOI] [PubMed] [Google Scholar]
- Hallgren B, Sourander P. 1958. The effect of age on the non-haemin iron in the human brain. J Neurochem 3:41–51 [DOI] [PubMed] [Google Scholar]
- Hanihara T, Amano N, Takahashi T, Itoh Y, Yagishita S. 1998. Hypertrophy of the inferior olivary nucleus in patients with progressive supranuclear palsy. Eur Neurol 39:97–102 [DOI] [PubMed] [Google Scholar]
- Keuken MC, et al. . 2014. Quantifying inter-individual anatomical variability in the subcortex using 7 T structural MRI. Neuroimage 94:40–46 [DOI] [PubMed] [Google Scholar]
- Kim M, Ronen I, Ugurbil K, Kim DS. 2006. Spatial resolution dependence of DTI tractography in human occipito-callosal region. Neuroimage 32:1243–1249 [DOI] [PubMed] [Google Scholar]
- Kinney HC, Richerson GB, Dymecki SM, Darnall RA, Nattie EE. 2009. The brainstem and serotonin in the sudden infant death syndrome. Annu Rev Pathol 4:517–550 [DOI] [PMC free article] [PubMed] [Google Scholar]
- Kwon DH, et al. . 2012. Seven-Tesla magnetic resonance images of the substantia nigra in Parkinson disease. Ann Neurol 71:267–277 [DOI] [PubMed] [Google Scholar]
- Lambert C, Lutti A, Helms G, Frackowiak R, Ashburner J. 2013. Multiparametric brainstem segmentation using a modified multivariate mixture of Gaussians. Neuroimage Clin 2:684–694 [DOI] [PMC free article] [PubMed] [Google Scholar]
- Lambert C, et al. . 2012. Confirmation of functional zones within the human subthalamic nucleus: patterns of connectivity and sub-parcellation using diffusion weighted imaging. Neuroimage 60:83–94 [DOI] [PMC free article] [PubMed] [Google Scholar]
- Lehericy S, Bardinet E, Poupon C, Vidailhet M, Francois C. 2014. 7 Tesla magnetic resonance imaging: a closer look at substantia nigra anatomy in Parkinson's disease. Mov Disord 29:1574–1581 [DOI] [PubMed] [Google Scholar]
- Linnman C, Moulton EA, Barmettler G, Becerra L, Borsook D. 2012. Neuroimaging of the periaqueductal gray: state of the field. Neuroimage 60:505–522 [DOI] [PMC free article] [PubMed] [Google Scholar]
- Menke RA, Jbabdi S, Miller KL, Matthews PM, Zarei M. 2010. Connectivity-based segmentation of the substantia nigra in human and its implications in Parkinson's disease. Neuroimage 52:1175–1180 [DOI] [PubMed] [Google Scholar]
- Mohammadi S, Hutton C, Nagy Z, Josephs O, Weiskopf N. 2013. Retrospective correction of physiological noise in DTI using an extended tensor model and peripheral measurements. Magn Reson Med 70:358–369 [DOI] [PMC free article] [PubMed] [Google Scholar]
- Naidich TP, et al. . 2009. Duvernoy's Atlas of the Human Brain Stem and Cerebellum High-Field MRI: Surface Anatomy, Internal Structure, Vascularization and 3D Sectional Anatomy. Wien; New York: Springer [Google Scholar]
- Niblock MM, et al. . 2005. Comparative anatomical assessment of the piglet as a model for the developing human medullary serotonergic system. Brain Res Brain Res Rev 50:169–183 [DOI] [PubMed] [Google Scholar]
- O'Halloran RL, Holdsworth S, Aksoy M, Bammer R. 2012. Model for the correction of motion-induced phase errors in multishot diffusion-weighted-MRI of the head: are cardiac-motion-induced phase errors reproducible from beat-to-beat? Magn Reson Med 68:430–440 [DOI] [PMC free article] [PubMed] [Google Scholar]
- Olszewski J, Baxter D. 1982. Cytoarchitecture of the human Brain Stem. Basel: Karger [Google Scholar]
- Parvizi J, Damasio A. 2001. Consciousness and the brainstem. Cognition 79:135–160 [DOI] [PubMed] [Google Scholar]
- Paul G, Gould DJ. 2010. The red nucleus: past, present, and future. Neuroanatomy 9:1–3 [Google Scholar]
- Paxinos G. 2012. The Marmoset Brain in Stereotaxic Coordinates. London; Waltham, MA: Academic Press [Google Scholar]
- Paxinos G, Huang XF. 1995. Atlas of the Human Brainstem. San Diego: Academic Press [Google Scholar]
- Paxinos G, Huang X, Sengul G, Watson C. 2012. Organization of Brainstem Nuclei. The Human Nervous System. Amsterdam: Elsevier Academic Press, pp. 260–327 [Google Scholar]
- Paxinos G, Watson C. 2007. The Rat Brain in Stereotaxic Coordinates. Amsterdam; Boston: Elsevier [Google Scholar]
- Reese TG, Heid O, Weisskoff RM, Wedeen VJ. 2003. Reduction of eddy-current-induced distortion in diffusion MRI using a twice-refocused spin echo. Magn Reson Med 49:177–182 [DOI] [PubMed] [Google Scholar]
- Samii A, Nutt JG, Ransom BR. 2004. Parkinson's disease. Lancet 363:1783–1793 [DOI] [PubMed] [Google Scholar]
- Saper CB, Fuller PM, Pedersen NP, Lu J, Scammell TE. 2010. Sleep state switching. Neuron 68:1023–1042 [DOI] [PMC free article] [PubMed] [Google Scholar]
- Satpute AB, et al. . 2013. Identification of discrete functional subregions of the human periaqueductal gray. Proc Natl Acad Sci U S A 110:17101–17106 [DOI] [PMC free article] [PubMed] [Google Scholar]
- Snyder AM, Connor JR. 2009. Iron, the substantia nigra and related neurological disorders. Biochim Biophys Acta 1790:606–614 [DOI] [PubMed] [Google Scholar]
- Soria G, et al. . 2011. Improved assessment of ex vivo brainstem neuroanatomy with high-resolution MRI and DTI at 7 Tesla. Anat Rec (Hoboken) 294:1035–1044 [DOI] [PubMed] [Google Scholar]
- Sotiropoulos SN, et al. . 2013. Advances in diffusion MRI acquisition and processing in the Human Connectome Project. Neuroimage 80:125–143 [DOI] [PMC free article] [PubMed] [Google Scholar]
- Stejskal EO, Tanner JE. 1965. Spin diffusion measurements: spin echoes in the presence of a time-dependent field gradient. J Chem Phys 42:288–292 [Google Scholar]
- Stern K. 1938. Note on the nucleus ruber magnocellularis and its efferent pathway in man. Brain 61:284–289 [Google Scholar]
- Varentsova A, Zhang S, Arfanakis K. 2014. Development of a high angular resolution diffusion imaging human brain template. Neuroimage 91:177–186 [DOI] [PMC free article] [PubMed] [Google Scholar]
- von Bonin G, Shariff GA. 1951. Extrapyramidal nuclei among mammals; a quantitative study. J Comp Neurol 94:427–438 [DOI] [PubMed] [Google Scholar]
- Xiao Y, et al. . 2014. Investigation of morphometric variability of subthalamic nucleus, red nucleus, and substantia nigra in advanced Parkinson's disease patients using automatic segmentation and PCA-based analysis. Hum Brain Mapp 35:4330–4344 [DOI] [PMC free article] [PubMed] [Google Scholar]
- Yelnik J, Percheron G. 1979. Subthalamic neurons in primates: a quantitative and comparative analysis. Neuroscience 4:1717–1743 [DOI] [PubMed] [Google Scholar]
Associated Data
This section collects any data citations, data availability statements, or supplementary materials included in this article.