

Abstract
Background
Activation of the PI3 kinase pathway occurs frequently in many adult cancers and is implicated in tumor cell proliferation, survival, and resistance to chemotherapy and radiotherapy. However, less is known regarding the relevance of this pathway in pediatric cancers. Here we have evaluated SAR245408, a novel small molecule PI3K inhibitor, against childhood cancer cell lines and xenografts.
Procedures
SAR245408 was tested against the PPTP in vitro cell line panel at concentrations from 10 nM to 100 µM and against the PPTP in vivo xenograft panels at a dose of 100 mg/kg administered orally daily × 14.
Results
In vitro SAR245408 demonstrated cytotoxic activity, with a median relative IC50 value of 10.9 µM (range 2.7 µM to 24.5 µM). SAR245408 was well tolerated in vivo, and all 44 tested xenograft models were evaluable for efficacy. SAR245408 induced significant differences in EFS distribution compared to control in 29 of 37 (79%) of solid tumor xenografts and in 2 of 7 (29%) ALL xenografts. SAR245408 induced tumor growth inhibition meeting criteria for intermediate EFS T/C activity (EFS T/C > 2) in 4 of 37 (11%) solid tumor xenografts. Intermediate EFS T/C activity was also observed for 2 of 7 (29%) evaluable ALL xenografts. Objective responses were not observed for solid tumor or for ALL xenografts.
Conclusions
Under the conditions evaluated in this study, SAR245408 achieved modest single-agent activity against most PPTP preclinical models. Further exploration of SAR245408 in combination with standard agents or with other signaling inhibitors could be considered.
Keywords: Preclinical Testing, Developmental Therapeutics, PI3K inhibitor
INTRODUCTION
Phosphatidylinositol 3-kinase (PI3K) plays a key role in signal transduction from viral oncoproteins and in transmitting signals from ligand-activated receptor tyrosine kinases [1–5]. Class I PI3Ks catalyze phosphorylation of phosphatidylinositol 4,5-biphosphate to phosphatidylinositol-3,4,5-triphosphate (PIP3), which binds to AKT and PDK1 at the plasma membrane. AKT is activated by phosphorylation by PDK1 at T308 and by mTOR/Rictor (TORC2) at S473. AKT promotes cell survival and proliferation by phosphorylation of GSK3α/β, FoxO, MDM2, BAD, and p27KIPI [6]. AKT also activates the mTOR/Raptor (TORC1) complex which regulates protein synthesis and cell growth [7].
Mutations in PIK3CA, the gene that encodes the p110α class IA PI3K catalytic subunit are present in a variety of cancers that arise in adults [4,8]. The PTEN phosphatase modulates PIP3 activity and has been identified as a tumor suppressor that is frequently inactivated in cancer by gene mutation and/or deletion and by promoter methylation [9,10]. Tyrosine kinase oncogenes (e.g., Bcr-Abl, HER2, MET, KIT, and others) are strong activators of the PI3K pathway [11]. Thus, inhibition of PI3K offers an attractive molecular target for cancer therapy with the potential for being synergistic with drugs targeting RTK’s [12].
A number of PI3K antagonists have been developed, all of which are ATP mimetics that act by binding reversibly to the ATP pocket of PI3K p110 [5]. SAR245408 is one such pan-PI3K inhibitor that has shown activity against breast, lung, and prostate cancer xenografts [5]. It has shown an acceptable toxicity profile as a single agent in an adult phase I study that also demonstrated an objective partial response and evidence of stable disease [13]. The NCI Pediatric Preclinical Testing Program (PPTP) has previously tested agents acting against other components of the PI3K signaling pathway, including rapamycin [14,15], the mTOR kinase inhibitor AZD8055 [16], and the AKT inhibitors GSK690693 and MK-2206 [17,18], all of which showed modest in vivo activity against the PPTP models. Here we report the evaluation of SAR245408 against the PPTP in vitro and in vivo (xenograft) models of childhood cancers.
MATERIALS AND METHODS
In vitro testing
In vitro testing was performed using DIMSCAN, a semiautomatic fluorescence-based digital image microscopy system that quantifies viable (using fluorescein diacetate [FDA]) cell numbers in tissue culture multiwell plates [19]. Cells were incubated in the presence of agent for 96 hours at concentrations from 10 nM to 100 µM with replicates of 6–12 for each concentration evaluated. Mean fluorescence values were determined for each concentration tested and then normalized to the mean control fluorescence for the line to determine relative mean fluorescence values. For analysis of in vitro testing results, a non-linear regression, sigmoidal dose-response model was fitted using GraphPad Prism 5.03 to the relative mean fluorescence values vs. the log-transformed concentration (X) for the in vitro PPTP study data:
The terms are defined as follows: rIC50 (relative IC50) is the concentration of agent that gives a response half way between Bottom and Top; HillSlope describes the steepness of the dose-response curve; and Top and Bottom are the plateaus in the T/C% values at low and high concentrations, respectively. Absolute IC50 values represent the concentration at which the agent reduces cell survival to 50% of the control value [20]. To compare activity between cell lines, the ratio of the median relative IC50 to individual cell line’s relative IC50 value is used (larger values connote greater sensitivity). The lowest T/C% value is the Ymin.
In vivo tumor growth inhibition studies
CB17SC scid−/− female mice (Taconic Farms, Germantown NY), were used to propagate subcutaneously implanted kidney/rhabdoid tumors, sarcomas (Ewing, osteosarcoma, rhabdomyosarcoma), neuroblastoma, and non-glioblastoma brain tumors, while BALB/c nu/nu mice were used for glioma models, as previously described [21]. Human leukemia cells were propagated by intravenous inoculation in female non-obese diabetic (NOD)/scid−/− mice as described previously [22]. Female mice were used irrespective of the patient gender from which the original tumor was derived. All mice were maintained under barrier conditions and experiments were conducted using protocols and conditions approved by the institutional animal care and use committee of the appropriate consortium member. Eight to ten mice were used in each control or treatment group. Tumor volumes (cm3) [solid tumor xenografts] or percentages of human CD45-positive [%hCD45+] cells [ALL xenografts] were determined and responses were determined using three activity measures as previously described [21]. An in-depth description of the analysis methods is included in the Supplemental Response Definitions section.
Western immunoblotting
Levels of Akt, phospho-Akt, and PTEN were determined by western immunoblot analysis as previously described [23]. Primary antibodies used were against GAPDH, PTEN, Akt, phospho-Akt(T308), and phospho-Akt(S473) (Cell Signaling Technologies, Beverley, MA). Immunoreactive bands were visualized using SuperSignal Chemiluminescence substrate (Pierce) and Biomax MR and XAR film (Eastman Kodak Co.).
Statistical Methods
The exact log-rank test, as implemented using Proc StatXact for SAS®, was used to compare event-free survival distributions between treatment and control groups. P-values were two-sided and were not adjusted for multiple comparisons given the exploratory nature of the studies.
Drugs and Formulation
SAR245408 was provided to the Pediatric Preclinical Testing Program by Exelixis Inc., through the Cancer Therapy Evaluation Program (NCI). Powder was stored at room temperature, protected from light. Drug was formulated in 10 mM HCl, in sterile water for injection, sonicated to form a fine suspension, and made fresh prior to administration. SAR245408 was administered orally (PO) at 100 mg/kg to mice using a daily schedule for 14 days, with a further 4 weeks of observation. SAR245408 was provided to each consortium investigator in coded vials for blinded testing.
RESULTS
In vitro testing
SAR245408 demonstrated cytotoxic activity, with Ymin values approaching 0% for all of the cell lines at the highest concentration tested (100 µM). The median relative IC50 (rIC50) value for the PPTP cell lines was 10.9 µM, with a range from 2.7 µM (CHLA-10) to 24.5 µM (TC-71), Table I. There were no significant differences by histotype in median rIC50 values, though there was a trend for lower values for the rhabdomyosarcoma panel (median rIC50 5.6 µM) and higher values for the neuroblastoma panel (median rIC50 19.5 µM). A metric used to compare the relative responsiveness of the PPTP cell lines to SAR245408 is the ratio of the median rIC50 of the entire panel to that of each cell line, Figure 1. Higher ratios are indicative of greater sensitivity to SAR245408 and are shown in the figure by bars to the right of the midpoint line. Figure 1 illustrates the higher sensitivity for the rhabdomyosarcoma cell lines and the lower sensitivity for the neuroblastoma cell lines.
Table I.
In vitro activity of SAR245408 against representative panel of PPTP cell lines.
| Cell Line | Histotype | Relative IC50 (µM) |
R2 | Panel R_IC50/ Line R_IC50 |
|---|---|---|---|---|
| RD | RMS | 5.3 | 0.959 | 2.05 |
| Rh41 | RMS | 5.3 | 0.948 | 2.06 |
| Rh18 | RMS | 5.8 | 0.966 | 1.88 |
| Rh30 | RMS | 11.3 | 0.964 | 0.97 |
| BT-12 | Rhabdoid | 16.1 | 0.954 | 0.68 |
| SJ-GBM2 | GBM | 18.9 | 0.975 | 0.58 |
| CHLA-266 | Rhabdoid | 7.7 | 0.983 | 1.41 |
| CHLA-9 | Ewing | 6.8 | 0.850 | 1.60 |
| CHLA-10 | Ewing | 2.7 | 0.959 | 4.04 |
| CHLA-258 | Ewing | 10.2 | 0.947 | 1.07 |
| TC-71 | Ewing | 24.5 | 0.950 | 0.45 |
| NB-1643 | NB | 20.3 | 0.965 | 0.54 |
| NB-EBc1 | NB | 23.9 | 0.953 | 0.46 |
| CHLA-90 | NB | 8.5 | 0.978 | 1.28 |
| CHLA-136 | NB | 18.7 | 0.948 | 0.58 |
| NALM-6 | ALL | 7.6 | 0.990 | 1.44 |
| COG-LL-317 | ALL | 13.2 | 0.930 | 0.83 |
| RS4;11 | ALL | 3.8 | 0.974 | 2.87 |
| MOLT-4 | ALL | 10.6 | 0.957 | 1.03 |
| CCRF-CEM GM | ALL | 14.5 | 0.966 | 0.76 |
| CCRF-CEM SY | ALL | 14.3 | 0.959 | 0.77 |
| Kasumi-1 | AML | 3.8 | 0.977 | 2.91 |
| Karpas-299 | NHL | 13.1 | 0.946 | 0.84 |
| Ramos-RA1 | NHL | 21.5 | 0.970 | 0.51 |
| Median | 10.9 | 0.96 | 1.00 | |
| Minimum | 2.7 | 0.85 | 0.45 | |
| Maximum | 24.5 | 0.99 | 4.04 |
Figure 1.
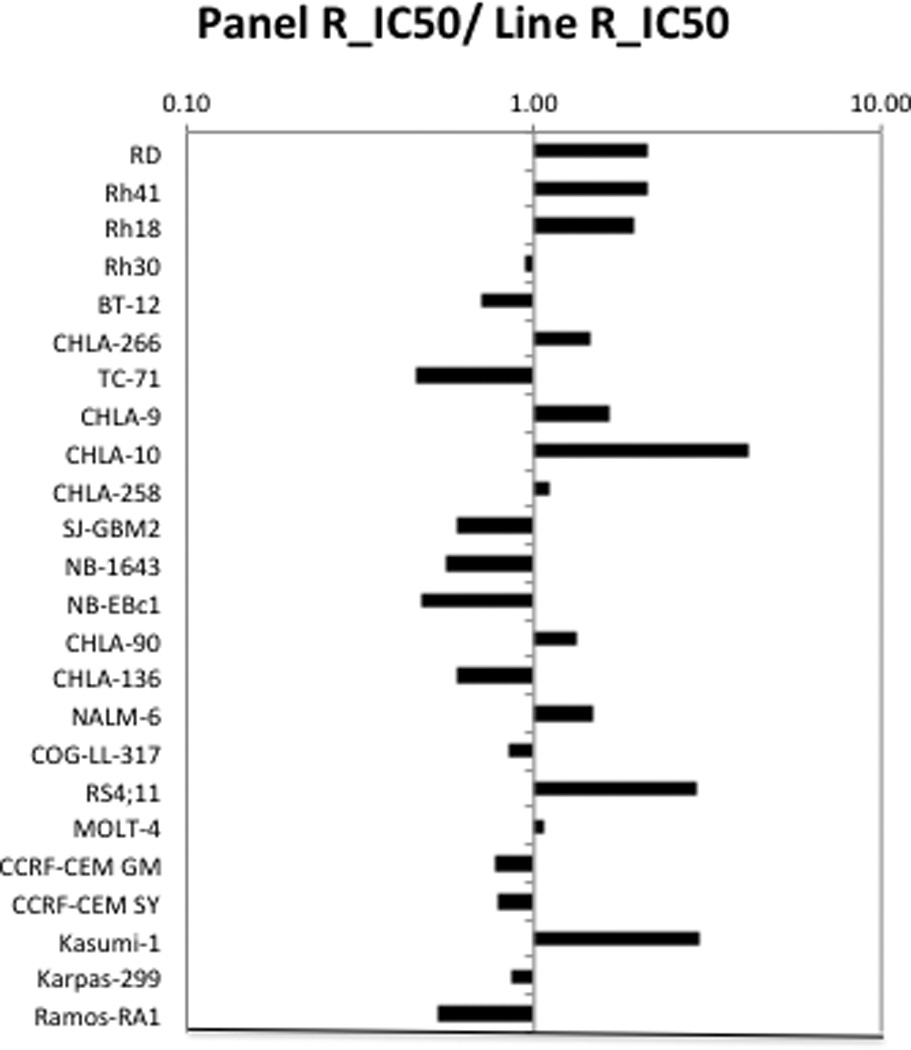
SAR245408 in vitro activity: The median rIC50 ratio graph shows the relative rIC50 values for the cell lines of the PPTP panel. Each bar represents the ratio of the panel rIC50 to the rIC50 value of the indicated cell line. Bars to the right represent cell lines with higher sensitivity, while bars to the left indicate cell lines with lesser sensitivity.
In vivo testing
SAR245408 was tested against the PPTP xenografts using a dose of 100 mg/kg administered orally daily for 14 days. The total planned observation period was 6 weeks. SAR245408 was well tolerated, with only 0.7% toxicity rate in the treated groups, similar to that observed for control animals. All 44 tested xenograft models were considered evaluable for efficacy. A complete summary of results is provided in Supplemental Table I, including total numbers of mice, number of mice that died (or were otherwise excluded), numbers of mice with events and average times to event, tumor growth delay, as well as numbers of responses and T/C values.
SAR245408 induced significant differences in EFS distribution compared to control in 30 of 37 (81%) of the evaluable solid tumor xenografts and in 2 of 7 (29%) of the evaluable ALL xenografts, Table II. For those xenografts with a significant difference in EFS distribution between treated and control groups, the EFS T/C activity measure additionally requires an EFS T/C value of > 2.0 for intermediate activity and indicates a substantial agent effect in slowing tumor growth. High activity further requires a reduction in final tumor volume compared to the starting tumor volume. SAR245408 induced tumor growth inhibition meeting criteria for intermediate EFS T/C activity in 4 of 37 (11%) evaluable solid tumor xenografts, Table II. Intermediate activity for the EFS T/C metric was observed in the following panels: rhabdomyosarcoma (2 of 6), neuroblastoma (1 of 5), medulloblastoma (1 of 2) and rhabdoid tumor (1 of 3). Of note, growth of Rh10 rhabdomyosarcoma xenografts was completely inhibited for the duration of SAR245408 treatment. For the ALL panel, 2 of 7 (29%) xenografts met criteria for intermediate EFS T/C activity.
| Line | Tumor Type | Time to Event |
P-value | EFS T/C |
Median RTV/CD45 at End of Study |
T/C1 | Response2 | T/C Activity1 |
EFS T/C Activity3 |
|---|---|---|---|---|---|---|---|---|---|
| BT-29 | Rhabdoid | 32.5 | 0.118 | 1.2 | >4 | 0.77 | PD1 | Low | Low |
| KT-16 | Rhabdoid | 24.2 | <0.001 | 2.3 | >4 | 0.29 | PD2 | Int | Int |
| KT-14 | Rhabdoid | 23.1 | 0.191 | 1.1 | >4 | 0.88 | PD1 | Low | Low |
| KT-10 | Wilms | 19.1 | <0.001 | 1.6 | >4 | 0.41 | PD2 | Int | Low |
| KT-11 | Wilms | 23.4 | <0.001 | 1.3 | >4 | 0.57 | PD1 | Low | Low |
| KT-13 | Wilms | 16.8 | 0.014 | 1.4 | >4 | 0.62 | PD1 | Low | Low |
| SK-NEP-1 | Ewing | 17.6 | 0.004 | 1.6 | >4 | 0.37 | PD2 | Int | Low |
| EW5 | Ewing | 14.0 | 0.045 | 1.3 | >4 | 0.68 | PD1 | Low | Low |
| EW8 | Ewing | 12.6 | 0.737 | 1.3 | >4 | 0.85 | PD1 | Low | Low |
| TC-71 | Ewing | 15.5 | 0.058 | 1.3 | >4 | 0.79 | PD1 | Low | Low |
| CHLA258 | Ewing | 22.4 | 0.002 | 1.4 | >4 | 0.44 | PD1 | Int | Low |
| Rh10 | ALV RMS | 31.6 | <0.001 | 1.7 | >4 | 0.25 | PD2 | Int | Low |
| Rh28 | ALV RMS | 23.3 | 0.043 | 1.2 | >4 | 0.73 | PD1 | Low | Low |
| Rh30 | ALV RMS | 23.7 | <0.001 | 1.4 | >4 | 0.49 | PD1 | Low | Low |
| Rh30R | ALV RMS | 21.7 | <0.001 | 1.7 | >4 | 0.42 | PD2 | Int | Low |
| Rh41 | ALV RMS | 20.3 | <0.001 | 2.9 | >4 | 0.46 | PD2 | Low | Int |
| Rh18 | EMB RMS | 20.0 | <0.001 | 2.1 | >4 | 0.39 | PD2 | Int | Int |
| BT-45 | Medulloblastoma | 6.2 | 0.010 | 1.4 | >4 | 0.54 | PD1 | Low | Low |
| BT-50 | Medulloblastoma | 39.6 | 0.651 | . | >4 | 0.76 | PD1 | Low | NE |
| BT-36 | Ependymoma | > EP | 0.087 | . | 2.8 | 0.58 | PD2 | Low | NE |
| GBM2 | Glioblastoma | 35.8 | 0.037 | 1.4 | >4 | 0.57 | PD1 | Low | Low |
| BT-39 | Glioblastoma | 11.1 | 0.006 | 1.3 | >4 | 0.73 | PD1 | Low | Low |
| D645 | Glioblastoma | 13.1 | 0.003 | 1.7 | >4 | 0.66 | PD2 | Low | Low |
| D456 | Glioblastoma | 14.6 | 0.014 | 1.8 | >4 | 0.79 | PD2 | Low | Low |
| D212 | Glioblastoma | 30.3 | 0.070 | 1.9 | >4 | 0.57 | PD2 | Low | Low |
| NB-SD | Neuroblastoma | 16.0 | 0.023 | 1.8 | >4 | 0.73 | PD2 | Low | Low |
| NB-1771 | Neuroblastoma | 10.2 | 0.004 | 1.6 | >4 | 0.77 | PD2 | Low | Low |
| NB-1691 | Neuroblastoma | 5.9 | 0.013 | 1.2 | >4 | 0.81 | PD1 | Low | Low |
| NB-EBc1 | Neuroblastoma | 10.2 | <0.001 | 2.4 | >4 | 0.34 | PD2 | Int | Int |
| CHLA-79 | Neuroblastoma | 19.3 | <0.001 | 1.9 | >4 | 0.46 | PD2 | Low | Low |
| NB-1643 | Neuroblastoma | 19.4 | 0.001 | 1.5 | >4 | 0.55 | PD1 | Low | Low |
| OS-1 | Osteosarcoma | > EP | 0.791 | . | 3.1 | 0.79 | PD2 | Low | NE |
| OS-2 | Osteosarcoma | 24.4 | <0.001 | 1.2 | >4 | 0.81 | PD1 | Low | Low |
| OS-17 | Osteosarcoma | 28.5 | 0.008 | 1.1 | >4 | 0.79 | PD1 | Low | Low |
| OS-9 | Osteosarcoma | 34.9 | <0.001 | 1.3 | >4 | 0.68 | PD1 | Low | Low |
| OS-33 | Osteosarcoma | 19.8 | 0.006 | 1.1 | >4 | 0.84 | PD1 | Low | Low |
| OS-31 | Osteosarcoma | 28.0 | <0.001 | 1.1 | >4 | 0.84 | PD1 | Low | Low |
| ALL-4 | ALL B-precursor | 3.0 | 0.446 | 1.0 | >25 | . | PD1 | Low | |
| ALL-7 | ALL B-precursor | 28.8 | 0.005 | 4.5 | >25 | . | PD2 | Int | |
| ALL-8 | ALL T-cell | 4.4 | 0.830 | 0.8 | >25 | . | PD1 | Low | |
| ALL-17 | ALL B-precursor | 17.1 | <0.001 | 2.9 | >25 | . | PD2 | Int | |
| ALL-19 | ALL B-precursor | 5.0 | 0.929 | 1.0 | >25 | . | PD1 | Low | |
| ALL-31 | ALL T-cell | 8.8 | 0.136 | 1.9 | >25 | . | PD2 | Low | |
| MLL-7 | ALL B-precursor | 3.3 | 0.415 | 1.2 | >25 | . | PD1 | Low |
Tumor Volume T/C value: Relative tumor volumes (RTV) for control (C) and treatment (T) mice were calculated at day 21 or when all mice in the control and treated groups still had measurable tumor volumes (if less than 21 days). The T/C value is the mean RTV for the treatment group divided by the mean RTV for the control group. High activity = T/C ≤ 0.15; Intermediate activity = T/C ≤ 0.45 but > 0.15; and Low activity = T/C > 0.45.
Objective response measures are described in detail in the Supplemental Response Definitions. PD1 = progressive disease with EFS T/C ≤ 1.5, and PD2 = progressive disease with EFS T/C > 1.5.
EFS T/C values = the ratio of the median time to event of the treatment group and the median time to event of the respective control group. High activity requires: a) an EFS T/C > 2; b) a significant difference in EFS distributions, and c) a net reduction in median tumor volume for animals in the treated group at the end of treatment as compared to at treatment initiation. Intermediate activity = criteria a) and b) above, but not having a net reduction in median tumor volume for treated animals at the end of the study. Low activity = EFS T/C < 2.
Objective responses were not observed in either solid tumor or ALL xenograft panels. The in vivo testing results for the objective response measure of activity are presented in Figure 2 in a ‘heat-map’ format as well as a ‘COMPARE’-like format, based on the scoring criteria described in the Supplemental Response Definitions section. The latter analysis demonstrates relative tumor sensitivities around the midpoint score of 5 (stable disease). Examples of tumor growth curves meeting criteria for intermediate EFS T/C activity (Rh18, Rh41, and ALL-7) or showing significant tumor growth delay (Rh10) are presented in Figure 3.
Figure 2.
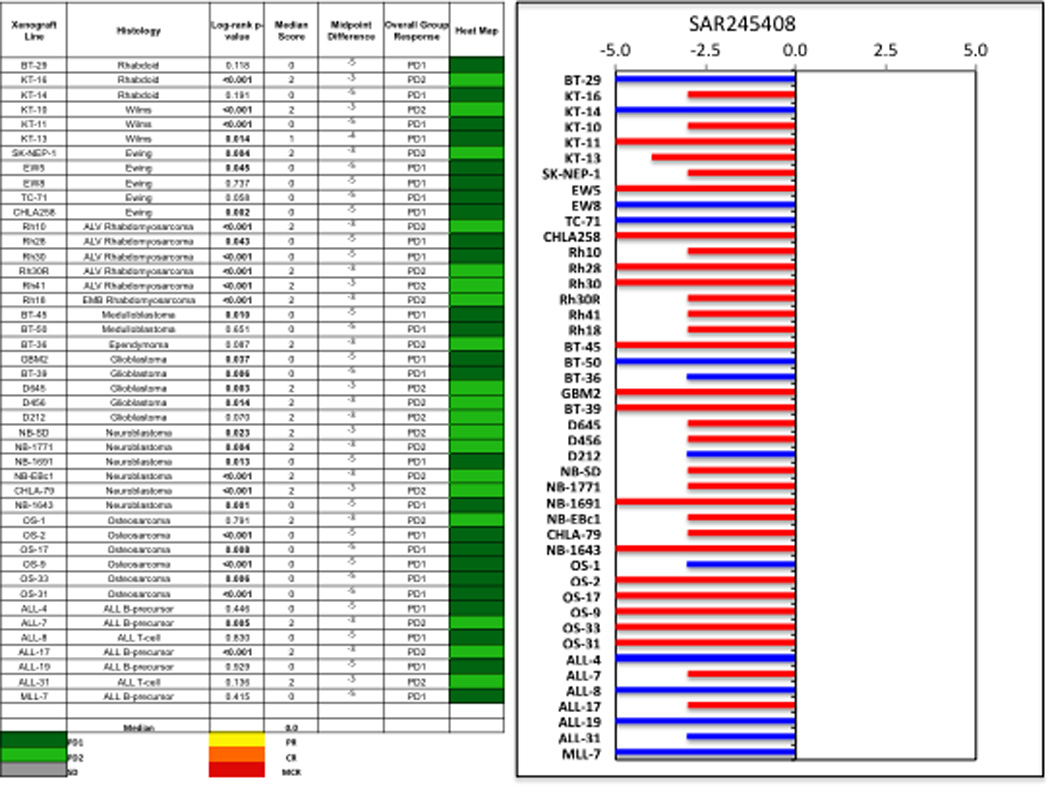
SAR245408 in vivo objective response activity. Left: The colored heat map depicts group response scores. A high level of activity is indicated by a score of 6 or more, intermediate activity by a score of ≥2 but <6, and low activity by a score of <2. Right: representation of tumor sensitivity based on the difference of individual tumor lines from the midpoint response (stable disease). Bars to the right of the median represent lines that are more sensitive, and to the left are tumor models that are less sensitive. Red bars indicate lines with a significant difference in EFS distribution between treatment and control groups, while blue bars indicate lines for which the EFS distributions were not significantly different.
Figure 3.

SAR245408 activity in vivo against individual tumor xenografts. Rhabdomyosarcomas (Rh10, Rh18, Rh41): Kaplan-Meier curves for EFS (left), median relative tumor volume graphs (center), and individual tumor volume graphs (right) are shown for selected lines. ALL-7 (bottom panels): Kaplan-Meier curves showing the EFS (left), median leukemia engraftment (center) as detected in peripheral blood, and individual leukemia engraftment (right). Controls (gray lines); Treated (black lines), statistical significance (p values) of the difference between treated and control groups are included.
The gene expression pattern of Class I PI3K isoforms is shown in Figure 4A. There is less variation in expression for PIK3CA than for other isoforms, and its expression is highest for the osteosarcoma and ALL xenografts and is lower for the rhabdomyosarcoma xenografts. PIK3CB is expressed at highest levels in low grade (BT-35 and BT-40) and high-grade glioma xenografts (e.g., GBM2 and BT-39). The most striking observation is the pattern of expression of PIK3CD, which is virtually restricted to the ALL and lymphoma cell lines and xenografts, as would be expected from the hematopoietic cell specificity of this isoform in normal tissues [24]. Phospho-AKT and PTEN expression for solid tumor xenografts are shown in Figure 4B. Phospho-AKT is detectable for many xenografts in the PPTP solid tumor panels, while PTEN low expression (consistent with PTEN deletion) is uncommon. Given the small number of solid tumor xenografts with EFS T/C values > 2 and the lack of objective responses, it is not possible to relate phospho-AKT levels to SAR245408 activity. Phospho-AKT levels are not distinctive for the 4 xenografts with EFS T/C > 2 (KT-16, Rh41, Rh18, and NB-EBc1) compared to the remaining xenografts.
Figure 4.
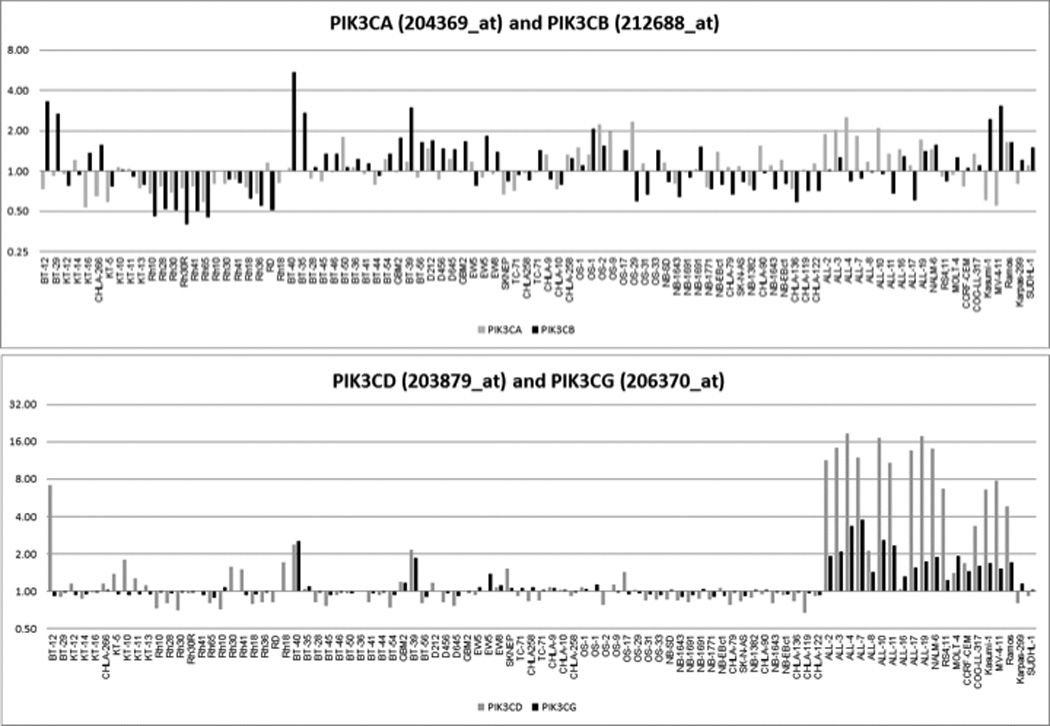
Characteristics of PI3K-Akt signaling in pediatric solid tumor xenografts. A. Expression levels of Class I PI3K isoforms from Affymetrix profiling (http://pptp.nchresearch.org/data.html); B. Protein levels for PTEN, Akt and phospho-Akt in solid tumor xenografts.
DISCUSSION
SAR245408 demonstrated micromolar level activity against the panel of 23 pediatric cancer cell lines, with a median rIC50 of 10.9 µM. The micromolar level rIC50 values for SAR245408 contrast with its enzymatic activity on PI3K alpha, delta and gamma (IC50 in the 20–40 nM range), which may reflect its high serum protein binding [25]. The pattern of response to SAR245408 against the PPTP in vitro models showed some similarities to that observed for the AKT inhibitors GSK690693 [19] and MK-2206 [8]. For example, the rhabdomyosarcoma cell lines Rh41 and Rh18 and the Ewing cell line CHLA-10 showed relative sensitivity to all three agents. However, the activity pattern of the AKT inhibitors differed from that of SAR245408 in the greater relative sensitivity of the ALL cell lines to the AKT inhibitors compared to SAR245408. Heterogeneity was evident in the in vitro response of the Ewing cell lines to SAR245408 (Figure 1), which may be the result of as yet unidentified differences in dependence on the PI3K pathway of various Ewing tumors.
The majority of the solid tumor xenografts (81%) treated with SAR245408 showed a statistically significant improvement in EFS compared to control, and values of EFS T/C > 2 indicative of an intermediate level of activity were noted for 14% of models tested. The rhabdomyosarcoma panel was the only solid tumor panel to have more than one model with an EFS T/C value > 2. The mTOR kinase inhibitor AZD8055 also showed greater tumor growth inhibition for the rhabdomyosarcoma panel compared to other tumor panels [18], but this was not observed for the two AKT inhibitors (GSK690693 and MK-2206) evaluated by the PPTP [8][19]. The lack of objective responses is consistent with a cytostatic effect of SAR245408. However, it is also possible that some effects observed in vivo were due to SAR245408 acting on the tumor microenvironment.
The PIK3CD specific inhibitor GS-1101 (CAL-101) has shown preclinical and clinical activity against adult lymphoid malignancies such as chronic lymphocytic leukemia (CLL) and non-Hodgkin lymphoma (NHL), but its activity in ALL is not yet defined [26]. SAR245408 shows approximately equal enzyme inhibitory activity against PIK3CA and PIK3CD [25,27]. Future research will be required to determine whether a lack of remission-inducing in vivo activity against PIK3CD-expressing ALL xenografts in this study is the result of failure to achieve sufficiently high and prolonged levels of PIK3CD inhibition or is the result of intrinsic resistance of the ALL xenografts to PIK3CD inhibition.
The role of PI3K/AKT in childhood cancers is not well defined, though there is evidence that the pathway is activated in some pediatric malignancies [18,28]. For example, high phosphorylation levels of Akt(S473) were associated with poor overall and poor disease-free survival for rhabdomyosarcoma patients [29], and activation of PI3K signaling has been reported for neuroblastoma [30–32] and medulloblastoma [33–35]. However, whole exome and/or whole genome sequencing applied to approximately 100 high-risk neuroblastoma tumor specimens did not identify recurring mutations in PI3K pathway genes [36,37]. Likewise, recurring genomic alterations in PI3K pathway genes appear to be uncommon in high-risk B-precursor ALL cases [38]. A targeted mutation screen identified PIK3CA mutations in 5% (3/60) of embryonal rhabdomyosarcoma cases, but mutations were not seen in the neuroblastoma (n=192), Ewing sarcoma (n=75), or alveolar rhabdomyosarcoma (n=29) specimens evaluated [39], Additionally, mutations in PIK3R1 were not observed [39]. PIK3CA mutations are also uncommon in medulloblastoma tumor specimens [40–42]. As genomic alterations in target genes have been the most reliable predictor of robust antitumor activity for molecularly targeted agents, the paucity of mutations in PI3K family genes reported for pediatric cancers argues against the expectation of single agent in vivo activity for PI3K inhibitors in the pediatric setting, consistent with our findings.
The current study suggests that a development plan for SAR245408 as a single agent for pedatric cancers should employ a focused approach. As more is learned about the role of the PI3K pathway in pediatric cancers, it may become possible to identify selected subsets of childhood cancers that may be highly responsive to PI3K inhibitors as single agents, including subsets not represented in the current PPTP in vitro and in vivo models. Additional research opportunities for future pediatric preclinical evaluations of SAR245408 include evaluating it in combination with other therapies [43].
Supplementary Material
ACKNOWLEDGEMENTS
This work was supported by NO1-CM-42216, CA21765, and CA108786 from the National Cancer Institute and used SAR245408 supplied by Exelixis Inc., San Francisco, CA.
Footnotes
Conflict of interest statement: The authors consider that there are no actual or perceived conflicts of interest.
In addition to the authors this paper represents work contributed by the following: Sherry Ansher, Ingrid Boehm, Joshua Courtright, Kathryn Evans, Edward Favours, Henry S. Friedman, Danuta Gasinski, Melissa Sammons, Chandra Tucker, Joe Zeidner, Jianrong Wu, Ellen Zhang, and Jian Zhang.
References
- 1.Courtney KD, Corcoran RB, Engelman JA. The PI3K pathway as drug target in human cancer. Journal of clinical oncology : official journal of the American Society of Clinical Oncology. 2010;28(6):1075–1083. doi: 10.1200/JCO.2009.25.3641. [DOI] [PMC free article] [PubMed] [Google Scholar]
- 2.Hennessy BT, Smith DL, Ram PT, et al. Exploiting the PI3K/AKT pathway for cancer drug discovery. Nature reviews Drug discovery. 2005;4(12):988–1004. doi: 10.1038/nrd1902. [DOI] [PubMed] [Google Scholar]
- 3.Luo J, Manning BD, Cantley LC. Targeting the PI3K-Akt pathway in human cancer: rationale and promise. Cancer Cell. 2003;4(4):257–262. doi: 10.1016/s1535-6108(03)00248-4. [DOI] [PubMed] [Google Scholar]
- 4.Vivanco I, Sawyers CL. The phosphatidylinositol 3-Kinase AKT pathway in human cancer. Nat Rev Cancer. 2002;2(7):489–501. doi: 10.1038/nrc839. [DOI] [PubMed] [Google Scholar]
- 5.Markman B, Dienstmann R, Tabernero J. Targeting the PI3K/Akt/mTOR pathway--beyond rapalogs. Oncotarget. 2010;1(7):530–543. doi: 10.18632/oncotarget.188. [DOI] [PMC free article] [PubMed] [Google Scholar]
- 6.Manning BD, Cantley LC. AKT/PKB signaling: navigating downstream. Cell. 2007;129(7):1261–1274. doi: 10.1016/j.cell.2007.06.009. [DOI] [PMC free article] [PubMed] [Google Scholar]
- 7.Shor B, Gibbons JJ, Abraham RT, et al. Targeting mTOR globally in cancer: thinking beyond rapamycin. Cell Cycle. 2009;8(23):3831–3837. doi: 10.4161/cc.8.23.10070. [DOI] [PubMed] [Google Scholar]
- 8.Samuels Y, Wang Z, Bardelli A, et al. High frequency of mutations of the PIK3CA gene in human cancers. Science. 2004;304(5670):554. doi: 10.1126/science.1096502. [DOI] [PubMed] [Google Scholar]
- 9.Georgescu MM. PTEN Tumor Suppressor Network in PI3K-Akt Pathway Control. Genes Cancer. 2010;1(12):1170–1177. doi: 10.1177/1947601911407325. [DOI] [PMC free article] [PubMed] [Google Scholar]
- 10.Keniry M, Parsons R. The role of PTEN signaling perturbations in cancer and in targeted therapy. Oncogene. 2008;27(41):5477–5485. doi: 10.1038/onc.2008.248. [DOI] [PubMed] [Google Scholar]
- 11.Engelman JA, Luo J, Cantley LC. The evolution of phosphatidylinositol 3-kinases as regulators of growth and metabolism. Nat Rev Genet. 2006;7(8):606–619. doi: 10.1038/nrg1879. [DOI] [PubMed] [Google Scholar]
- 12.Chakrabarty A, Sanchez V, Kuba MG, et al. Feedback upregulation of HER3 (ErbB3) expression and activity attenuates antitumor effect of PI3K inhibitors. Proc Natl Acad Sci U S A. 2011 doi: 10.1073/pnas.1018001108. [DOI] [PMC free article] [PubMed] [Google Scholar]
- 13.Edelman G, Bedell C, Shapiro Gea. A phase I dose-escalation study of XL147 (SAR245408), a P13K inhibitor administred orally to patients (pts) with advanced malignancies. J Clinical Oncology. 2010;28:3003. [Google Scholar]
- 14.Houghton PJ, Morton CL, Kolb EA, et al. Initial testing (stage 1) of the mTOR inhibitor rapamycin by the pediatric preclinical testing program. Pediatric blood & cancer. 2008;50(4):799–805. doi: 10.1002/pbc.21296. [DOI] [PubMed] [Google Scholar]
- 15.Houghton PJ, Morton CL, Gorlick R, et al. Stage 2 combination testing of rapamycin with cytotoxic agents by the Pediatric Preclinical Testing Program. Molecular cancer therapeutics. 2010;9(1):101–112. doi: 10.1158/1535-7163.MCT-09-0952. [DOI] [PMC free article] [PubMed] [Google Scholar]
- 16.Houghton PJ, Gorlick R, Kolb EA, et al. Initial testing (stage 1) of the mTOR kinase inhibitor AZD8055 by the pediatric preclinical testing program. Pediatric blood & cancer. 2012;58(2):191–199. doi: 10.1002/pbc.22935. [DOI] [PMC free article] [PubMed] [Google Scholar]
- 17.Carol H, Morton CL, Gorlick R, et al. Initial testing (stage 1) of the Akt inhibitor GSK690693 by the pediatric preclinical testing program. Pediatric blood & cancer. 2010;55(7):1329–1337. doi: 10.1002/pbc.22710. [DOI] [PMC free article] [PubMed] [Google Scholar]
- 18.Gorlick R, Maris JM, Houghton PJ, et al. Testing of the Akt/PKB inhibitor MK-2206 by the pediatric preclinical testing program. Pediatric blood & cancer. 2011 doi: 10.1002/pbc.23412. [DOI] [PMC free article] [PubMed] [Google Scholar]
- 19.Keshelava N, Frgala T, Krejsa J, et al. DIMSCAN: a microcomputer fluorescence-based cytotoxicity assay for preclinical testing of combination chemotherapy. Methods in molecular medicine. 2005;110:139–153. doi: 10.1385/1-59259-869-2:139. [DOI] [PubMed] [Google Scholar]
- 20.Sebaugh JL. Guidelines for accurate EC50/IC50 estimation. Pharmaceut Statist. 2011;10:128–134. doi: 10.1002/pst.426. [DOI] [PubMed] [Google Scholar]
- 21.Houghton PJ, Morton CL, Tucker C, et al. The pediatric preclinical testing program: Description of models and early testing results. Pediatr Blood Cancer. 2006 doi: 10.1002/pbc.21078. [DOI] [PubMed] [Google Scholar]
- 22.Liem NL, Papa RA, Milross CG, et al. Characterization of childhood acute lymphoblastic leukemia xenograft models for the preclinical evaluation of new therapies. Blood. 2004;103(10):3905–3914. doi: 10.1182/blood-2003-08-2911. [DOI] [PubMed] [Google Scholar]
- 23.Kurmasheva RT, Harwood FC, Houghton PJ. Differential regulation of vascular endothelial growth factor by Akt and mammalian target of rapamycin inhibitors in cell lines derived from childhood solid tumors. Molecular cancer therapeutics. 2007;6(5):1620–1628. doi: 10.1158/1535-7163.MCT-06-0646. [DOI] [PubMed] [Google Scholar]
- 24.Vanhaesebroeck B, Welham MJ, Kotani K, et al. P110delta, a novel phosphoinositide 3-kinase in leukocytes. Proceedings of the National Academy of Sciences of the United States of America. 1997;94(9):4330–4335. doi: 10.1073/pnas.94.9.4330. [DOI] [PMC free article] [PubMed] [Google Scholar]
- 25.Shapiro GI, Edelman G, Calvo E, et al. Targeting aberrant PI3K pathway signaling with XL147, a potent, selective and orally bioavailable PI3K inhibitor; AACR-NCI-EORTC International Conference; 2007. Abstr C205. [Google Scholar]
- 26.Lannutti BJ, Meadows SA, Herman SE, et al. CAL-101, a p110delta selective phosphatidylinositol-3-kinase inhibitor for the treatment of B-cell malignancies, inhibits PI3K signaling and cellular viability. Blood. 2011;117(2):591–594. doi: 10.1182/blood-2010-03-275305. [DOI] [PMC free article] [PubMed] [Google Scholar]
- 27.Coutre SE, Byrd JC, Furman RR, et al. Phase I study of CAL-101, an isoform-selective inhibitor of phosphatidylinositol 3-kinase P110d, in patients with previously treated chronic lymphocytic leukemia. J Clin Oncol. 2011;29(suppl) abstr 6631. [Google Scholar]
- 28.Osaki M, Oshimura M, Ito H. PI3K-Akt pathway: its functions and alterations in human cancer. Apoptosis : an international journal on programmed cell death. 2004;9(6):667–676. doi: 10.1023/B:APPT.0000045801.15585.dd. [DOI] [PubMed] [Google Scholar]
- 29.Petricoin EF, 3rd, Espina V, Araujo RP, et al. Phosphoprotein pathway mapping: Akt/mammalian target of rapamycin activation is negatively associated with childhood rhabdomyosarcoma survival. Cancer research. 2007;67(7):3431–3440. doi: 10.1158/0008-5472.CAN-06-1344. [DOI] [PubMed] [Google Scholar]
- 30.Opel D, Poremba C, Simon T, et al. Activation of Akt predicts poor outcome in neuroblastoma. Cancer research. 2007;67(2):735–745. doi: 10.1158/0008-5472.CAN-06-2201. [DOI] [PubMed] [Google Scholar]
- 31.Boller D, Schramm A, Doepfner KT, et al. Targeting the phosphoinositide 3-kinase isoform p110delta impairs growth and survival in neuroblastoma cells. Clin Cancer Res. 2008;14(4):1172–1181. doi: 10.1158/1078-0432.CCR-07-0737. [DOI] [PubMed] [Google Scholar]
- 32.Segerstrom L, Baryawno N, Sveinbjornsson B, et al. Effects of small molecule inhibitors of PI3K/Akt/mTOR signaling on neuroblastoma growth in vitro and in vivo. International journal of cancer. 2011;129(12):2958–2965. doi: 10.1002/ijc.26268. [DOI] [PubMed] [Google Scholar]
- 33.Guerreiro AS, Fattet S, Fischer B, et al. Targeting the PI3K p110alpha isoform inhibits medulloblastoma proliferation, chemoresistance, and migration. Clin Cancer Res. 2008;14(21):6761–6769. doi: 10.1158/1078-0432.CCR-08-0385. [DOI] [PubMed] [Google Scholar]
- 34.Buonamici S, Williams J, Morrissey M, et al. Interfering with resistance to smoothened antagonists by inhibition of the PI3K pathway in medulloblastoma. Sci Transl Med. 2010;2(51):51ra70. doi: 10.1126/scitranslmed.3001599. [DOI] [PMC free article] [PubMed] [Google Scholar]
- 35.Guerreiro AS, Fattet S, Kulesza DW, et al. A sensitized RNA interference screen identifies a novel role for the PI3K p110gamma isoform in medulloblastoma cell proliferation and chemoresistance. Mol Cancer Res. 2011;9(7):925–935. doi: 10.1158/1541-7786.MCR-10-0200. [DOI] [PubMed] [Google Scholar]
- 36.Morozova O, Birol I, Corbett R, et al. Whole genome and transcriptome sequencing defines the spectrum of somatic changes in high-risk neuroblastoma; Proceedings of the 102nd Annual Meeting of the American Association for Cancer Research; 2011. Abstr 926. [Google Scholar]
- 37.Pugh TJ, Lawrence M, Sougnez C, et al. Exome sequencing of 81 neuroblastomas identifies a wide diversity of somatic mutation; Proceedings of the 102nd Annual Meeting of the American Association for Cancer Research; 2011. Abstr 4756. [Google Scholar]
- 38.Zhang J, Mullighan CG, Harvey RC, et al. Key pathways are frequently mutated in high risk childhood acute lymphoblastic leukemia: a report from the Children's Oncology Group. Blood. 2011 doi: 10.1182/blood-2011-03-341412. [DOI] [PMC free article] [PubMed] [Google Scholar]
- 39.Shukla N, Ameur N, Yilmaz I, et al. Oncogene Mutation Profiling of Pediatric Solid Tumors Reveals Significant Subsets of Embryonal Rhabdomyosarcoma and Neuroblastoma with Mutated Genes in Growth Signaling Pathways. Clin Cancer Res. 2012 doi: 10.1158/1078-0432.CCR-11-2056. [DOI] [PMC free article] [PubMed] [Google Scholar]
- 40.Broderick DK, Di C, Parrett TJ, et al. Mutations of PIK3CA in anaplastic oligodendrogliomas, high-grade astrocytomas, and medulloblastomas. Cancer research. 2004;64(15):5048–5050. doi: 10.1158/0008-5472.CAN-04-1170. [DOI] [PubMed] [Google Scholar]
- 41.Pugh TJ, Cho YJ, Archer T, et al. Medulloblastoma exome sequencing uncovers subtype-specific somatic mutations within a wide spectrum of genetic heterogeneity; Proceedings of the 103rd Annual Meeting of the American Association for Cancer Research; 2012. [Google Scholar]
- 42.Jones DT, Jaeger N, Cho YJ, et al. ICGC PedBrain Tumor - Next-generation sequencing identifies novel subgroup-specific mutations and copy number aberrations in medulloblastoma; Proceedings of the 103rd Annual Meeting of the American Association for Cancer Research; 2012. Abstr #4872. [Google Scholar]
- 43.Bender A, Opel D, Naumann I, et al. PI3K inhibitors prime neuroblastoma cells for chemotherapy by shifting the balance towards pro-apoptotic Bcl-2 proteins and enhanced mitochondrial apoptosis. Oncogene. 2011;30(4):494–503. doi: 10.1038/onc.2010.429. [DOI] [PubMed] [Google Scholar]
Associated Data
This section collects any data citations, data availability statements, or supplementary materials included in this article.