

Abstract
Background
Sphingosine‐1‐phosphate (S1P) is a key biolipid signaling molecule that regulates cell growth and survival, but it has not been studied in tumors from dogs.
Hypothesis/Objectives
S1P/S1P1 signaling will contribute to the progression of hemangiosarcoma (HSA).
Animals
Thirteen spontaneous HSA tissues, 9 HSA cell lines, 8 nonmalignant tissues, including 6 splenic hematomas and 2 livers with vacuolar degeneration, and 1 endothelial cell line derived from a dog with splenic hematoma were used.
Methods
This was a retrospective case series and in vitro study. Samples were obtained as part of medically necessary diagnostic procedures. Microarray, qRT‐PCR, immunohistochemistry, and immunoblotting were performed to examine S1P1 expression. S1P concentrations were measured by high‐performance liquid chromatography/mass spectrometry. S1P signaling was evaluated by intracellular Ca2+ mobilization; proliferation and survival were evaluated using the MTS assay and Annexin V staining.
Results
Canine HSA cells expressed higher levels of S1P1 mRNA than nonmalignant endothelial cells. S1P1 protein was present in HSA tissues and cell lines. HSA cells appeared to produce low levels of S1P, but they selectively consumed S1P from the culture media. Exogenous S1P induced an increase in intracellular calcium as well as increased proliferation and viability of HSA cells. Prolonged treatment with FTY720, an inhibitor of S1P1, decreased S1P1 protein expression and induced apoptosis of HSA cells.
Conclusions and clinical importance
S1P/S1P1 signaling pathway functions to maintain HSA cell viability and proliferation. The data suggest that S1P1 or the S1P pathway in general could be targets for therapeutic intervention for dogs with HSA.
Keywords: Cancer; Dogs, FTY720; Signal Transduction; Vascular Cells
Abbreviations
- HPLC‐MS/MS
high‐performance liquid chromatography/mass spectrometry
- HSA
hemangiosarcoma
- MTS
(3‐(4,5‐dimethylthiazol‐2‐yl)‐5‐(3‐carboxymethoxyphenyl)‐2‐(4‐sulfophenyl)‐2H‐tetrazolium
- S1P1
sphingosine‐1‐phosphate receptor‐1
- SK1
sphingosine kinase 1
- qRT‐PCR
quantitative real time reverse transcriptase polymerase chain reaction
Hemangiosarcoma (HSA) is a lethal disease of dogs that originates from blood vessel‐forming cells.1 It appears to be highly dependent on microenvironmental signals for growth and survival, and previous gene expression data showed that sphingosine‐1‐phosphate receptor‐1 (S1P1) was a recurrent component of multiple pathways whose activity was enriched in malignant HSA cells.2
S1P1 is a member of a family of 5 genes that encode G protein‐coupled receptors that bind to sphingosine 1‐phosphate (S1P).3 S1P1 was discovered as “endothelial differentiation gene‐1” and is mainly responsible for vasculogenesis in the embryo.4 It is now apparent that S1P regulates cell growth and survival more globally, and many cancers exploit this by activating S1P pathways.5 Together, these observations make it likely that deregulated expression/activity of S1P receptors could contribute to vascular neoplasms; the expression of S1P1 has been documented in human vascular tumors,6 but to our knowledge, it has not been previously examined in any canine tumors. Specifically, the potential function of S1P1 to maintain and propagate canine HSA or other vascular tumors has not been reported.
FTY720 is an FDA‐approved compound that has been used to antagonize S1P signaling. It is chemically similar to sphingosine, and the phosphorylated form of FTY720 binds to S1P1 and S1P3‐5.7 FTY720 has agonist activity and activates S1P1, but chronic exposure to this drug has been reported to cause internalization and degradation of S1P1 preventing it from recycling back to the membrane.8 Here, we examined patterns of S1P1 expression in HSA and the role of S1P1 to maintain viability and promote proliferation of the tumor cells in culture.
Materials and Methods
Pathologicl Samples
Twenty‐one formalin‐fixed and paraffin‐embedded tissue samples were examined, including 13 HSAs (8 spleen; 2 heart; 2 liver; 1 uterine horn) and 8 nonmalignant samples (6 splenic hematomas and 2 livers with vacuolar degeneration). Samples were obtained as part of medically necessary diagnostic procedures and they were used for research with owner consent. Procedures involving animal use were done with approval of the University of Minnesota Animal Care and Use Committee (protocols 0802A27363/1101A94713/1312‐31131A and 1110A06186).
Cell Lines and Reagents
Canine cell lines were grown as adherent cultures at 37°C in 5% CO2 atmosphere as described.9 Canine HSA cell lines included COSB, Dal‐4, DD1, SPAR, Emma, Frog, JHE, JLI, and JLU; DH is a nonmalignant hematoma cell line. FTY720, W146, and S1P were purchased from Cayman Chemical Company.1 Reagent concentrations were adjusted according to the number of cells and the volume of media for each assay.
Microarray and Quantitative Real Time Reverse Transcriptase Polymerase Chain Reaction (qRT‐PCR)
Microarray data from canine HSA cell lines is deposited in the Gene Expression Omnibus (http://www.ncbi.nlm.nih.gov/geo; accession number GSE22129).2 qRT‐PCR was performed as described.2 Briefly, total RNA was prepared with the Ambion RNA Mini Kit,2 and cDNA was prepared using the Superscript cDNA Synthesis Kit.b qRT‐PCR was done using the SYBRgreen method.2 Gene expression for S1P1 and sphingosine kinase 1 (SK1) was determined as a ratio of GAPDH expression using the 2−ΔΔCT method.10 The primer sequences are listed in Supplementary Table 1.
Table 1.
Immunoreactivity of S1P1 and CD31 in 13 cases of canine hemangiosarcoma
| Dog No. | Site of Tumor | Immunoreactivity | |
|---|---|---|---|
| S1P1 | CD31 | ||
| 1 | Spleen | 2+ | 1+ |
| 2 | Spleen | 2+ | 1+ |
| 3 | Spleen | 1+ | 3+ |
| 4 | Heart | 0 | 3+ |
| 5 | Spleen | 0 | 3+ |
| 6 | Spleen | 1+ | 3+ |
| 7 | Liver | 1+ | 3+ |
| 8 | Liver | 2+ | 3+ |
| 9 | Spleen | 3+ | 1+ |
| 10 | Spleen | 1+ | 2+ |
| 11 | Heart | 1+ | 1+ |
| 12 | Spleen | 2+ | 1+ |
| 13 | Uterine Horn | 2+ | 2+ |
Immunoblotting
Whole cell lysates were prepared using RIPA buffer (300 mM NaCl, 50 mM Tris pH 7.6, 0.5% Trition X‐100) with fresh protease inhibitors added (100×) as described.11 Briefly, cells were incubated in lysis buffer for 10 minute on ice and centrifuged 2,000 g at 4°C. Bradford assays were performed in order to quantify protein amount in the supernatants. Thirty micrograms of total protein were loaded into each well, proteins were subjected to SDS‐PAGE and transferred to nitrocellulose using the BioRad Trans‐Blot SD semidry transfer cell.3 Membranes were blocked in 50% Pierce Starting Blocking Buffer (diluted in 1× TTBS) for 30 minute, incubated with the primary antibody overnight at 4°C, washed 4× in TTBS, and incubated with the secondary antibody for 1 hour. The beta‐actin antibody4 and the S1P1 antibody5 were used for immunoblotting. Membranes were washed 4× in TBS and visualized using LicorOdyssey imaging system.6 The human Ly3 B cell lymphoma cell line (UHN/Ontario Cancer Institute) was used to confirm the performance of the antiS1P1 antibody.
Immunohistochemistry and Scoring
Immunohistochemistry was performed on 4‐μm sections of formalin‐fixed, paraffin‐embedded samples using routine protocols (IHC Services7 ).2, 12 Rabbit IgG antibody was used as negative control. Immunostaining of S1P1 e and CD31,8 was evaluated semiquantitatively according to the percentage of positive cells at high power magnification (400×) using a scoring system of 0 to 3+,6 where 0 reflects specific staining in <1% of the cells, 1+ reflects specific staining in 1–30% of the cells, 2+ reflects specific staining in 31–70% of the cells, and 3+ reflects specific staining in 71–100% of the cells.
Lipid Analyses by HPLC‐MS/MS
HSA cells were cultured with and without growth factors for 24 hours. At various time points, supernatant samples were collected and analyzed for the presence of S1P. Levels of lipids S1P were measured by the high‐performance liquid chromatography/mass spectrometry (HPLC‐MS/MS) methodology as previously described.13 Analytical results of S1P were expressed as molar concentrations (pmol/mL) in culture supernatants.
Intracellular Ca2+ Mobilization Assay
To investigate whether S1P and FTY720 activated the S1P1 receptor, cytosolic free Ca2+ mobilization assay was performed as described.9 HSA cells (5 × 10⁶–1 × 10⁷ cells/mL) were loaded with Indo‐1 AM calcium dye9 (4 μM) by incubating for 30 minute at 37°C. After washing the cells twice, cells were stimulated by S1P or FTY720 at 37°C and Indo‐1 AM fluorescence was measured to determine intracellular calcium flux in real time with a BD LSRII Flow Cytometer.10 Ionomycina (1 μM) was used as positive control.
Cell Proliferation Assay
The MTS (3‐(4,5‐dimethylthiazol‐2‐yl)‐5‐(3‐carboxymethoxyphenyl)‐2‐(4‐sulfophenyl)‐2H‐tetrazolium) assay11 was used to measure the effect of S1P and FTY720 on cell proliferation. Microtiter plates were seeded with 5 × 10²–5 × 10³ HSA cells depending on the cell line. Cells were treated as described in Results and incubated at 37°C for 1–4 days. MTS reagent was added to the wells, plates were incubated at 37°C for 2 hours, and absorbance was measured at 490 nm using a Wallac 1420 VICTOR2 plate reader.12 Experiments were repeated at least 3 times, and data points on the graphs represent the mean and S.E.M. of 3 replicates.
Apoptosis (Annexin V staining) and Cell Survival Assay
Proapoptotic effects of FTY720 were measured using the Annexin V staining assay kit.i HSA cells (5 × 10⁵) were incubated with or without 10 or 20 μM FTY720 and incubated at 37°C for 24 hours. Cells were harvested, washed, and resuspended in binding buffer (10 mM HEPES, 150 mM NaCl, 1.8 mM CaCl2, pH 7.4) containing 5 μg/mL Annexin V‐APC and 5 μg/mL 7‐AAD.i They were incubated at room temperature for 10 min, washed and resuspended in binding buffer, and analyzed by flow cytometry within 4 hours using the BD LSRII Flow Cytometer.j
Statistical Analysis
Differences in mRNA expression between nonmalignant endothelial cells (group‐1) and HSA cells (group‐2) were examined using the Mann–Whitney test. Differences in S1P1 and CD31 immunohistochemical scores between samples were examined using the Spearman correlation test. Differences in the proliferation rate between S1P‐treated and untreated conditions were examined using unpaired Student's t‐test. P < 0.05 was considered statistically significant.
Results
Canine HSA Cells Express Higher Level of S1P1 mRNA than Nonmalignant Canine Endothelial Cells
Previous microarray data comparing genome‐wide gene expression from canine HSA cell lines and nonmalignant endothelial cells indicated that S1P1 was highly expressed in HSA cell lines as compared to nonmalignant endothelial cells (Fig 1A; P = 0.021). In contrast, the gene encoding the SK1 enzyme responsible for S1P synthesis was expressed at similar levels in both malignant HSA cells and nonmalignant endothelial cells (data not shown).2 We validated S1P1 and SK1 expression using qRT‐PCR in an independent panel of 5 HSA cell lines. To assess if S1P1 expression was associated with colonization of a particular microenvironment, we included 3 independent cell lines derived from metastatic tumors of the same dog (JLU, JLI, JHE) in these experiments. Figure 1B shows that each of the HSA cell lines had at least twice the levels of S1P1 mRNA than the nonmalignant endothelial cell line (DH) control. While 3 of the cell lines in these experiments had mRNA levels that were 90–200 times higher than DH cells, the heterogeneity observed in the 3 lines derived from the same dog was noteworthy, with cells derived from its atrial tumor (JHE) showing lower levels of S1P1 mRNA than those derived from lung (JLU) and liver (JLI) tumors. No difference was observed in SK1 expression compared to the control (Fig 1C). Finally, we verified that expression of S1P1 protein in representative cell lines from the microarray experiment (Frog and DD1), from the qRT‐PCR experiment (JLU), and another independently derived cell line (SPAR) using Western blotting (Fig 1C). Interestingly, the results showed minimal variation in total S1P1 protein among these cell lines.
Figure 1.
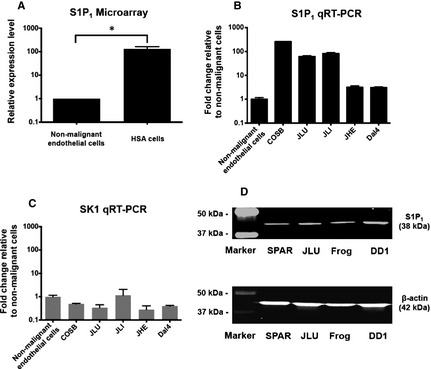
Expression of S1P1 in canine HSA and nonmalignant endothelial cells. (A) Bar graph shows relative expression levels of S1P1 in canine nonmalignant endothelial cells (n = 3) and HSA cell lines (n = 10) from microarray data (Mann–Whitney test; P = 0.021).2 Mean (±SEM) levels of S1P1 (B) and SK1 (C) mRNA expression in representative HSA cell lines and nonmalignant canine endothelial cells (DH). The expression levels were quantified by qRT‐PCR, and normalized to GAPDH using the ΔCt method. (D) Immunoblot shows expression of S1P1 protein in canine HSA cell lines, SPAR, JLU, Frog, and DD1. The loading control was β‐actin. *P < 0.05
S1P1 Protein Expression is Inversely Correlated with CD31 Expression in Spontaneous Canine HSA
We confirmed the expression of this receptor in a set of 13 archival, formalin‐fixed HSA samples (from spleen, heart, liver, uterus), and nonmalignant samples including 6 splenic hematomas, and 2 liver samples with vacuolar degeneration (as controls for hepatic HSA). During our development of the S1P1 IHC methodology, we confirmed the predicted, strong staining in normal cardiomyocytes,14 so we did not include additional nonmalignant heart samples as controls. S1P1 was expressed in the tumor cells from 11 (84.6%) HSA cases; in the nonmalignant samples, S1P1 was detectable in inflammatory cells and in endothelial cells in 7 (87.5%) and in 4 (50%) nonmalignant samples, respectively. The endothelial cell marker, CD31, was expressed robustly by endothelial cells in all of the nonmalignant samples. In contrast, immunostaining of S1P1 and CD31 was heterogeneous in the HSA cases (Fig 2; Table 1), with expression of these 2 proteins showing an inverse relationship (Spearman correlation = −0.644; P = 0.007).
Figure 2.
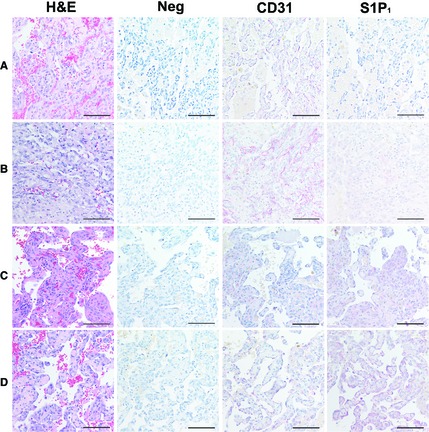
Immunohistochemical expression of S1P1 and CD31 in spontaneous canine HSA. Representative HSA samples assigned immunostaining scores of 0 to 3+. For each sample, the left panel shows H&E staining, the remaining panels show immunohistochemistry (negative control, CD31, and S1P1) done in serial sections. (A) S1P1 = 0; CD31 = 3+. (B) S1P1 = 1+; CD31 = 3+. (C) S1P1 = 2+; CD31 = 1+. (D) S1P1 = 3+; CD31 = 1+. Staining with rabbit IgG antibody was used as negative control. All photomicrographs were taken at 400× magnification. Alkaline phosphatase; counter stain = hematoxylin. Bar = 47 μm.
Canine HSA Cells Consume S1P Under Conditions that Promote Growth and Proliferation
To assess if S1P‐S1P1 pathways were activated as a result of an autocrine loop, we measured steady‐state levels of S1P in culture supernatants collected periodically over 24 hour. Such steady‐state levels would reflect production and consumption. Furthermore, we used serum‐replete and serum‐free conditions to account for the confounder of S1P present in serum. COSB cells were grown in media supplemented with serum or in serum‐free media, and S1P was quantified using HPLC‐MS/MS (Fig 3). In serum‐replete cultures, S1P was reduced by ~75% over the first 9 hour and was undetectable after 24 hour. The levels of S1P in serum‐free cultures were >95% lower than what was seen in serum‐replete cultures, and that small amount was fully depleted within the first 6 hour. In contrast, C22‐ceramide levels were almost 2‐fold higher than S1P in a molar ratio in both serum‐replete and serum‐deprived cultures, but they remained stable over 24 hour. Together, these data suggest that HSA cells produce no or little S1P (most of the S1P in cultures comes from serum), but they readily and selectively consume S1P under conditions that promote growth and proliferation.
Figure 3.
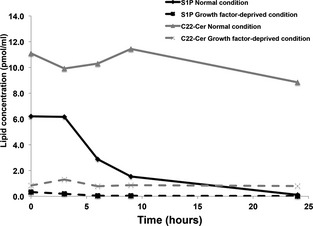
S1P biolipid concentration in canine HSA cells. S1P concentration in supernatant of representative canine HSA cells (COSB) was measured by the HPLC‐MS/MS. Line graph shows changes of lipid metabolite concentration (pmol/mL) over time in supernatant of HSA cells between normal culture medium (solid line) and growth factor‐deprived medium (dashed line). C22‐Ceramide is the control lipid.
S1P Induces an Increase in Intracellular Calcium Concentration in Canine HSA cells
The S1P1 protein is a G protein‐coupled receptor, and binding of S1P to its receptor stimulates an increase in the intracellular Ca2+ concentration.3 To verify that S1P activates S1P1 in canine HSA cells, we tested the effect of S1P on intracellular calcium mobilization in 3 distinct cell lines. First, we measured the calcium response in COSB cells (Fig 4A). S1P (10 μg/mL) induced a rapid rise in intracellular calcium that reached levels equal to or >60% of the maximal response seen with ionomycin. This was followed by a slow decline and return to baseline within ~3 min. FTY720 (10 μM) induced a significantly smaller and shorter response, which is consistent with its function as an S1P1 partial agonist, whereas the pure antagonist W146 did not induce a measurable calcium response. Next, we assessed whether there was a dose relationship between S1P concentration and the magnitude of the calcium response (Fig 4B). Calcium transients in SPAR cells were slightly different than those in COSB cells, with S1P inducing a larger peak response with prolonged, sustained high levels of calcium, and a rapid decline to baseline within ~2 min. The pattern of the response was conserved, albeit reduced when the dose of S1P was reduced from 1 to 0.1 μg/mL, and a response was no longer apparent at 0.01 μg/mL. Finally, the response was quantitatively and qualitatively different in DD1 cells (Fig 4C). In these cells, S1P induced a blunted immediate response followed by a progressive increase in intracellular calcium concentrations that was sustained by >5 minute. The calcium response in DD1 cells also required relatively high concentrations of S1P (10 μg/mL), with this response being dramatically reduced when the dose was lowered to 1 μg/mL. Our results demonstrate that S1P and FTY720 activate S1P1, and confirm a biologically relevant consequence of S1P binding to canine HSA cells.
Figure 4.
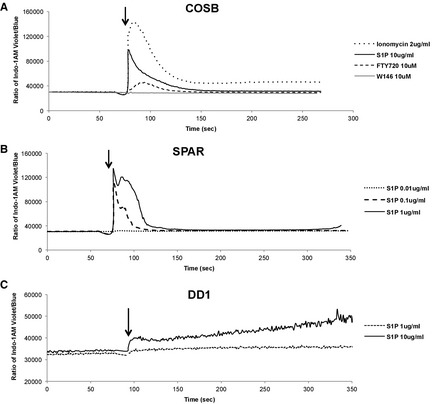
Intracellular calcium transients induced by S1P in canine HSA cells. Cells were loaded with Indo‐1 AM calcium sensor dye, and the levels of intracellular Ca2+ were measured in real time using flow cytometry. (A) HSA cells (COSB) were used to examine effect of S1P or FTY720 on Ca2+ mobilization. Ionomycin was a positive control and W146, a pure antagonist of S1P1, was used as a negative control. Different concentrations of S1P (0.01–1 μg/mL or 10 μg/mL) were used to analyze the magnitude of Ca2+ mobilization by stimulation in SPAR (B) and DD1 cells (C). Arrows indicate addition of stimuli.
S1P Increases Proliferation of Canine HSA cells
S1P regulates growth of normal cells, and it can promote tumorigenesis in human cell lines and mouse models.15 To understand how the S1P/S1P1 signaling pathway contributes to canine HSA, we tested the effects of S1P on cell proliferation in 4 HSA cell lines. The cells were grown in conventional culture conditions in the presence or absence of S1P (0.5 ng/mL). S1P treatment significantly increased cell proliferation in 3 of the 4 cell lines at 72 hours (Table 2). A modest increase in proliferation also was observed when cells were grown under conditions of serum‐deprivation (Fig S1). When cells were grown in serum‐replete media, increasing the dose of S1P to 500 ng/mL did not further enhance growth of these cells (data not shown). These results indicate that S1P can increase proliferation of HSA cell lines.
Table 2.
Fold change in proliferation with S1P treatment during log growth
| Canine Hemangiosarcoma Cell Lines | ||||
|---|---|---|---|---|
| COSB | SPAR | DD1 | Emma | |
| Fold change (Mean ± SEMa) | 1.43 ± 0.13 | 1.20 ± 0.07 | 1.37 ± 0.13 | 1.09 ± 0.056 |
| P value | 0.010 | 0.012 | 0.013 | 0.197 |
SEM, Standard error of the mean; unpaired T‐test.
Prolonged Exposure to FTY720 Decreases S1P1 Expression and Function in Canine HSA cells
FTY720 has a chemical structure similar to sphingosine, and its phosphorylated form is reported to act as both an agonist and a functional antagonist of the S1P1. 16, 17, 18 Our experimental data on acute exposure of HSA cells to FTY720 supported its agonistic activity (Fig 4A). To determine if the compound also had an antagonist role, we first examined how a short (3 minute) pretreatment with FTY720 would affect S1P‐dependent calcium mobilization in HSA cells. Figure 5A shows calcium mobilization by SPAR cells in response to S1P (1 μg/mL). As also shown in Fig 3, the addition of FTY720 to untreated HSA cells induced calcium mobilization, and it appeared to sensitize cells to acute S1P signaling: the magnitude of the observed calcium flux was higher when S1P was added within 3 minutes of FTY720 treatment (compare Fig 5A,B). In contrast, this sensitization was not seen when HSA cells were treated with FTY720 for 6 hours; instead the response to S1P was completely abrogated (Fig 5C). To confirm this effect was because of S1P1 degradation by FTY720,18 we used immunoblotting to quantify the levels of the receptor under the same conditions. Our results show that the steady state levels of S1P1 remain relatively stable in HSA cells for at least 2 hours after FTY720 treatment; however, expression of this receptor is virtually eliminated after 4 hours of FTY720 treatment (Fig 5D). Together, our data indicate that prolonged exposure to FTY720 interferes with S1P/S1P1 signaling by down‐regulating the expression of the receptors in canine HSA cells.
Figure 5.
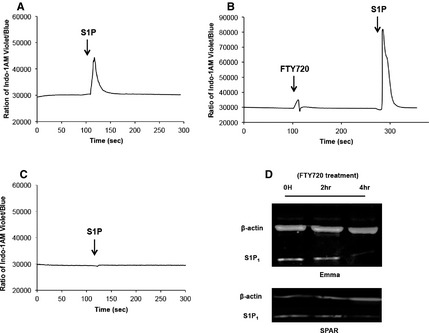
Effect of FTY720 on Ca2+ signaling and S1P1 expression in canine HSA cells. (A) SPAR cells stained with Indo‐1 AM were stimulated by S1P (1 μg/mL). (B) SPAR cells were stimulated by 20 μM of FTY720 (first peak) and then treated with 1 μg/mL of S1P within 3 minutes (second peak). (C) The cells were pretreated with 20 μM of FTY720 in culture for 6 hours and S1P‐induced (1 μg/mL) Ca2+ mobilization was measured in real time. (D) Representative immunoblots showing S1P1 protein after addition of FTY720. HSA cells (Emma and SPAR) were treated with 10 or 20 μM of FTY720 and cell lysates were prepared at 0, 2, and 4 hour, respectively.
FTY720 Induces Apoptosis of Canine HSA Cells
We used the effect of FTY720 to down‐regulate S1P1 expression and examine the requirement of S1P1 for HSA cell growth and survival. Figure 6A shows that FTY720 reduced HSA cell viability with a half‐maximal effective concentration (EC50) of 5–6 μM. We next examined if FTY720 led to loss of membrane asymmetry with exposure of phosphatidylserine to determine if this effect of was caused by the induction of apoptosis. Figure 6B illustrates the effect of FTY720 on Annexin V staining of COSB and SPAR cells after 24 hour. These data suggest that S1P1 signaling is necessary to maintain HSA cell viability and proliferation.
Figure 6.
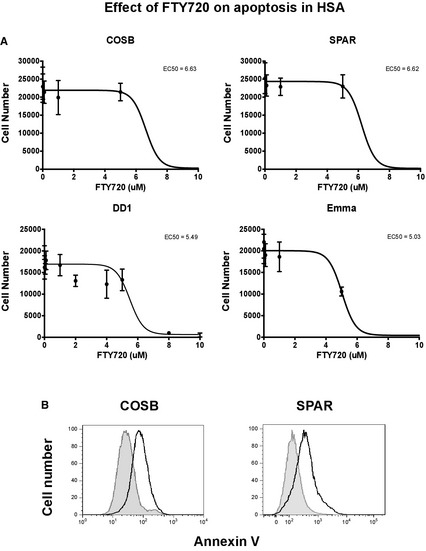
Effect of S1P1 inhibition on HSA cell survival and apoptosis. (A) 5 × 10³ HSA cells (COSB, SPAR, DD1 and Emma) were plated in triplicate in a 96‐well plate, and were treated with a range of concentrations of FTY720. Cell viability was measured after treatment for 72 hours. (B) 5 × 10⁵ cells were treated with FTY720 of 10 μM (COSB) or 20 μM (SPAR) for 24 hours and stained with Annexin V. Staining with Annexin V was measured by flow cytometry. Shaded peak represents untreated cells.
Discussion
Previous genome‐wide expression analysis showed recurrent enrichment of the S1P1 gene in various biologic pathways that differentiated canine HSA cells from nonmalignant canine endothelial cells.2 Here, we examined the magnitude and patterns of S1P1 expression in HSA tissues, as well as the capacity of S1P to promote proliferation and survival of HSA cells. Elevated expression of S1P receptors and of the SK1 enzyme has been reported for several human cancers including glioma,19 glioblastoma,20 ovarian,21 and breast cancer.22 Our results show that HSA cells express higher levels of S1P1 mRNA than nonmalignant endothelial cells, suggesting that these malignant cells would have greater sensitivity to S1P signals. The steady‐state levels of S1P1 mRNA varied among HSA cell lines, but the differences were not apparent when we examined the steady state levels of S1P1 protein. This result was not entirely surprising, as S1P1 is regulated posttranscriptionally through recycling and reinsertion into the plasma membrane as part of the homeostatic response to S1P.23 Intriguingly, there was an inverse relationship between S1P1 and CD31 expression in canine HSA, suggesting that the extent of endothelial differentiation might regulate S1P1 protein expression, making detection of S1P1 a potentially valuable adjunctive immunohistochemical marker for this disease. Conversely, there were no differences in SK1 gene expression between canine HSA cells and nonmalignant endothelial cells, and canine HSA cells consumed significantly more S1P than they produced. This suggests that activation of the S1P/S1P1 pathway is modulated by extracellular S1P.
S1P is secreted by platelets to maintain vascular stability and homeostasis, and promote coagulation. The blood plasma contains a high concentration of S1P compared to the surrounding tissues, and the gradient between the 2 compartments controls cellular trafficking and migration of various types of cells.24 In addition to maintaining normal vasculature, extracellular S1P can regulate migration of tumor cells. A recent study found that systemic S1P, rather than tumor‐derived S1P, was important in lung colonization and metastasis.25 We found that HSA cells do not produce large amounts of S1P; therefore, they likely obtain it from their microenvironment. HSA tissue forms a vascular, inflammatory niche that includes blood vessel‐forming cells, leukocytes, and platelets.2 It is likely that HSA cells would have access to extracellular S1P, which may promote disease progression by regulating cell survival, migration and metastasis.
S1P1 is a G protein‐coupled receptor, which activates the Gi/o protein upon binding to S1P. The activation of the Gi/o protein stimulates an increase in calcium mobilization, which in turn leads to increased cell growth and survival.26 We confirmed that exogenous S1P induces an increase in intracellular calcium in HSA cells. There was moderate heterogeneity in the calcium responses seen among different HSA cell lines, which could be caused by modest variations in S1P1 expression or in S1P1‐associated elements that promote intracellular calcium release. A functional consequence of S1P signaling is to activate a wide range of physiologic processes. S1P1 activates several downstream kinase cascades involving the rat sarcoma (Ras) family of small GTPases and extracellular signal‐regulated kinase (ERK) to increase cell proliferation,27 and the phosphatidylinositide 3‐kinase (PI3K)/protein kinase B (Akt) pathway to promote cell survival.28 We found that exogenous S1P induced a statistically significant increase in HSA cell proliferation, and both the Ras‐ERK29 and the PI3K/Akt pathways12 have been shown to contribute to HSA cell growth and viability. Interestingly, the S1P1 receptor has been reported to synergize with other growth factor receptors to amplify downstream signaling.5 S1P1 forms a complex with platelet‐derived growth factor receptor beta (PDGFRβ), and this interaction improves the efficiency of the PDGFRβ signaling to activate p42/p44 mitogen‐activated protein kinase (MAPK), which results in additional cell growth and survival.30 Canine HSA cells overexpress the PDGFRβ gene,2 and a recent study showed that these cells grow and survive through PDGFRβ signaling.31 Overexpression of S1P1 receptors might similarly form complexes with PDGFRβ in canine HSA to exploit additional signaling pathways.
FTY720 is chemically similar to sphingosine and it modulates the S1P signaling pathway.16 The phosphorylated form of FTY720 binds to 4 of the 5 S1P receptors (S1P1 and S1P3‐5).17 FTY720 activates S1P1, but over time, the drug causes internalization and degradation of S1P1 preventing it from recycling back to the membrane in mammalian cells; therefore, chronic exposure to FTY720 inhibits cellular responses stimulated by S1P.18 FTY720 is an FDA‐approved drug for multiple sclerosis, as it blocks cytotoxic T cells from moving out of the lymphoid tissue into the brain.32 FTY720 has also been shown successful in preclinical antitumor studies in many types of human cancers.8 Here, we show that acute exposure to FTY720 induced intracellular calcium mobilization in HSA cells, consistent with its partial agonist effect, but prolonged exposure to FTY720 led to S1P1 degradation and abrogated the calcium response to S1P and caused HSA cell death. FTY720 is known to induce apoptosis in eukaryotic cells by several S1P1‐independent mechanisms, such as increasing protein phosphatase 2A,33, 34 caspases,35 and mitochondrial damage.36 While blockade of S1P signaling by FTY720 could be sufficient to cause apoptosis of HSA cells, we cannot exclude the possibility that other effects independent of S1P inhibition might have contributed to HSA cell death. Nevertheless, the known tolerability of FTY720 and its profound effect to induce HSA cell death suggest that this class of compounds might be useful adjuncts for HSA treatment.
In summary, the data from this study indicate that canine HSA cells exploit the S1P pathway for proliferation and survival, that this is due in part to up‐regulation of S1P1 expression, and that inhibition of the S1P‐S1P1 axis represents a potential new therapeutic target for HSA. Increased signaling through S1P1 also might enhance other relevant functions associated with HSA progression and metastasis. Additional studies will be needed to fully understand the mechanisms leading to enhanced S1P1 gene expression in HSA cells.
Supporting information
Fig S1. Effect of S1P on cell proliferation in serum‐deprived medium.
Table S1. Primer sequences for qRT‐PCR.
Acknowledgments
This study was supported in part by grants from the AKC Canine Health Foundation (1759 and 2081‐A). The NIH Comprehensive Cancer Center Support Grant to the Masonic Cancer Center, University of Minnesota (P30 CA077598) provided support for bioinformatics and for flow cytometry and imaging services. This research was also supported in part by the Lipidomics Shared Resource, Hollings Cancer Center, Medical University of South Carolina (P30 CA138313) and the Lipidomics Core in the SC Lipidomics and Pathobiology COBRE, Department Biochemistry, MUSC (P20 RR017677). The authors also gratefully acknowledge donations to the Animal Cancer Care and Research Program of the University of Minnesota that helped support this project. We thank the Minnesota Supercomputing Institute for computational resources and Dr. John Wojcienzyn (IHC Services) for assistance developing S1P1 immunohistochemistry. The authors also thank KeumSoon Im, Patrice Witschen, Doug Cobb, and Erin Dickerson for review of the manuscript and helpful suggestions.
Conflict of Interest Declaration: Authors disclose no conflict of interest.
Off‐label Antimicrobial Declaration: Authors declare no off‐label use of antimicrobials.
Footnotes
Cayman Chemical Company, Ann Arbor, MI
Life Technologies, Gaithersburg, MD
Bio‐Rad Laboratories, Hercules, CA
Sigma‐Aldrich, St Louis, MO
Thermo Fisher Scientific, Inc., IL
Li‐CorBiosciences, Lincoln, NE
IHC Services, Smithville, TX
Thermo Scientific Lab Vision, Fremont, CA
eBioscience, San Diego, CA
BD Biosciences, San Jose, CA
Promega, Madison, WI
PerkinElmer, Waltham, MA
References
- 1. Clifford CA, Mackin AJ, Henry CJ. Treatment of canine hemangiosarcoma: 2000 and beyond. J Vet Intern Med 2000;14:479–485. [DOI] [PubMed] [Google Scholar]
- 2. Tamburini BA, Phang TL, Fosmire SP, et al. Gene expression profiling identifies inflammation and angiogenesis as distinguishing features of canine hemangiosarcoma. BMC Cancer 2010;10:619. [DOI] [PMC free article] [PubMed] [Google Scholar]
- 3. Pyne S, Pyne NJ. Sphingosine 1‐phosphate signalling in mammalian cells. Biochem J 2000;349:385–402. [DOI] [PMC free article] [PubMed] [Google Scholar]
- 4. Liu Y, Wada R, Yamashita T, et al. Edg‐1, the G protein‐coupled receptor for sphingosine‐1‐phosphate, is essential for vascular maturation. J Clin Invest 2000;106:951–961. [DOI] [PMC free article] [PubMed] [Google Scholar]
- 5. Pyne NJ, Pyne S. Sphingosine 1‐phosphate and cancer. Nat Rev Cancer 2010;10:489–503. [DOI] [PubMed] [Google Scholar]
- 6. Akiyama T, Hamazaki S, Monobe Y, et al. Sphingosine‐1‐phosphate receptor 1 is a useful adjunct for distinguishing vascular neoplasms from morphological mimics. Virchows Arch 2009;454:217–222. [DOI] [PubMed] [Google Scholar]
- 7. Pitman MR, Woodcock JM, Lopez AF, et al. Molecular targets of FTY720 (fingolimod). Curr Mol Med 2012;12:1207–1219. [DOI] [PubMed] [Google Scholar]
- 8. Zhang L, Wang HD, Ji XJ, et al. FTY720 for cancer therapy (Review). Oncol Rep 2013;30:2571–2578. [DOI] [PubMed] [Google Scholar]
- 9. Kim JH, Frantz AM, Anderson KL, et al. Interleukin‐8 promotes canine hemangiosarcoma growth by regulating the tumor microenvironment. Exp Cell Res 2014;323:155–164. [DOI] [PMC free article] [PubMed] [Google Scholar]
- 10. Livak KJ, Schmittgen TD. Analysis of relative gene expression data using real‐time quantitative PCR and the 2(‐Delta Delta C(T)) Method. Methods 2001;25:402–408. [DOI] [PubMed] [Google Scholar]
- 11. Fosmire SP, Dickerson EB, Scott AM, et al. Canine malignant hemangiosarcoma as a model of primitive angiogenic endothelium. Lab Invest 2004;84:562–572. [DOI] [PubMed] [Google Scholar]
- 12. Dickerson EB, Thomas R, Fosmire SP, et al. Mutations of phosphatase and tensin homolog deleted from chromosome 10 in canine hemangiosarcoma. Vet Pathol 2005;42:618–632. [DOI] [PubMed] [Google Scholar]
- 13. Bielawski J, Pierce JS, Snider J, et al. Sphingolipid analysis by high performance liquid chromatography‐tandem mass spectrometry (HPLC‐MS/MS). Adv Exp Med Biol 2010;688:46–59. [DOI] [PubMed] [Google Scholar]
- 14. Mazurais D, Robert P, Gout B, et al. Cell type‐specific localization of human cardiac S1P receptors. J Histochem Cytochem 2002;50:661–670. [DOI] [PubMed] [Google Scholar]
- 15. Xia P, Gamble JR, Wang L, et al. An oncogenic role of sphingosine kinase. Curr Biol 2000;10:1527–1530. [DOI] [PubMed] [Google Scholar]
- 16. Sanchez T, Estrada‐Hernandez T, Paik JH, et al. Phosphorylation and action of the immunomodulator FTY720 inhibits vascular endothelial cell growth factor‐induced vascular permeability. J Biol Chem 2003;278:47281–47290. [DOI] [PubMed] [Google Scholar]
- 17. Brinkmann V, Davis MD, Heise CE, et al. The immune modulator FTY720 targets sphingosine 1‐phosphate receptors. J Biol Chem 2002;277:21453–21457. [DOI] [PubMed] [Google Scholar]
- 18. Graler MH, Goetzl EJ. The immunosuppressant FTY720 down‐regulates sphingosine 1‐phosphate G‐protein‐coupled receptors. FASEB J 2004;18:551–553. [DOI] [PubMed] [Google Scholar]
- 19. Yoshida Y, Nakada M, Sugimoto N, et al. Sphingosine‐1‐phosphate receptor type 1 regulates glioma cell proliferation and correlates with patient survival. Int J Cancer 2010;126:2341–2352. [DOI] [PubMed] [Google Scholar]
- 20. Yoshida Y, Nakada M, Harada T, et al. The expression level of sphingosine‐1‐phosphate receptor type 1 is related to MIB‐1 labeling index and predicts survival of glioblastoma patients. J Neurooncol 2010;98:41–47. [DOI] [PubMed] [Google Scholar]
- 21. Hibbs K, Skubitz KM, Pambuccian SE, et al. Differential gene expression in ovarian carcinoma: Identification of potential biomarkers. Am J Pathol 2004;165:397–414. [DOI] [PMC free article] [PubMed] [Google Scholar]
- 22. Ruckhaberle E, Rody A, Engels K, et al. Microarray analysis of altered sphingolipid metabolism reveals prognostic significance of sphingosine kinase 1 in breast cancer. Breast Cancer Res Treat 2008;112:41–52. [DOI] [PubMed] [Google Scholar]
- 23. Rosen H, Goetzl EJ. Sphingosine 1‐phosphate and its receptors: An autocrine and paracrine network. Nat Rev Immunol 2005;5:560–570. [DOI] [PubMed] [Google Scholar]
- 24. Rauch BH. Sphingosine 1‐phosphate as a link between blood coagulation and inflammation. Cell Physiol Biochem 2014;34:185–196. [DOI] [PubMed] [Google Scholar]
- 25. Ponnusamy S, Selvam SP, Mehrotra S, et al. Communication between host organism and cancer cells is transduced by systemic sphingosine kinase 1/sphingosine 1‐phosphate signalling to regulate tumour metastasis. EMBO Mol Med 2012;4:761–775. [DOI] [PMC free article] [PubMed] [Google Scholar]
- 26. Lee MJ, Van Brocklyn JR, Thangada S, et al. Sphingosine‐1‐phosphate as a ligand for the G protein‐coupled receptor EDG‐1. Science 1998;279:1552–1555. [DOI] [PubMed] [Google Scholar]
- 27. Usui S, Sugimoto N, Takuwa N, et al. Blood lipid mediator sphingosine 1‐phosphate potently stimulates platelet‐derived growth factor‐A and ‐B chain expression through S1P1‐Gi‐Ras‐MAPK‐dependent induction of Kruppel‐like factor 5. J Biol Chem 2004;279:12300–12311. [DOI] [PubMed] [Google Scholar]
- 28. Igarashi J, Michel T. Sphingosine 1‐phosphate and isoform‐specific activation of phosphoinositide 3‐kinase beta. Evidence for divergence and convergence of receptor‐regulated endothelial nitric‐oxide synthase signaling pathways. J Biol Chem 2001;276:36281–36288. [DOI] [PubMed] [Google Scholar]
- 29. Andersen NJ, Nickoloff BJ, Dykema KJ, et al. Pharmacologic inhibition of MEK signaling prevents growth of canine hemangiosarcoma. Mol Cancer Ther 2013;12:1701–1714. [DOI] [PMC free article] [PubMed] [Google Scholar]
- 30. Alderton F, Rakhit S, Kong KC, et al. Tethering of the platelet‐derived growth factor beta receptor to G‐protein‐coupled receptors. A novel platform for integrative signaling by these receptor classes in mammalian cells. J Biol Chem 2001;276:28578–28585. [DOI] [PubMed] [Google Scholar]
- 31. Dickerson EB, Marley K, Edris W, et al. Imatinib and dasatinib inhibit hemangiosarcoma and implicate PDGFR‐beta and Src in tumor growth. Transl Oncol 2013;6:158–168. [DOI] [PMC free article] [PubMed] [Google Scholar]
- 32. Hannun YA, Obeid LM. Principles of bioactive lipid signalling: Lessons from sphingolipids. Nat Rev Mol Cell Biol 2008;9:139–150. [DOI] [PubMed] [Google Scholar]
- 33. Neviani P, Santhanam R, Oaks JJ, et al. FTY720, a new alternative for treating blast crisis chronic myelogenous leukemia and Philadelphia chromosome‐positive acute lymphocytic leukemia. J Clin Invest 2007;117:2408–2421. [DOI] [PMC free article] [PubMed] [Google Scholar]
- 34. Matsuoka Y, Nagahara Y, Ikekita M, et al. A novel immunosuppressive agent FTY720 induced Akt dephosphorylation in leukemia cells. Br J Pharmacol 2003;138:1303–1312. [DOI] [PMC free article] [PubMed] [Google Scholar]
- 35. Wang JD, Takahara S, Nonomura N, et al. Early induction of apoptosis in androgen‐independent prostate cancer cell line by FTY720 requires caspase‐3 activation. Prostate 1999;40:50–55. [DOI] [PubMed] [Google Scholar]
- 36. Yasui H, Hideshima T, Raje N, et al. FTY720 induces apoptosis in multiple myeloma cells and overcomes drug resistance. Cancer Res 2005;65:7478–7484. [DOI] [PubMed] [Google Scholar]
Associated Data
This section collects any data citations, data availability statements, or supplementary materials included in this article.
Supplementary Materials
Fig S1. Effect of S1P on cell proliferation in serum‐deprived medium.
Table S1. Primer sequences for qRT‐PCR.