Abstract
Rett syndrome (RTT) is a severe neurodevelopmental disorder caused by mutations in the X chromosomal gene Methyl-CpG-binding Protein 2 (MECP2) (1). RTT treatment so far is symptomatic. Mecp2 disruption in mice phenocopies major features of the syndrome (2) that can be reversed upon re-expression of Mecp2 (3. It has recently been reported that transplantation of wild type (WT) bone marrow (BMT) into lethally irradiated Mecp2tm1.1Jae/y mice prevented neurologic decline and early death by restoring microglial phagocytic activity against apoptotic targets (4). Based on this report, clinical trials of BMT for patients with RTT have been initiated (5). We aimed to replicate and extend the BMT experiments in three different RTT mouse models but found that despite robust microglial engraftment, BMT from WT donors did not rescue early death or ameliorate neurologic deficits. Furthermore, early and specific genetic expression of Mecp2 in microglia did not rescue Mecp2-deficient mice. In conclusion our experiments do not support BMT as therapy for RTT.
We first sought to replicate BMT-mediated rescue of male mice derived from the same Mecp2tm1.1Jae/y colony from the original report (4), implementing established standards for conducting preclinical studies (2,6). Mice were maintained on C57Bl/6J background, which was confirmed in recipient animals by genome scanning (data available upon request). Four week-old Mecp2tm1.1Jae/y mice and wild type littermates were subjected to the same protocol of lethal split-dose γ-irradiation and randomized to receive tail vein injection of bone marrow from Mecp2-deficient male littermates or bone marrow from Mecp2-proficient animals including C57Bl/6J male mice ubiquitously expressing GFP and Mecp2+/y littermates of the recipients. All animals achieved multilineage peripheral blood engraftment judged by the fraction of donor-derived GFP-expressing cells in peripheral blood 4 and 8 weeks post-transplant (Extended Data Figure 1a). PCR analysis of blod and tail tissue 4 weeks after transplant also confirmed expression of the appropriate mutant or WT variant of Mecp2 in blood in all groups (Extended Data Figure 1b). Microglial engaftment in brain parenchyma, 30 and 90 days post-transplant was similar in mutant and WT recipients engrafted with marrow from WT mice ubiquitously expressing a GFP transgene, (Fig. 1, A and B, and Extended Data Figure 1c), and comparable to engraftment observed by Derecki et al. (4) and others (7).
Figure 1. Early transplantation of wild-type microglia into the brain does not rescue Mecp2-null mice.
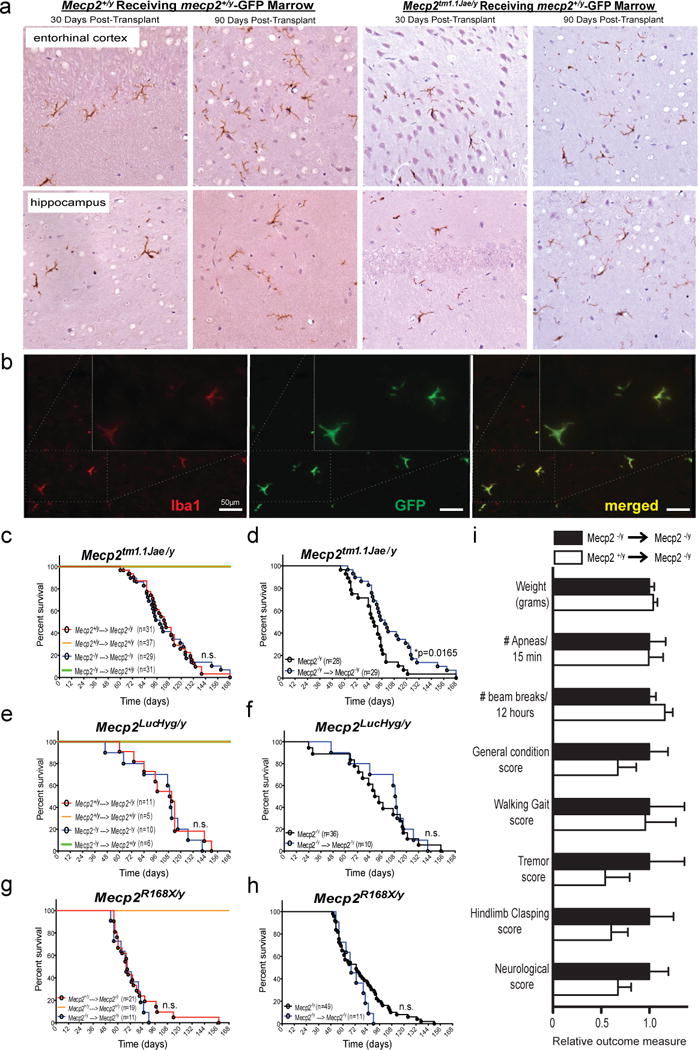
a, Transplantation of bone marrow from C57BL/6 mice with ubiquitous GFP transgene expression into Mecp2tm1.1Jae/y mice confers robust donor engraftment at the indicated time postransplant shown via immunohistochemical detection of GFP-postive cells of microglial morphology in entorhinal cortex and hippocampus, in both Mecp2+/y -GFP donors → Mecp2tm1.1Jae/y, and Mecp2+/y -GFP donors → Mecp2+/y groups. b, Double immunofluorescent labeling with GFP and Iba1 in cerebellar tissue from Mecp2+/y -GFP donors → Mecp2tm1.1Jae/y mice examined 30 days post BMT confirms early microglial engraftment in brain parenchyma. Quantification of microglial engraftment 30 days posttransplant using double immunoflurescence labeling for GFP and Iba1 is presented in Extended Data Figure 1c. c–h, No differences in survival were noted between Mecp2+/y → Mecp2-null mice and Mecp2-null → Mecp2-null mice, indicating that engraftment of WT microglia into the brains of Mecp2-null mice did not protect Mecp2-null mice from premature death. In addition, no differences in survival were noted between Mecp2-null → Mecp2+/ymice and Mecp2+/y → Mecp2+/ymice, indicating that engraftment of Mecp2-null microglia into the brains of WT mice does not shorten survival as seen in Mecp2-null mice. i, No differences were seen in other outcome measures at 12 weeks of age, 8 weeks after BMT, between Mecp2+/y → Mecp2tm1.1Jae/y mice (n=31) and Mecp2tm1.1Jae/y → Mecp2tm1.1Jae/y mice (n=25), including weight, frequency of breathing apneas, locomotor activity (beam breaks), general condition, walking gait, tremor, hindlimb clasping or neurological score. Here, data is presented as relative outcome measure. Values for each measure were determined for Mecp2+/y → Mecp2tm1.1Jae/y mice and Mecp2tm1.1Jae/y → Mecp2tm1.1Jae/y mice, and means and standard deviation were calculated. All values (both means and standard deviations) were then divided by the mean value for Mecp2tm1.1Jae/y → Mecp2tm1.1Jae/y mice, for relative comparison in the composite graph. Specific values obtained for Mecp2tm1.1Jae/y → Mecp2tm1.1Jae/y mice and Mecp2+/y → Mecp2tm1.1Jae/y mice are as follows: weight in grams (18.22 +/− 0.93 vs 18.96 +/− 0.8); # apneas/15 min (35.4 +/− 5.96 vs 35.2 +/− 5.24); # beam breaks/12 hours (3729.2 +/− 253.3 vs 4330.2 +/− 305.2); general condition score (0.52 +/− 0.1 vs 0.35 +/− 0.1); walking gait score (0.24 +/− 0.087 vs 0.23 +/− 0.076); tremor score (0.24 +/− 0.087 vs 0.13 +/− 0.061); hindlimb clasping score (0.48 +/− 0.12 vs 0.29 +/− 0.083); neurological score (1.48 +/− 0.29 vs 1 +/− 0.2). None of the differences were statistically signficicant.
Contrary to our expectation, Mecp2tm1.1Jae/y mice that received Mecp2+/y marrow had no extension of lifespan compared to Mecp2tm1.1Jae/y marrow recipients (Fig. 1C). No difference in survival was observed in mutant animals that received Mecp2+/y marrow from WT littermates or C57Bl/6J animals ubiquitously expressing GFP (Extended Data Figure 1d). We also observed no benefit in outcome measures at 12 weeks of age, 8 weeks after transplant, including weight, breathing, locomotion, general condition, walking gait, tremor, hindlimb clasping or neurological score (Figure 1i). Thus, the same BMT procedure with substantially greater numbers of animals,randomly assigned to treatment group, from the same Mecp2tm1.1Jae/y mouse colony did not replicate any aspects of protection reported by Derecki et al (4). Furthermore,histologic analysis blind to genotype and treatment group showed no neuropathologic evidence of differential apoptosis, microglial response, or tissue degeneration between experimental groups (Extended Data Figure 1e). No protective effect on survival was noted in two additional mouse models of Rett syndrome as well (Figure 1, e and g): Mecp2LucHyg/y mice (Extended Data Figure 2), and Mecp2R168X/y mice (8), despite excellent engraftment after BMT (Extended Data Figure 2). Experiments with these two models were performed in independent laboratories following the same BMT protocol (4).
In all models, WT mice transplanted with WT bone marrow showed no mortality, indicating the procedure was well tolerated (Figure 1, c, e, and g). Likewise, BMT was well-tolerated by mutant animals, as Mecp2 mutant animals receiving mutant marrow exhibited either no change (Mecp2LucHyg/y and Mecp2R168X/y mice), or, surprisingly, slightly reduced mortality (Mecp2tm1.1Jae/y mice) compared to naive mice not subjected to BMT (Figure 1, d, f and h). The small survival extension may be related to a salutary effect of post-irradiation antibiotic treatment of transplanted animals, to which naive animals were not exposed, or to differences in animal handling (9).
To further address the role for microglia in RTT reported by Derecki et al (4), we used the Cre/lox system and a lox-stop-lox allele of Mecp2 (Mecp2LSL) to examine the effect of genetically-driven expression of Mecp2 in microglia during development. First, we analyzed the suitability of the LysM-Cre transgene, which was used by Derecki et al (4) in their genetic Mecp2LSL/y rescue experiments (4), to drive efficient microglia-specific gene restoration. As previously reported (10), LysM-Cre driven dTomato reporter cells account for less than 25% of microglia, as assessed using flow cytometry of microglia derived from mice containing the LysM-Cre transgene and a transgene expressing Cre-dependent dTomato (Extended Data Figure 3a). Furthermore, when we generated LysM-Cre; Mecp2LSL/Y mice, we observed MeCP2 expression in neurons (large NeuN+ cells) in many brain regions (Extended Data Figure 3b). To identify a Cre transgenic line that drives efficient expression within microglia, we next evaluated Vav1-Cre transgene, which selectively expresses throughout the hematopoietic compartment (11). In contrast to LysM-Cre, Vav1-Cre transgene targeted microglia with high efficiency (Figure 2a) and specificity (Figure 2b). As Vav1-Cre-driven expression in brain proved to be efficient and restricted to microglia, we applied this system to test whether expression of Mecp2 in microglia rescues Mecp2-null mice. To quantify Mecp2 restoration in microglia, we utilized the fms-GFP transgene, expression of which within brain is restricted to microglia, for flow sorting (11) (Extended Data Figure 3c). Microglia derived from Vav1-Cre; Mecp2LSL/Y animals expressed Mecp2 mRNA at 75% of the level of Mecp2 mRNA in microglia derived from Mecp2+/Y animals (Figure 2c). Similar to other Mecp2-null mouse models, Mecp2LSL/Y animals showed hypoactivity, poor motor coordination on parallel rod walking, increased basal and hypoxia breathing rate, increased apneas, and early death, none of which were improved by Mecp2 expression in microglia of Vav1-Cre; Mecp2LSL/Y animals (Figure 2, d–h). We thus conclude that, in contrast to the data reported by Derecki et al. (4), driving Mecp2 expression developmentally in microglia does not ameliorate the phenotype of MeCP2-null mice.
Figure 2. Genetic reconstitution of Mecp2 in microglia does not rescue Mecp2-null mice.
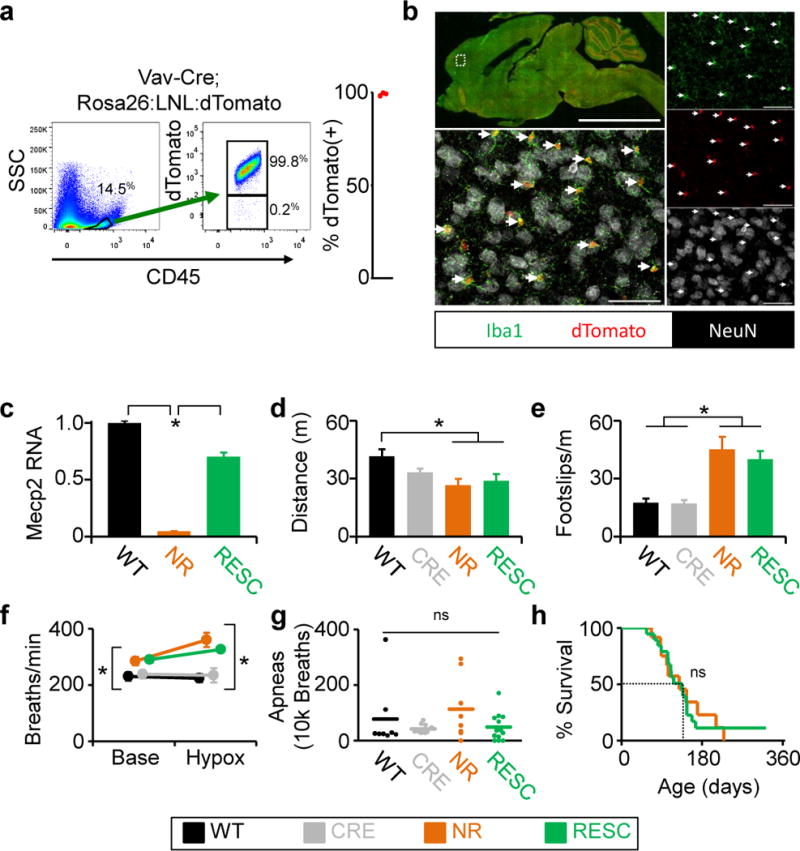
a, b, Evaluation of efficiency and specificity of Vav1-Cre in microglia. a, Representative flow sorting of microglia derived from brains from Vav1-Cre; Rosa26:LSL:tdTomato mice shown on left, with quantification (n=3) of cells that express both fluorescent reporter (tdTomato) and microglia marker (CD45) shown on right. b, Histological characterization of tdTomato expression in brain from Vav1-Cre; Rosa26:LSL:tdTomato. tdTomato expression is seen in red, Iba1 (microglia) in green, and neurons (NeuN) in white. Upper left shows low-power image of a mid-sagittal section. Lower left shows higher power image of cortex. Images on right are individual color channels contributing to merged image in lower left. Right facing arrows indicate microglia expressing tdTomato (Iba1+; tdTomato+). Scale bar in low power image is equal to 5mm, in high power images is equal to 50 μm. c, qPCR results of Mecp2 expression from flow sorted microglia derived from wild-type (n=2), Mecp2lox-stop/Y (n=2), and Vav1-Cre; Mecp2lox-stop/Y (n=3) animals. d, Distance traveled in open field assay. e, Number of footslips per distance traveled on parallel rods. f, Breathing rate at baseline and during hypoxia challenge. g, Number of apneas per 10,000 breaths. h, Survival curve. c-h, Genotypes and labels: Mecp2+/Y=WT (n=8), black; Vav1-CreTg/+=CRE (n=10), gray; Mecp2LSL/Y=NR (n=12), orange; Mecp2LSL/Y;Vav1-CreTg/+=RESC (n=13), green Mean values are displayed, Error bars +/−SEM, *p<0.05.
In conclusion, we observe no benefit of BMT-mediated delivery of WT microglia into the brains of three different preclinical models of RTT, nor do we observe a causative role of microglia in the disease process. Our BMT studies included large numbers of mice derived from the same parent colony used in the original report (4), with treatment assigned randomly and analysis conducted blind to genotype and treatment group. Finally, we showed that even early and highly efficient genetically-driven Mecp2 expression in microglia of Mecp2-null mice conferred no protective effect. Restoration of MeCP2 in microglia using bone marrow transplantation or genetics does not rescue the major observed phenotypes in RTT, which argues against the previously proposed therapeutic potential of BMT in patients with RTT (4).
METHODS SUMMARY
Details of procedures and reagents are described in Methods.
Extended Data
Extended Data Figure 1.
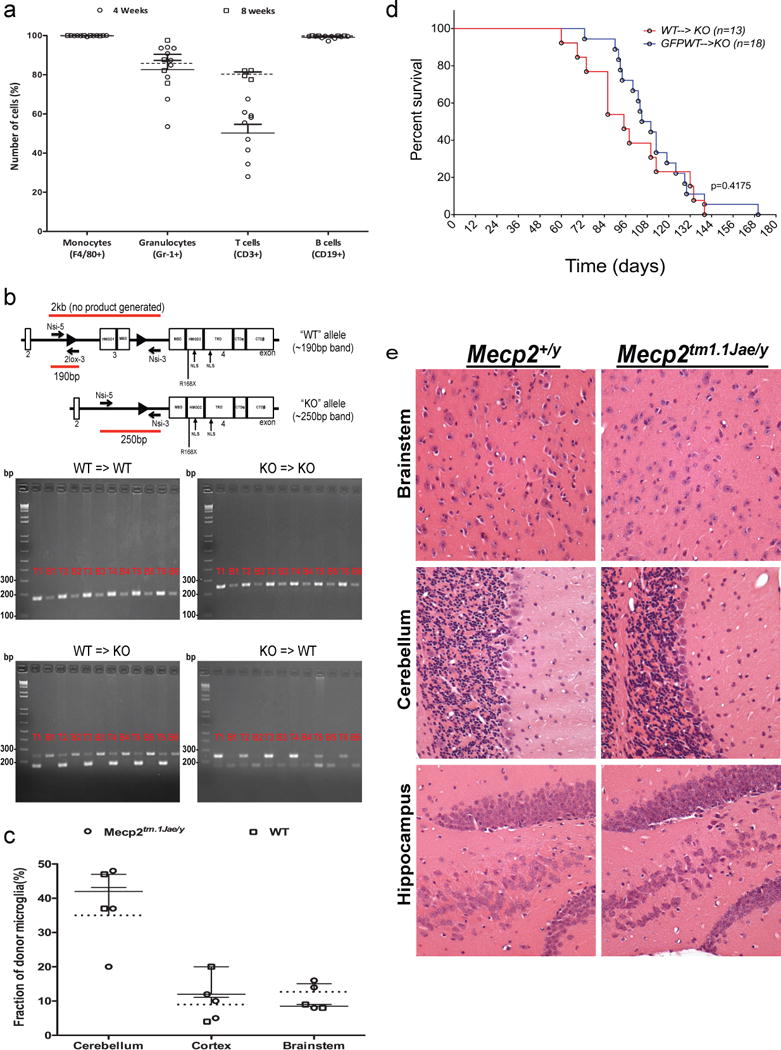
a, Mulilineage peripheral blood engraftment with donor cells in Mecp2tm1.1Jae/y and WT mice. WT and Mecp2tm1.1Jae/y animals received transplant from WT animals ubiqutously expressing green fluorescent protein (GFP) (Jackson Labs, C57BL/6-Tg(UBC-GFP)20Scha/J, stock 004353). Peripheral blood engraftment in indicated blood lineages was measure by flow cytometry (GFP) 4 weeks and 8 weeks posttransplant. b, PCR analysis of blood and tail tissue 4 weeks after transplant. PCR analysis shows expression of only the appropriate mutant or WT variant of Mecp2 from the donor in blood in all four groups, with retention of the original genotype in tail tissue as expected. Specifically, Mecp2+/y → Mecp2+/y mice show only the WT allele at 190 bp, while Mecp2tm1.1Jae/y → Mecp2tm1.1Jae/y mice show only the mutant allele at 250 bp, as previously described in the original report of generation of these mice (Chen et al. Nature 27, 327–331, 2001). Mecp2tm1.1Jae/y → Mecp2+/ymice, however, show only the mutant allele in blood tissue and retention of host WT allele in tail tissue. Accordingly, Mecp2+/y → Mecp2tm1.1Jae/y mice show only the WT allele in blood tissue, with retention of the host mutant allele in tail tissue. Tail tissue in these latter two groups shows some of the allele from the donor as well, presumably due to blood contained within the tail clips used for analysis. Importantly, the Mecp2 allele expressed in blood is always restricted to the donor genotype, indicating successful transplantation with complete replacement of the hematopoeitic system in the host. Samples are labelled with a ‘T‘ for tail and ‘B‘ for blood, followed by the number of the animal, indicating that 6 different animals were analyzed for each condition. HMGD1 = high mobility group protein-like domain 1; HMGD2 = high mobility group protein-like domain 2; MBD= methyl binding domain; TRD= transcription repression domain; NLS= nuclear localization signal; CTD = C-terminus domain alfa and beta. c, Robust and early microglial engraftment of donor cells following bone marrow transplantation in Mecp2tm1.1Jae/y and WT mice. Microglial engraftment was visualized using double immunofluorescence staining in sections quenched for autofluorescence by incubation in Sudan black solution. All sections were stained with an anti-Iba-1 primary with CY-3 secondary and an anti-GFP primary with CY-5 secondary. All microglia are Iba-1-positive, and thus successfully engrafted GFP-expressing donor derived microglia were observed as GFP and Iba-1-positive, while native microglia were only Iba-1-positive. Engraftment of microglia into WT and Mecp2LucHyg/y mice was determined by dividing the GFP+/Iba-1+ cells by the number of total Iba-1+ cells. Cell counts were performed in cerebellum, cortex and brainstem from mice. Percent engraftment in WT and Mecp2tm1.1Jae/y mice yielded similar results to previously published engraftment results at 30 days post-transplant (9). d, BMT was well-tolerated in animals. No difference in survival was observed in mutant animals that recived Mecp2+/y marrow from their WT littermates (WT, N=13) and C57Bl/6J animals ubiquitously expressing GFP (WT-GFP, N=13). e, Representative H&E-stained sections of cerebellum, brainstem and hippocampus (400×) from age-matched WT and Mecp2tm1.1Jae/y mice sacrificed at 7 weeks of age. Sections demonstrate comparable histologic features between WT and Mecp2tm1.1Jae/y brains and a lack of gliosis, cell loss, cellular debris, microglia or macrophages in Mecp2tm1.1Jae/y brains.
Extended Data Figure 2. Early transplantation of wild-type microglia into the brain does not rescue additional models of Mecp2-null mice: Mecp2LucHyg mice and C57B6/J-Mecp2R168X mice.
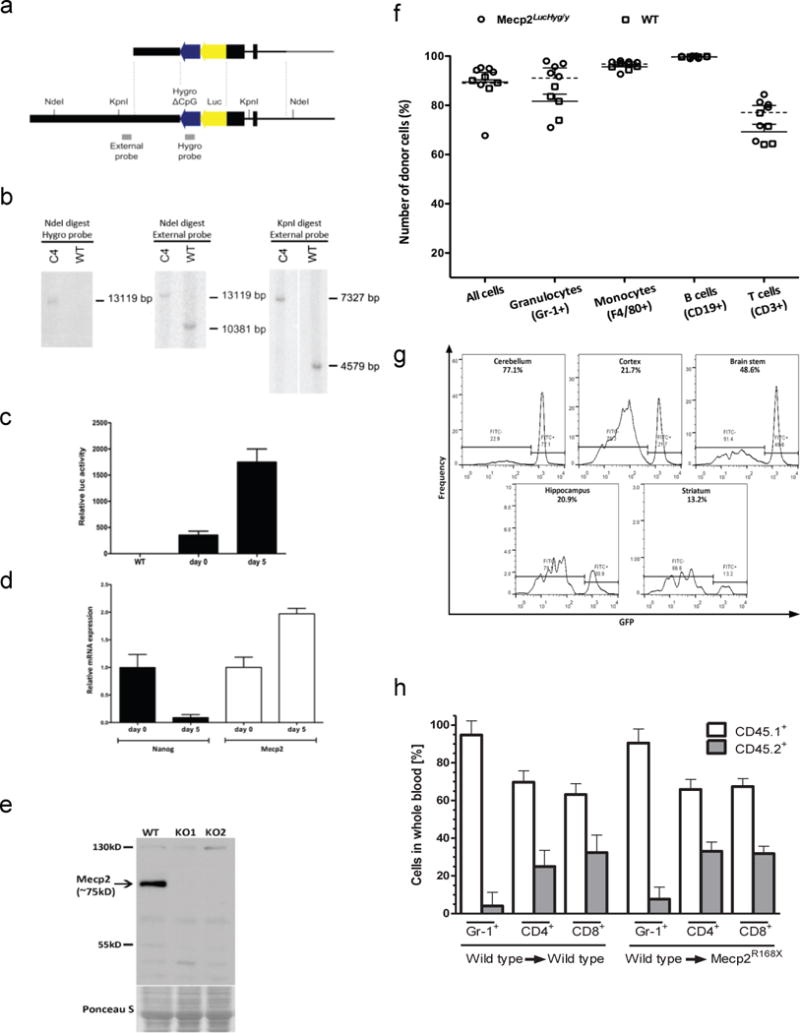
a, Generation of Mecp2LucHyg mice. Luciferase/Hygromicin (LucHyg) fusion gene vector correctly targeted to the Mecp2 locus in ES cells. Positions of the probes and enzyme restriction sites are indicated. The targeting vector’s homology arms are depicted in black, and its backbone in grey. b,Confirmation of genetic targeting for Mecp2LucHyg mice. Southern blotting of NdeI or KpnI-digested DNA extracted from clone C4 cells, used for blastocyst injections, hybridized with either the Hygromycin probe (Hygro) or External probe confirms correctly targeted event. c, Luciferase activity in clone C4 cells before (Day 0) or after subjecting cells to retinoic acid (RA)-induced differentiation (Day 5). Following adsorption to eliminate feeder mouse embryonic fibroblasts, clone C4 ES cells were treated with RA (100 nM) in differentiation medium for 5 days and Luciferase activity was measured before and after RA treatment. Mean values are plotted relative to that of the wild-type cells (n=3, error bars represent standard deviation). RA-induced differentiation leads to an increase in luciferase activity consistent with an increase in Mecp2 expression level as measured in d. d,mRNA level of Mecp2 increased and mRNA level of ES marker Nanog decreased in clone C4 cells subjected to RA-induced differentiation. mRNA levels were measured before and after treatment by real-time quantitative PCR. Mean values are plotted relative to day 0 for each mRNA (n=3, error bars represent standard deviation). e, Western blot analysis of Mecp2 expression in brains of wild-type and Mecp2LucHyg male mice. MeCP2 protein is not detected in Mecp2 luciferase males. The ponceau S staining serves as a loading control. f, g, Robust peripheral blood and microglial engraftment of donor cells following bone marrow transplantation (BMT) in Mecp2LucHyg/y mice. WT and Mecp2LucHyg/y mice received WT bone marrow marked with GFP or CD41.1. Peripheral blood engraftment was measured by flow cytometry (GFP or CD45.1) in the indicated lineage 4–8 weeks posttransplant. For CNS engraftment, flow cytometry was performed on isolated mononuclear cells from the cortex, brain stem, cerebellum, hippocampus and striatum. Engraftment of BMT-derived cells was determined by dividing the CD11b+CD45+GFP+ cell population by total CD11b+CD45+ monocytes/microglia. h, Robust peripheral blood engraftment of donor cells 7 weeks following bone marrow transplantation in Mecp2R168X mice. Reconstitution of bone marrow from B6.SJL-Ptprca Pepcb/BoyJ mice into wild-type mice and C57B6/J-Mecp2R168X mice showed robust engraftment in peripheral blood. Reconstitution of bone marrow was determined by FACS analysis of peripheral blood using anti GR-1, anti CD4, anti CD8 antibodies and CD45.1 for the donor cells (B6.SJL-Ptprca Pepcb/BoyJ mice, white bars) and CD45.2 for host cells (wild-type and C57B6/J-Mecp2R168X mice, grey bars).
Extended Data Figure 3. Flow sorting and histological characterization of LysM-Cre or Vav1-Cre transgenic mice.
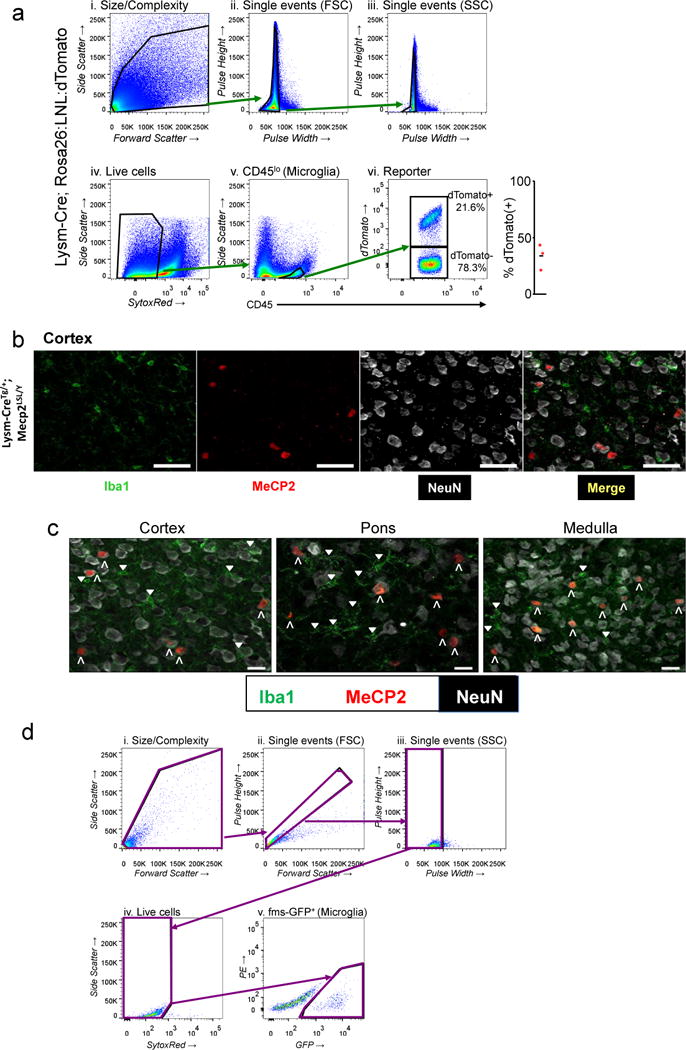
a, Stepwise process to characterize the amount of microglia (CD45 lo expressing) cells that also express tdTomato in a LysM-Cre dependent fashion. b, High power images of cortex from LysM-CreTg/+; Mecp2LSL/Y animals. Each panel shows single channel images and merged image. The first panel shows microglia (Iba1 expression) in green, the second panel shows MeCP2 protein in red, the third panel shows NeuN in white, and the fourth panel shows the merged image. Scale bar in all is 50 μm. c, Merged high power images from Cortex, Pons, Medulla from LysM-Cre; Mecp2LSL/Y animal. Colors are as in b. Upward facing carrots identify large NeuN staining cells that express MeCP2 (NeuN+; MeCP2+). Downward-facing triangles mark microglia not expressing MeCP2 (Iba+; MeCP2−). Scale bar is equal to 20μm. d, Gating strategy for microglia sorting for Mecp2 expression quantification in Vav1-Cre; Mecp2LSL/Y and control animals is presented: i. Size/Complexity (size/cytoplasmic granularity for cells but not debris); ii. Forward scatter pulse height/area (eliminates doublet cells); iii. Side scatter pulse height/width (eliminates doublet cells); iv. SYTOX® Red staining; dead cells are SYTOX® Red-positive and removed from the following analysis; v. fms-GFP expression analysis enables the purification of microglia.
Supplementary Material
Acknowledgments
This work was supported by research funds from the Rett Syndrome Research Trust to A.A.P, A.B. and M.S.B., NIH grant P5OAGO5136 and and R01AG031892 to C.D.K, the Nancy and Buster Alvord Endowment to D.K.,the German Research Foundation Grant HU 941/2-1 to P.H., the German-Israel Foundation (GIF) grant 1048/2009 to P.H., a National Heart, Lung and Blood Institute grant U01HL100395 to I.D.B., and the Winship Cancer Center Support Grant (P30 CA138292) to D.J.B. H.D.J. is supported by the National Science Foundation Graduate Research Fellowship under Grant No. 2012140236-02. This project was supported by NIH/NICHD (R01HD062553 to JLN), research funds from the International Rett Syndrome Foundation to JLN, Baylor College of Medicine (BCM) Cytometry and Cell Sorting Core with funding from the NIH (NCRR grant S10RR024574, NIAID AI036211 and NCI P30CA125123), from the BCM Mouse Neurobehavioral Core funded by the BCM-IDDRC (P30HD024064) from the Eunice Kennedy Shriver National Institute of Child Health and Human Development. The content is solely the responsibility of the authors and does not necessarily represent the official views of the Eunice Kennedy Shriver National Institute of Child Health and Development of the National Institutes of Health. The authors thank Jonathan Kipnis and Noel Derecki for careful training of the investigators on bone marrow transplantation in mice and for in-depth discussion of the results, Anjali Rajadhyaksha and Aaron Katzman for helpful discussion, Mark Sands for thorough review of BMT studies and discussion of the results, Kristine Wong for assistance with the analysis of Mecp2LucHyg ES clones, and the Research Pathology Lab of the Cancer Tissue and Pathology Shared Resources within the Winship Cancer Institute for assistance with immunohistochemistry, especially Dianne Alexis. We thank Jan Abkowitz, Joseph M. Ready, Huda Zoghbi and Sol Snyder for critical review of the manuscript.
Footnotes
Online Content: Methods and Extended Data display items are available in the online version of the paper; references unique to these sections appear only in the online paper.
Contributor Information
Peter Huppke, Email: phuppke@med.uni-goettingen.de.
Jeffrey Neul, Email: jneul@ucsd.edu.
Antonio Bedalov, Email: abedalov@fhcrc.org.
Andrew A. Pieper, Email: andrew-pieper@uiowa.edu.
References
- 1.Neul JL. The relationship of Rett syndrome and MECP2 disorders to autism. Dialogues Clin Neurosci. 2012;14:253–62. doi: 10.31887/DCNS.2012.14.3/jneul. [DOI] [PMC free article] [PubMed] [Google Scholar]
- 2.Katz DM, et al. Preclinical research in Rett syndrome: setting the foundation for translational success. Dis Mod and Mech. 2012;5:733–745. doi: 10.1242/dmm.011007. [DOI] [PMC free article] [PubMed] [Google Scholar]
- 3.Guy J, Hendrich B, Holmes M, Martin JE, Bird A. A mouse Mecp2-null mutation causes neurological symptoms that mimic Rett syndrome. Nature Genet. 2001;27:322–326. doi: 10.1038/85899. [DOI] [PubMed] [Google Scholar]
- 4.Derecki NC, et al. Wild-type microglia arrest pathology in a mouse model of Rett syndrome. Nature. 2012;18:105–9. doi: 10.1038/nature10907. [DOI] [PMC free article] [PubMed] [Google Scholar]
- 5.MT2013-31:Allogeneic Hematopoietic Cell Transplantation for Inherited Metabolic Disorders, Sever Osteoporosis and Males with Rett Syndrome Following Conditioning with Busulfan (Therapeutic Drug Monitoring), Fludarabine +/− ATG. University of Minnesota; Minneapolis, MN USA: [Google Scholar]
- 6.Landis SC, et al. A call for transparent reporting to optimize the predictive value of preclinical research. Nature. 2012;490:187–91. doi: 10.1038/nature11556. [DOI] [PMC free article] [PubMed] [Google Scholar]
- 7.Yang Y, et al. Perivascular, but not parenchymal, cerebral engraftment of donor cells after non-myeloablative bone marrow transplantation. Exp Mol Pathol. 2013;95:7–17. doi: 10.1016/j.yexmp.2013.03.010. [DOI] [PMC free article] [PubMed] [Google Scholar]
- 8.Brendel C, et al. Readthrough of nonsense mutations in Rett syndrome: evaluation of novel aminoglycosides and generation of a new mouse model. J Mol Med (Berl) 2011;89:389–398. doi: 10.1007/s00109-010-0704-4. [DOI] [PMC free article] [PubMed] [Google Scholar]
- 9.Pitcher MR, et al. Insulinotropic treatments exacerbate metabolic syndrome in mice lacking MeCP2 function. Hum Mol Genet. 2013;22:2626–33. doi: 10.1093/hmg/ddt111. [DOI] [PMC free article] [PubMed] [Google Scholar]
- 10.Goldmann T, et al. A new type of microglia gene targeting shows TAK1 to be pivotal in CNS autoimmune inflammation. Nat Neurosci. 2013;11:1618–26. doi: 10.1038/nn.3531. [DOI] [PubMed] [Google Scholar]
- 11.Sasmono RT, et al. A macrophage colony-stimulating factor receptor-green fluorescent protein transgene is expressed throughout the mononuclear phagocyte system of the mouse. Blood. 2003;101:1155–63. doi: 10.1182/blood-2002-02-0569. [DOI] [PubMed] [Google Scholar]
Associated Data
This section collects any data citations, data availability statements, or supplementary materials included in this article.


