

Abstract
Small intestine neuroendocrine tumors (SI-NETs) are rare tumors arising from the enterochromaffin cells of the gut. Having a first-degree relative with a SI-NET has been shown to confer a substantial risk arising from shared environment and genetics. Heritable risk was examined using a computerized genealogy linked to historical statewide cancer data. A population-based analysis of the observed familial clustering of SI-NETs was performed to assess the genetic risk in distant relatives. A test for significant excess relatedness of 384 individuals with genealogy data and histologically confirmed SI-NETs was performed by comparing pairwise relatedness of cases to 1,000 sets of matched controls. Overall significant excess pairwise relatedness was found for the 384 cases (p<0.001) and was still observed when closer than first cousin relationships were ignored (p=0.041). Relative risks for SI-NETs were estimated as a ratio of observed to expected number of SI-NET cases among each relationship class. Siblings have a 13.4-fold (p<0.0001) and parents have a 6.5-fold (p=0.143) relative risk, suggesting both genetic and environmental influences. The risk extends out to 3rd degree relatives with a 2.3-fold relative risk (p=0.008). Metachronous cancers were also reported in 26% of the SI-NET cases demonstrating an increased relative risk of colon, bladder, non-Hodgkin lymphoma, melanoma and prostate cancers. Although SI-NETs are rare, relatives of these cases are at a significantly elevated risk of developing a SI-NET due to heritable genetic factors. Definition of the genetic risk factors will be an important tool for earlier diagnosis and better outcomes for SI-NETs.
Keywords: familial, genetics, neuroendocrine tumor, population, relative risk, small intestine
Introduction
Carcinoids are rare neuroendocrine tumors; 67% occur in the gastrointestinal tract, primarily in the small intestine (Amin et al. 2012; Kharazmi et al. 2013) (Modlin, et al. 2003). Carcinoid tumors of the small intestine, presently called small intestinal neuroendocrine tumors (SI-NETs) derive from enterochromaffin cells of the neuroendocrine system in the gut and during development, originate from the same stem cells as the rest of the gut epithelium (not neural crest). These cells contain a large amount of the body’s store of serotonin and, in response to stimuli in the lumen (chemical, mechanical, pathological), the release of serotonin regulates gut motility and secretion as well as triggering nausea signals to the brain. SI-NETs comprise approximately 40% of all small intestinal primary tumors and are similar in frequency to adenocarcinomas of the small intestine (Amin et al. 2012; Kharazmi et al. 2013). Incidence of SI-NETS is 0.9 per 100,000 population per year with the rate steadily increasing over the past 30 years (Amin et al. 2012; Kharazmi et al. 2013).
Information about how these tumors arise is limited, but both environmental and genetic risks have been shown to promote risk. Cigarette smoking and alcohol are associated with an elevated odds ratio (5.8 and 4.4 respectively) (Amin et al. 2012; Kharazmi et al. 2013). Much of what is known about familial contribution of SI-NETs has come from the Nordic population databases going back to the 1950’s and looking at first-degree relationships. These studies have reported high relative risks of 9- to 11-fold and a standardized incidence ratio of 13 in first degree relatives representing shared genetics and environment (Amin et al. 2012; Kharazmi et al. 2013).
A few rare genetic syndromes include carcinoid cancers within the tumor spectrum, including syndromes caused by mutations in MEN1, RET, CDKN1B, and NF1 (Zikusoka, et al. 2005). SI-NETs, however are uncommon even these syndromes. Somatic mutations in CDKN1B/p57 are commonly identified in SI-NETs, but to the author’s knowledge no SI-NET has been reported in patients with germline mutations in CDKN1B (Amin et al. 2012; Kharazmi et al. 2013). Recently, a germline mutation in inositol polyphosphate multikinase (IMPK) was identified in a single large multi-generation family with multiple SI-NETs (Amin et al. 2012; Kharazmi et al. 2013). The remaining 32 families in this study, however, did not harbor mutations in IPMK. These syndromes along with this single family with an IMPK mutation explain an extremely small portion of familial SI-NETs. Much of the genetic predisposition is yet to be defined.
Here we expand upon previous reports describing the familial nature of SI-NETs and demonstrate genetic risk in distant relatives thereby removing the shared environmental risk. We used the Utah Population Database (UPDB), a resource of 1.6 million individuals in 6 or more generation pedigrees dating back to the 1800’s and linked with statewide cancer records, dating back to 1966. The Utah population represents a broad Northern European ancestry and has low rates of tobacco and alcohol use, both of which are confounding environmental risk factors for SI-NETs (Amin et al. 2012; Kharazmi et al. 2013). Our analysis shows strong evidence of significant excess relatedness of cases and significantly elevated risks for SI-NETs in close and distant relatives.
Materials and methods
This study has been approved by the Institutional Review Board for Human Subject Research of University of Utah and the Resource for Genetic and Epidemiological Research which oversees use of Utah Population Database (UPDB).
Utah Population Database
A computerized genealogy of Utah was created in the 1970s (Amin et al. 2012; Kharazmi et al. 2013) to represent the Mormon pioneers and their descendants and is an integral part of the UPDB. The Utah genealogy has been extended with Utah vital statistics (e.g. mother, father and child trios from birth certificates) and individual geographic and demographic data (e.g. census and driver’s license data) for much of the Utah population. UPDB currently numbers 8 million unique individuals. The genealogy data from UPDB used in this study includes the 2.8 million individuals who are part of at least a 3 generation family, and who connect to the original Utah genealogy; this insures that all cases and controls analyzed are similar with respect to genealogical data available. The statewide Utah Cancer Registry (UCR) data has been linked to the UPDB genealogy data, allowing description of the observed familial clustering of cancers in Utah.
Utah Cancer Registry
The UCR was started in 1966 and became a National Cancer Institute Surveillance, Epidemiology, and End-Results (SEER) Registry in 1973. The contribution of cancer data to the UCR is mandated by state law; all independent primary tumors diagnosed or treated in the state are included and confirmed by histopathology. SI-NETs were identified with primary site 170–179 and histology 8240–8244 and 8249 from the International Classification of Diseases for Oncology, Revision 3 (ICD-O).
Genealogical Index of Familiality (GIF) Method
In the presence of a genetic contribution to predisposition to SI-NETs, cases should be more related to each other than expected in the Utah population. To test the hypothesis of excess relatedness among the cases, the average pairwise relatedness of individuals diagnosed with SI-NET was measured and compared to the average pairwise relatedness for a matched, randomly selected similar group of individuals from the UPDB as described previously (Albright, et al. 2012). The degree of relatedness of a pair of individuals was measured using the Malécot coefficient of kinship, that is, the probability that randomly selected alleles at the same chromosomal location from the two individuals are identical by descent from a common ancestor. The coefficient = 0.5 for parent/offspring, 0.25 for siblings, 0.125 for avunculars, and so forth. The case GIF is the mean of the coefficients of kinship for all pairs of cases. The coefficient for any randomly selected pair of individuals in the population is expected to be close to 0. The case GIF is multiplied by 105 for ease of presentation.
To test the hypothesis of excess relatedness among cases, an empirical distribution for the expected pairwise relatedness was created. For each case, a control was selected at random from the UPDB, matched on sex, five-year birth cohort, having 3 or more generations of genealogy data, birth state (in or out of Utah), and birth county for individuals born in Utah (urban or rural) resulting in a control set of the same size as the case set. This matching strategy accounts for potential differences in kinship and risk based on differences in birth year, sex and place of birth. One thousand independent control sets were selected and the GIF measured for each set to create an empirical distribution of average relatedness under the null hypothesis of no excess relatedness among cases. The empirical significance of the hypothesis for excess relatedness was obtained by comparing the case GIF to the distribution of the average GIF measurements from a set of 1,000 matched controls. Among close relationships, it is difficult to identify whether excess relatedness is due to shared environment or shared genetic composition, or a combination. Among more distant relationships, significant excess relatedness is indicative of a genetic contribution. We compared contributions to the GIF statistic for cases and controls across genetic distance. In the GIF analysis, genetic distance is approximated by path length between individuals in a pair. For example, a parent and a child are assigned a genetic distance of one, siblings a genetic distance of two, an aunt and a niece a genetic distance of three, and so forth. The empirical significance of the overall GIF test tells us whether overall excess pairwise relatedness is observed. This same test is also performed ignoring all close relationships (closer than first cousins) to determine whether the excess relatedness is also significant when ignoring all close relationships; this test is termed the Distant GIF (dGIF) and an empirical p value is also calculated from the comparison of the 1,000 control distributions to the case distribution.
The contribution to the GIF statistic by genetic relationship also allows consideration of what relationships contribute most to excess relatedness; this can be graphed by pairwise genetic distance (genetic distance = 1 represents parents/offspring, 2 primarily represents siblings, 3 primarily represents uncle/niece and other avuncular pairs, 4 primarily represents first cousins, and so forth) for cases compared to controls (see Figure 1).
Figure 1. Contribution to the GIF statistic by pairwise genetic distance for cases versus controls.
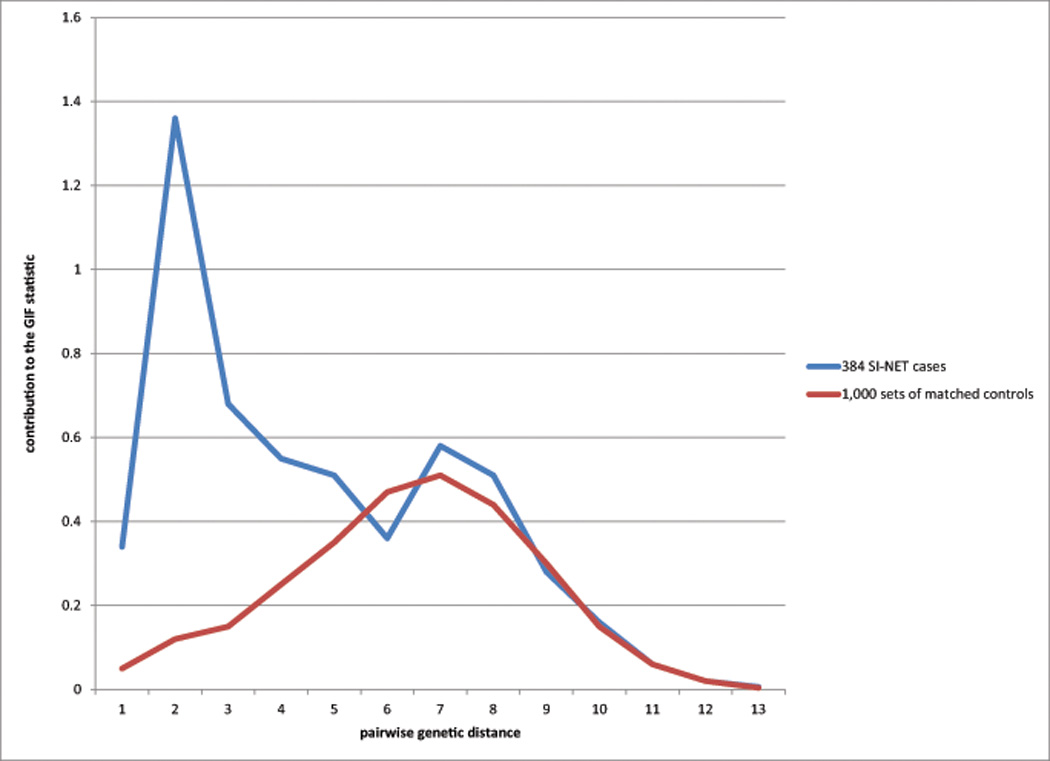
Genetic distance between pairs is shown on the x-axis and represents an increasing measure of relatedness from close to distant (1 = parent/offspring; 2 = siblings, e.g.; 3 = uncle/niece, e.g.; 4 = first cousins, e.g.). The cumulative contribution to the GIF statistic for each relatedness (as measured by genetic distance) for all pairs identified at that genetic distance is represented on the y-axis. An excess of pairwise relationships was observed for first, second, and third degree relatives (pairwise genetic distance 1 to 4), as was observed in the RR analysis. Excess pairwise relationships were also observed for more distant pairs, including an excess for example for third cousins (genetic distance = 8).
Relative Risk Method
Estimation of the relative risk (RR) for a disorder among the relatives of individuals with that disorder is a traditional method used to evaluate evidence for a heritable contribution. RRs define the risk to relatives compared to the population risk by estimating the ratio of the number of observed cases among the relatives to the number of expected cases among the relatives (based on population rates). Typically RRs are considered for close relationships only since data for more distant relatives is difficult to obtain, and because the number of relatives increases significantly at each degree of distance. To estimate population rates for SI-NETs, we assign all individuals in the UPDB who have at least 3 generations of genealogy to one of 205 cohorts based on their sex, 5-year birth cohort, birth state (Utah or elsewhere), and birth county for individuals born in Utah (urban or rural). We estimate cohort-specific rates of SI-NET by dividing the number of SI-NETs in each cohort by the total number of individuals in the cohort.
To estimate relative risk for first-degree relatives, for example, all individuals defined as cases are considered, and their first-degree relatives are counted by cohort (without duplication). The cohort-specific SI-NET rates are applied to these counts and summed over all cohorts to determine the number of expected SI-NETs among the first-degree relatives. The observed SI-NETs among the first-degree relatives are counted, without duplication. The RR for SI-NET among first-degree relatives of individuals with SI-NET is the ratio of observed to expected cases.
The RR was similarly estimated for second- and third-degree relatives and for cancers of different sites as previously described (Teerlink, et al. 2012). The RR is assumed to follow a Poisson distribution with the mean equal to the number of expected cases among relatives. Tests of significance and 95% confidence intervals (CIs) for the RR statistic can be calculated using the Poisson distribution under the null hypothesis that the RR is equal to unity. While significantly elevated risks in first-degree relatives are suggestive of a genetic contribution to disease, they may also result from shared environment, or a combination of both genes and environment. However, significantly elevated risks for second and/or third degree relatives are more strongly supportive of a genetic contribution.
High-risk pedigree identification
To identify high-risk pedigrees all ancestors for all SI-NET cases are identified and all clusters of cases descending from a founder (pedigree) can be determined. Using the method described for RRs, we apply population rates for SI-NET to all descendants in the pedigree to determine whether there is a significant statistical excess of observed to expected cases. In the presence of a significant excess of SI-NETs (p<0.05), the pedigree is termed high-risk.
Results
All 384 SI-NET cases were identified in the UCR as malignant independent primary cancers; all cancers in UCR are confirmed histopathologically. The distribution of the detailed site of the 384 SI-NETs showed 31 (8%) were located in the duodenum, 44 (11%) in the jejunum, 159 (41%) in the ileum, 5 (1%) in the meckel diverticulum, 6 (2%) were overlapping lesions of small intestine, and 139 (36%) were classified as small intestine, NOS. The histology code was 8240 (carcinoid tumor) on 99% of the cases the remainder being 8241 (argentaff carcinoid tumor, n=4) and 8244 (composite carcinoid, n=1). 219 (57%) of the 384 cases were male.
Overall, 100 other primary malignancies were observed in the 384 SI-NET cases (26%) which is consistent with reported SEER data (Amin et al. 2012; Kharazmi et al. 2013). Of the 100 SI-NET cases with cancer of another site, 21 individuals had 3 independent primaries and seven individuals had 4 independent primaries. The most common sites observed were colon cancer (n=24), prostate cancer (n=28), melanoma (n=10), NHL (n=10), breast cancer (n=7), and bladder cancer (n=8). Table 1 shows those cancers that were observed in significant excess in SI-NET cases; as seen, these cancers were all observed in significant excess except breast cancer (obs = 7; exp = 7.9; RR = 0.86; data not shown). The SI-NET was the first cancer diagnosed in 32 of these 100 cases with SI-NET and cancer of another site; 53 of the SI-NETs were observed as the second cancer, 13 were the third cancer, and 2 were the fourth cancer diagnosed. The majority of these diagnoses of cancers of other sites were made before the SI-NET diagnosis (n=62) and ranged from 50% of bladder cancers being diagnosed before SI-NET to 80% of NHL cancers being diagnosed before SI-NET.
Table 1.
Estimated RRs for cancer of other sites in SI-NET cases
| cancer | obs | exp | p | RR | 95 % CI |
|---|---|---|---|---|---|
| all sites | 384 | 54.4 | <1.0e-21 | 7.06 | 6.37, 7.80 |
| Bladder | 8 | 2.4 | 0.003 | 3.36 | 1.45, 6.63 |
| Colon | 24 | 4.0 | 8.3e-12 | 6.05 | 3.88, 9.00 |
| NHL | 10 | 4.1 | 0.010 | 2.43 | 1.17, 4.47 |
| Melanoma | 10 | 4.2 | 0.011 | 2.38 | 1.14, 4.38 |
| Prostate | 28 | 13.4 | 3.2e-4 | 2.09 | 1.39, 3.03 |
The results for the GIF test for excess relatedness of cases are shown in Table 2 which includes the sample size (n), mean GIF, mean control GIF, the empirical significance for the overall test of all relatedness (p-value), the mean distant GIF (dGIF), the mean control dGIF, and the empirical significance of the distant GIF test for a significant excess of distant relationships (p-value). Overall significant excess pairwise relatedness was noted for the 384 cases (p<0.001); in addition, when close relationships (closer than first cousin) were ignored, significant excess relatedness was still observed (p=0.043).
Table 2.
Genealogical Index of Familiality test for excess relatedness of cases of SI-NETs
| Mean GIF | Mean dGIF | ||||||
|---|---|---|---|---|---|---|---|
| N | Case | Control | p-value | Case | Control | p-value | |
| Cases | 384 | 5.42 | 2.84 | <0.001 | 3.04 | 2.52 | 0.043 |
The GIF test compares the mean pairwise relatedness of cases to the mean of 1,000 sets of matched controls. Figure 1 shows the contribution to the GIF statistic (y axis) by the pairwise genetic distance (x axis) for cases compared to controls. As can be observed, both close and distant excess relationships were observed for the cases even out to genetic distance = 4 (first cousins).
Relative Risks
Relative risks for SI-NET were estimated in first-, second-, and third-degree relatives of SI-NET cases; separately for the 3 different types of first-degree relatives (siblings, parents, and offspring); and for spouses. Estimated RRs are shown in Table 3, which includes the type of relative, the number of relatives (n), the observed number of SI-NETs in the relatives (obs), the expected number of SI-NETs in the relatives (exp), the significance of the RR hypothesis test (p), the estimated RR, and the 95% CI for the RR.
Table 3.
Estimated RRs for SI-NET in relatives of cases
| Type of relative | n | obs | exp | p | RR | 95 %CI |
|---|---|---|---|---|---|---|
| First Degree* | 3,499 | 9 | 0.98 | 1.9e-6 | 6.4 | 3.2, 11.5 |
| Siblings | 1,582 | 8 | 0.60 | 2.4e-7 | 13.4 | 5.8, 26.3 |
| Parents | 717 | 1 | 0.15 | 0.143 | 6.5 | 0.2, 36.1 |
| Children | 1,207 | 1 | 0.23 | 0.206 | 4.3 | 0.1, 24.1 |
| Second Degree | 11,702 | 8 | 1.89 | 7.6e-4 | 4.2 | 1.8, 8.4 |
| Third Degree | 31,002 | 12 | 5.28 | 8.2e-3 | 2.3 | 1.2, 4.0 |
| Spouse | 316 | 0 | 0.12 | - | - | - |
counts of different types of first degree relatives are not additive because there is no duplication in counting; an individual who is both a parent of a case and a child of a case, for example, would only be counted once as a first-degree relative but would be counted once as a parent and once as a child when these categories are considered separately.
Significantly elevated RRs for SI-NET were observed for first-, second-, and third-degree relatives of the cases. No SI-NETs were observed among the 316 spouses of the 384 cases.
The age at diagnosis of SI-NET among siblings ranged from 57 to 87, 4 of the 8 cases were female, and survival ranged from 27 to 369 months for the 6 deceased cases. The age at diagnosis for the 8 SI-NETs among second degree relatives ranged from 54 to 78 years, 5 cases were female, and survival ranged from 0 to 320 months in the 7 deceased related cases.
It is also of interest what cancers of other sites occur in relatives of cases diagnosed with SI-NET; estimated RRs are shown in Table 4. All cancer sites for which significantly elevated RRs were observed for any type of relative are shown in Table 4 for each type of relative. The significant excess of thyroid cancers in first and second-degree relatives of cases diagnosed with SI-NET suggests that some of the association of cancers of other sites in relatives may be due to genetic syndromes which include thyroid cancer in their spectrum. The similar observation of significant excess of colon cancers in the SI-NET cases as well as first- and second-degree relatives may suggest a genetic syndrome for colon cancer includes increased risk for SI-NETs.
Table 4.
Estimated RRs for cancers of other sites in relatives of cases diagnosed with SI-NETs
| Degree relative | cancer | obs | exp | p | RR | 95 % CI |
|---|---|---|---|---|---|---|
| First (n=3,499) | all sites | 431 | 344.6 | 4.7e-6 | 1.25 | 1.14, 1.37 |
| Bladder | 16 | 14.4 | 0.60 | 1.11 | 0.64, 1.80 | |
| Cervix | 8 | 10.8 | 0.54 | 0.74 | 0.32, 1.46 | |
| CLL* | 5 | 4.1 | 0.62 | 1.21 | 0.39, 2.82 | |
| Colon | 36 | 25.7 | 0.048 | 1.40 | 1.04, 1.94 | |
| NHL | 36 | 24.9 | 0.028 | 1.45 | 1.01, 2.00 | |
| Melanoma | 21 | 26.3 | 0.38 | 0.80 | 0.50, 1.22 | |
| Prostate | 99 | 72.0 | 0.002 | 1.37 | 1.12, 1.67 | |
| Thyroid | 15 | 7.0 | 0.006 | 2.13 | 1.19, 3.52 | |
| Second (n=11,702) | all sites | 827 | 726.2 | 2.0e-4 | 1.14 | 1.06, 1.22 |
| Bladder | 33 | 31.2 | 0.72 | 1.06 | 0.73, 1.49 | |
| Cervix | 35 | 23.4 | 0.018 | 1.50 | 1.04, 2.08 | |
| CLL* | 11 | 8.5 | 0.39 | 1.29 | 0.65, 2.32 | |
| Colon | 74 | 56.5 | 0.02 | 1.31 | 1.03, 1.65 | |
| NHL | 34 | 31.5 | 0.66 | 1.08 | 0.75, 1.51 | |
| Melanoma | 50 | 51.6 | 0.89 | 0.97 | 0.72, 1.28 | |
| Prostate | 151 | 145.8 | 0.65 | 1.04 | 0.88, 1.21 | |
| Thyroid | 27 | 15.8 | 0.007 | 1.71 | 1.13, 2.49 | |
| Third (n=31,002) | all sites | 2005 | 1933.3 | 0.10 | 1.04 | 0.99, 1.08 |
| Bladder | 98 | 83.3 | 0.11 | 1.18 | 0.96, 1.43 | |
| Cervix | 54 | 56.2 | 0.84 | 0.96 | 0.72, 1.25 | |
| CLL* | 38 | 23.4 | 0.004 | 1.63 | 1.15, 2.23 | |
| Colon | 161 | 148.6 | 0.30 | 1.08 | 0.92, 1.26 | |
| NHL | 180 | 140.2 | 9.2e-4 | 1.28 | 1.10, 1.49 | |
| Melanoma | 150 | 138.9 | 0.35 | 1.08 | 0.91, 1.27 | |
| Prostate | 450 | 403.9 | 0.022 | 1.11 | 1.01, 1.22 | |
| Thyroid | 42 | 37.1 | 0.41 | 1.13 | 0.82, 1.53 |
chronic lymphocytic leukemia
High-Risk Pedigrees
One-hundred forty-four of the 384 cases of SI-NET are members of high-risk pedigrees. We identified 73 high-risk pedigrees (p<0.05) with 2 to 7 cases: 1 pedigree with 7 cases, 2 pedigrees with 6 cases, 2 pedigrees with 5 cases, 3 pedigrees with 4 cases, 12 pedigrees with 3 cases, and 53 pedigrees with 2 cases. Sixty-two percent are of the cases in high risk pedigrees are male. Similar to the entire cohort, 24% had another primary cancer and the SI-NET histology was almost exclusively 8240 with the exception of 1 case which was 8241 (argentaff carcinoid tumor). The distribution of SI-NETs in the small intestine of the cases who were members of high-risk pedigrees was also similar to the distribution in all 384 Si NET cancers, with 5% in the duodenum, 13% in the jejunum, 43% in the ileum, 1% Meckel diverticulum, 1% in the overlap of the small intestine and 37% NOS. Figure 2 shows an example pedigree with 5 SI-NET cases. The founder has almost 10,000 descendants; only 0.78 SI-NETs are expected in these descendants (p=1.6e−4). Among the descendants there is an overall excess of cancer with 315 observed and 283.2 expected (p=0.03).
Figure 2. Example high-risk SI-NET pedigree with 5 cases observed.
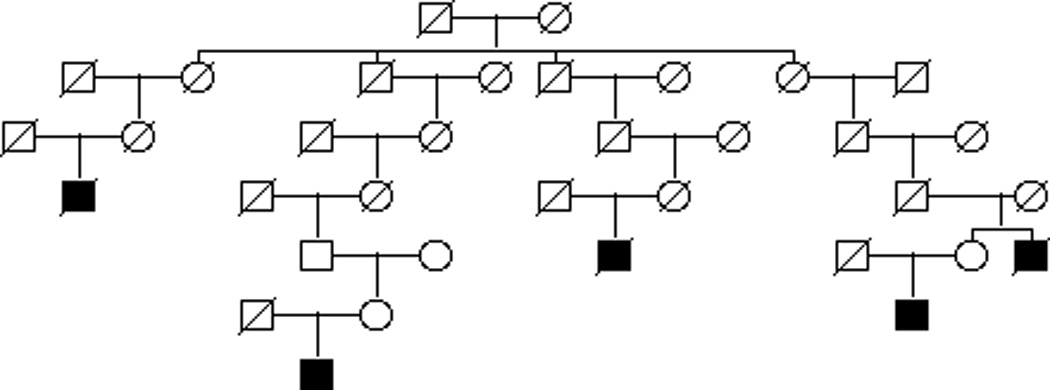
The founding couple at the top of the pedigree has nearly 10,000 descendants and the pedigree is trimmed to only represent linear descent of the SI-NET cases. Only 0.78 SI-NETs would be expected in this large pedigree, however 5 are observed (p=1.4e−4) Circles represent females, squares represent males. A slash indicates deceased. SI-NETs are represented as shaded squares.
Discussion
The existence of a Utah resource combining up to 15 generations of genealogy with statewide cancer data from 1966 has allowed testing the hypothesis of a heritable contribution to SI-NET. The methods used in this study have previously provided evidence for a heritable component to many different cancer types (Teerlink et al. 2012) (Albright et al. 2012). The Utah data analyzed represents a homogeneous population that has been shown to be genetically representative of Northern Europe, with normal (low) inbreeding levels (McLellan et al. 1984) (Jorde and Morgan 1987) (Jorde 1989).
Evidence for excess relatedness for SI-NET cases was observed for both close and distant relationships. Using the RR approach, there were significantly more affected first-, second-, and third-degree relatives of probands than expected when compared to the population rates; as is typical for RR estimates, more distant relationships were not considered. The GIF analysis, which does not utilize population rates of disease, but rather considers relatedness between all possible pairs of cases compared to the relatedness of similar individuals in the UPDB, also identified significant excess pairwise relatedness of SI-NETs; more distant relationships are considered in the GIF pairwise approach and an excess was observed. No SI-NETs were observed among the spouses of the cases suggesting no late environmental effects. The results of this study provide additional support to the observation that the co-occurrence in siblings is nearly twice that of parent-offspring (Amin et al. 2012; Kharazmi et al. 2013) suggestive of a strong genetic and environmental interaction.
Metachronous cancers were also observed in 100 (26%) of the 384 SI-NET cases. This observation is similar to national SEER data of 8,331 patients with SI-NETs diagnosed between 1973 and 2007 whereby 2,424 (29%) had another primary malignancy at some time (Amin et al. 2012). Most of the common metachronous cancers observed in Utah were also reported in the SEER data; the exception being lung cancer, which might be explained by the well-documented low smoking rates in the Utah population (Merrill et al. 2003). Only 2% of the Utah cases had lung cancer while 6.3% of the SEER cases had lung cancer. Of the cancers associated with increased risk in SI-NET cases, colon, renal and prostate cancers are reported in other populations (Amin et al. 2012; Kharazmi et al. 2013). The 2-fold increase in relative risk of melanoma appears unique to the Utah population. This is not unexpected since Utah has the highest rate of melanoma in the United States (United States Cancer Statistics 2011) allowing for detection of association with SI-NET.
The UPDB represents a unique resource, one of very few in the world, that can be used to study a large population of related individuals linked to cancer information that does not rely on self-reported cancer histories. As with any large population data resource, limitations exist with regard to the scope of the data. Approximately 70% of individuals diagnosed with cancer in Utah link to UPDB genealogies, however those cancers that do not link to genealogies or are diagnosed before 1966 are excluded from the analysis. Additionally, the potential exists for some pedigree relationship data inaccuracies, for example, relationships like adoptions may be represented as biologic children. However, such misrepresentation or censoring would be expected to be present in both case and control relationships and would be expected to lead to conservative estimates or tests rather than bias.
In conclusion, we have demonstrated a significant familial risk of SI-NETs extending well beyond first-degree relatives. First, second and third-degree relatives of SI-NET cases are at an elevated risk of co-occurrence and although this cancer is rare, heightened awareness in families is important. Because SI-NETs are often diagnosed at advanced stages when prognosis is dramatically diminished, understanding familial risk, and eventually the responsible genetic risk variants is an important tool for prevention (Kulke and Mayer 1999). The cohort of large multi-generation high-risk SI-NET families identified through UPDB are a valuable resource for future genetic studies.
Acknowledgments
Funding: Research reported in this publication was supported by the National Cancer Institute grants P01-CA073992, R01-CA164138, and Cancer Center Support Grant P30-CA42014. Partial support for all data sets within the Utah Population Database (UPDB) was provided by Huntsman Cancer Institute, Huntsman Cancer Foundation and University of Utah. Research was supported by the Utah Cancer Registry, which is funded by Contract No. HHSN2612013000171 from the National Cancer Institute's SEER Program with additional support from the Utah State Department of Health and the University of Utah. The content is solely the responsibility of the authors and does not necessarily represent the official views of the NIH.
Footnotes
Declaration of interest: There is no conflict of interest that could be perceived as prejudicing the impartiality of the research reported.
References
- Albright F, Teerlink C, Werner TL, Cannon-Albright LA. Significant evidence for a heritable contribution to cancer predisposition: a review of cancer familiality by site. BMC Cancer. 2012;12:138. doi: 10.1186/1471-2407-12-138. [DOI] [PMC free article] [PubMed] [Google Scholar]
- Amin S, Warner RR, Itzkowitz SH, Kim MK. The risk of metachronous cancers in patients with small-intestinal carcinoid tumors: a US population-based study. Endocr Relat Cancer. 2012;19:381–387. doi: 10.1530/ERC-11-0392. [DOI] [PubMed] [Google Scholar]
- Bean LL, May DL, Skolnick M. The Mormon historical demography project. Hist Methods. 1978;11:45–53. doi: 10.1080/01615440.1978.9955216. [DOI] [PubMed] [Google Scholar]
- DiSario JA, Burt RW, Vargas H, McWhorter WP. Small bowel cancer: epidemiological and clinical characteristics from a population-based registry. Am J Gastroenterol. 1994;89:699–701. [PubMed] [Google Scholar]
- Francis JM, Kiezun A, Ramos AH, Serra S, Pedamallu CS, Qian ZR, Banck MS, Kanwar R, Kulkarni AA, Karpathakis A, et al. Somatic mutation of CDKN1B in small intestine neuroendocrine tumors. Nat Genet. 2013;45:1483–1486. doi: 10.1038/ng.2821. [DOI] [PMC free article] [PubMed] [Google Scholar]
- Hemminki K, Li X. Familial carcinoid tumors and subsequent cancers: a nation-wide epidemiologic study from Sweden. Int J Cancer. 2001;94:444–448. doi: 10.1002/ijc.1473. [DOI] [PubMed] [Google Scholar]
- Hiripi E, Bermejo JL, Sundquist J, Hemminki K. Familial gastrointestinal carcinoid tumours and associated cancers. Ann Oncol. 2009;20:950–954. doi: 10.1093/annonc/mdn706. [DOI] [PubMed] [Google Scholar]
- Jorde LB. Inbreeding in the Utah Mormons: an evaluation of estimates based on pedigrees, isonymy, and migration matrices. Ann Hum Genet. 1989;53:339–355. doi: 10.1111/j.1469-1809.1989.tb01803.x. [DOI] [PubMed] [Google Scholar]
- Jorde LB, Morgan K. Genetic structure of the Utah Mormons: isonymy analysis. Am J Phys Anthropol. 1987;72:403–412. doi: 10.1002/ajpa.1330720313. [DOI] [PubMed] [Google Scholar]
- Kharazmi E, Pukkala E, Sundquist K, Hemminki K. Familial risk of small intestinal carcinoid and adenocarcinoma. Clin Gastroenterol Hepatol. 2013;11:944–949. doi: 10.1016/j.cgh.2013.02.025. [DOI] [PubMed] [Google Scholar]
- Kulke MH, Mayer RJ. Carcinoid tumors. N Engl J Med. 1999;340:858–868. doi: 10.1056/NEJM199903183401107. [DOI] [PubMed] [Google Scholar]
- Lao O, Lu TT, Nothnagel M, Junge O, Freitag-Wolf S, Caliebe A, Balascakova M, Bertranpetit J, Bindoff LA, Comas D, et al. Correlation between genetic and geographic structure in Europe. Curr Biol. 2008;18:1241–1248. doi: 10.1016/j.cub.2008.07.049. [DOI] [PubMed] [Google Scholar]
- McLellan T, Jorde LB, Skolnick MH. Genetic distances between the Utah Mormons and related populations. Am J Hum Genet. 1984;36:836–857. [PMC free article] [PubMed] [Google Scholar]
- Merrill RM, Hilton SC, Daniels M. Impact of the LDS church's health doctrine on deaths from diseases and conditions associated with cigarette smoking. Ann Epidemiol. 2003;13:704–711. doi: 10.1016/s1047-2797(03)00063-2. [DOI] [PubMed] [Google Scholar]
- Modlin IM, Lye KD, Kidd M. A 5-decade analysis of 13,715 carcinoid tumors. Cancer. 2003;97:934–959. doi: 10.1002/cncr.11105. [DOI] [PubMed] [Google Scholar]
- Neugut AI, Jacobson JS, Suh S, Mukherjee R, Arber N. The epidemiology of cancer of the small bowel. Cancer Epidemiol Biomarkers Prev. 1998;7:243–251. [PubMed] [Google Scholar]
- Sei Y, Zhao X, Forbes J, Szymczak S, Li Q, Trivedi A, Voellinger M, Joy G, Feng J, Whatley M, et al. A Hereditary Form of Small Intestinal Carcinoid Associated with a Germline Mutation in Inositol Polyphosphate Multikinase. Gastroenterology. 2015 doi: 10.1053/j.gastro.2015.04.008. [DOI] [PMC free article] [PubMed] [Google Scholar]
- Skolnick M. The Utah genealogical database: A resource for genetic epidemiology. In: Cairns JL, Skolnick M, editors. Banbury Report No 4; Cancer Incidence in Defined Populations. New York: Cold Spring Harbor; 1980. pp. 285–297. [Google Scholar]
- Teerlink CC, Albright FS, Lins L, Cannon-Albright LA. A comprehensive survey of cancer risks in extended families. Genet Med. 2012;14:107–114. doi: 10.1038/gim.2011.2. [DOI] [PubMed] [Google Scholar]
- Yao JC, Hassan M, Phan A, Dagohoy C, Leary C, Mares JE, Abdalla EK, Fleming JB, Vauthey JN, Rashid A, et al. One hundred years after "carcinoid": epidemiology of and prognostic factors for neuroendocrine tumors in 35,825 cases in the United States. J Clin Oncol. 2008;26:3063–3072. doi: 10.1200/JCO.2007.15.4377. [DOI] [PubMed] [Google Scholar]
- Zikusoka MN, Kidd M, Eick G, Latich I, Modlin IM. The molecular genetics of gastroenteropancreatic neuroendocrine tumors. Cancer. 2005;104:2292–2309. doi: 10.1002/cncr.21451. [DOI] [PubMed] [Google Scholar]