

Abstract
The role of CD8+ T cells in HIV control in the brain and the consequences of such control are unclear. Approximately 3% of peripheral CD8+ T cells dimly express CD4 on their surface. This population is known as CD4dimCD8bright T cells. We evaluated the role of CD4dimCD8bright and CD8 single positive T cells in HIV infected brain using NOD/SCID/IL-2rcγ−/− mice reconstituted with human Peripheral Blood Mononuclear Cells (PBMCs) (NSG-huPBMC). All three T cell populations (CD4 single positive, CD8 single positive, and CD4dimCD8bright) were found in NSG-huPBMC mice brain within 2 weeks of-infection. Wnts secreted from astrocytes induced CD4dimCD8bright T cells by 2-fold in vitro. Injection of highly purified CD8 single positive T cells into mouse brain induced CD4dimCD8bright T cells by 10-fold, which were proliferative and exhibited a terminally differentiated effector memory phenotype. Brain CD4dimCD8bright T cells from HIV infected mice exhibited anti-HIV specific responses, as demonstrated by induction of CD107ab post exposure to HIV-peptide loaded targets. Further, higher frequency of CD4dimCD8bright T cells (R= −0.62;p≤0.001), but not CD8 single positive T cells (R= −0.24;p≤0.27), negatively correlated with HIV-gag mRNA transcripts in HIV infected NSG-huPBMC brain. Together, these studies indicate that single positive CD8+ T cells entering the CNS during HIV infection can give rise to CD4dimCD8bright T cells, likely through a Wnt signaling-dependent manner, and that these cells are associated with potent anti-HIV control in the CNS. Thus, CD4dimCD8bright T cells are capable of HIV control in the CNS and may offer protection against HIV-Associated Neurocognitive Disorders.
Introduction
The brain is not an immune privileged site. Lymphocytes survey the brain and in the context of inflammation and/or infection, they home to the brain in greater numbers (1). In HIV infection, CD8+ T cells home to the brain, as demonstrated in human post-mortem HIV infected brains and in the brains of Simian Immunodeficiency Virus (SIV) infected macaques (2–12). The consequence of CD8+ T cell-mediated anti-HIV responses in the brain is unclear. On one hand, CD8+ T cells control HIV infection in the brain (4, 6, 11), while heightened anti-HIV responses are likely to lead to neuronal injury.
Prior to entering the brain, CD8+ T cells differentiate from naïve cells to effector and eventually effector memory, central memory, or terminal effector memory cells (13). Considerable data from our laboratory (14–18) and others (19–26) described a unique subset of highly activated mature CD8+ T cells, which dimly express CD4 on their surface. This population, known as CD4dimCD8bright T cells, constitutes approximately 3–5% of total CD8+ T cells and 1–3% of all peripheral blood lymphocytes (24, 25). These CD4dimCD8bright T cells are not pre-maturely released thymocytes, as they are negative for the thymocyte marker CD1a (18). They have an αβ T cell receptor (TCR) and an αβ CD8 molecule (17). They are negative for CD16, CD56, and 6B11 and therefore are not natural killer T (NKT) cells (14). Further, we have shown that CD4dimCD8bright T cells are highly enriched in anti-viral responses to both HIV and CMV (15). CD4dimCD8bright T cells constitute approximately 60% of the anti-HIV tetramer responses (15) and are polyfunctional, as determined by co-expression of IL-2, IFNγ, TNFα, or surface expression of CD107ab in peripheral blood in response to pooled HIV peptides (15).
β-catenin, the central mediator of the Wnt/β-catenin pathway, mediates CD4 expression on the surface of mature CD8+ T cells (18). The brain and especially astrocytes, which comprise 40–60% of the brain resident cells, are a rich source for Wnt ligands (27). Wnt ligands are small secreted evolutionarily conserved glycoproteins, some of which mediate a signal transduction cascade that culminates in stabilization of β-catenin and consequently its association with members of the T cell factor (TCF)/ Lymphoid Enhancer-binding Factor (LEF) transcription factors and binding to target genes to regulate gene expression (18). Further, Wnts promote communication between cells leading to many cellular processes including development, proliferation, survival, regeneration, wound healing and stress (28–30).
In recognition of robust secretion of Wnts in the brain, we investigated their role in the generation of the CD4dimCD8bright T cell phenotype in the CNS and compared the role of CD8 single positive (CD4negativeCD8bright) vs. CD4dimCD8bright T cells in HIV control in the brain. We used NOD/SCID/IL-2rcγ−/− mice reconstituted with human PBMCs (NSG-huPBMC) to conduct these studies. We show that all three populations are present in the brain and that both CD4 single positive T cells (e.g. CD4brightCD8negative) and CD4dimCD8bright T cells are HIV infected in the CNS. The Wnt-rich environment in the CNS induces CD8 single positive T cells to become CD4dimCD8bright T cells both in vitro and in vivo. Most importantly, we show that it is CD4dimCD8bright T cells, not CD8 single positive T cells; that control HIV in the brain. Brain CD4dimCD8bright T cells of HIV infected NSG-huPMBC mice are cytotoxic and are terminally differentiated but not senescent in comparison to uninfected mice. These findings point to a significant role of CD4dimCD8bright T cells in HIV control in the CNS and demonstrate that the brain microenvironment is capable of altering CD8+ T cell phenotype to generate a potent anti-viral CD8+ T cell subset.
Materials and Methods
Ethics Statement
Research involving human subjects was conducted in accordance with institutional (IRB-L06080703) and U.S. government guidelines on human research.
Mice
NOD/SCID/IL-2rcγ−/− and NOD.Cg-PrkdcscidIL2rγtm1Wjl/SzJ, (NSG) mice were purchased from The Jackson Laboratories (Bar Harbor, ME; stock number 005557) and housed under pathogen-free conditions in accordance with the Institutional Animal Care and Use Committee (IACUC #14-014) at Rush University Medical Center and the ethical guidelines for care of laboratory animals at the National Institutes of Health.
Culture and Activation of Peripheral Blood Mononuclear cells (PBMCs) and CD8+ T cells
PBMCs were isolated from 12 healthy seronegative donors by Ficoll-Hypaque Density gradient centrifugation. CD8+ T cells were isolated using the untouched CD8+ T Cell Isolation Kit II according to manufacturer’s instructions (Miltenyi Biotec, Cambridge, MA). CD8+ T cells were suspended in complete RPMI 1640 media (cRPMI; Lonza BioWhittaker, Walkersville, MD) which includes 10% heat-inactivated FBS (Gemini Bio Products, Calabasas, CA), and 1% penicillin/streptomycin (Sigma, St. Louis, MO). Cultures were stimulated with 20U/mL IL-2 (AIDS Reagent Program, Germantown, MD) and, when indicated, 1µg/mL soluble α-CD3/ α-CD28 antibodies (BD Biosciences, San Jose, CA) and maintained for 24 hours-6 days, as indicated.
Reconstitution of NSG Mice with human PBMCs and infection with HIVBaL
PBMCs were isolated by density gradient centrifugation from human donor venous blood. Six to eight week old NSG mice were injected with 2×10⁷ human PBMCs by intraperitoneal injection (i.p.). One to two weeks after reconstitution, mice were bled by retrorbital perfusion and extent of reconstitution was determined by flow cytometry. Reconstituted mice were infected with 104TCID50/mouse of HIVBaL i.p.
Measurement of viremia in HIV infected mice
At two weeks post-infection, mice were anesthetized by isoflurane inhalation and bled retrorbitally using EDTA coated glass pipettes. One week later, at three weeks post-infection, mice were again anesthetized by isoflurane inhalation and 300µl of blood was removed from mice by cardiac puncture. The mice were then perfused with 30–50mLs of ice cold PBS for dissection of other organs. Blood was collected into microcentrifuge tubes with 15µl of EDTA. Blood was spun at 12000 RPM for 15 minutes and serum was collected. Viral copy number in the blood of HIV infected animals was determined using Taqman (Life Technologies, Carlsbad, CA) based real-time PCR. For RNA extraction from blood serum, 100µl of serum was processed in a QIAAmp viral RNA Mini Kit (Qiagen, Valencia, CA) according to manufacturer’s instructions. Sample was then reversed transcribed using Qscript RT Master Mix (Quanta Biosciences Inc., Gaithersburg, MD) and used to amplify viral RNA via real-time PCR. To generate a standard curve, a 500bp gBlock Gene Fragment encompassing GAG region and representing unspliced HIV RNA was synthesized by IDTDNA (Integrated DNA Technologies, Coralville, IA). The fragment was suspended in sterile TE buffer (Life Technologies, Carlsbad, CA) at dilutions ranging from 50-1×10⁶ copies per µl. Copy number was calculated using the DNA copy number web tool at Thermo Scienctific (Thermo Fisher Scientific, Waltham, MA) and converted to RNA copy number by multiplying by two. The dilutions were aliquoted and stored at −80°C. The primers and probe were designed using the PrimerQuest tool at IDTDNA (Integrated DNA Technologies, Coralville, IA). The sequence of the primers: F-CCCAGAAGTGATACCCATGTT, R-GCTTCCTCATTGATGGTCTCT and the probe; 5’/56-FAM/ATTTGCATG/ZEN/GCTGCTTGATGTCCC/3IABkFQ/-3’. Real-time PCR reactions were performed in a 20µl solution containing 10µl of Taqman Gene Expression Master Mix (Life Technologies, Carlsbad, CA), 900nm primers and 500nm probe and 7.5µl of cDNA sample or standard. Cycling proceeded in an Applied Biosystems 7900HT sequence detection system (Thermo Fisher Scientific, Waltham, MA) using SDS2.3 software, under following parameters: 50°C for 2 minutes, 95°C for 10 minutes, followed by 55 cycles of 95°C for 15 seconds and 60°C for 1 minute. Samples were run in duplicates and standards were included with each run. Lower limit of signal detection for standard was 40 copies/reaction and for sample was 2000 copies/ml.
Isolation of lymphocytes from the brain and spleen
Mice were anesthetized by inhalation of isoflurane then perfused with 30–50 mL of ice cold PBS through the left ventricle. Brains were collected and minced with scissors before treatment with Liberase TL (Roche, Indianapolis, IN) and DNAse I (Invitrogen, Carlsbad, CA) at 37° C on a tube rotator (Miltenyi Biotec, Cambridge, MA) for 30 minutes. Samples were pushed through 100µM Nytex Cell Strainers (BD Biosciences, San Jose, CA) to yield a single cell suspension. Mononuclear cells were isolated using a 30%/70% Percoll gradient (Amersham, Piscataway, NJ) centrifuged at 2500×g for 20 min at room temperature without break. Cells were counted using Tryphan Blue exclusion (Life Technologies Invitrogen, Carlsbad, CA). Spleens were collected from mice at time of perfusion. Spleens were mashed and red blood cells were lysed using NH4Cl to obtain a single cell suspension of spleen infiltrating lymphocytes.
CD107ab cytotoxic potential assay
NSG mice were reconstituted as described above with 2×10⁷ PBMCs from a single donor. Two weeks later, PBMCs were isolated from the same donor and T cells were depleted by magnetic separation using CD3 microbeads according to manufacturer’s instructions (Miltenyi Biotec, Cambridge, MA). T cell depleted PBMCs were then cultured overnight at 37°C without peptide or with 40µg/mL of CMVpp65 (HLA-A2: NLVPMVATV) or 2µg/peptide/mL of HIV pooled peptides for Gag, Nef, Pol, and Env (AIDS Regent Program, Germantown, MD) in complete DMEM with 8µg/ ml of β2-microglobulin (Sigma-Aldrich, St. Louis, MO) to load target cells. Peptide loading on target cells was confirmed by upregulation of HLA-ABC as determined by flow ctyometry. The following day, total lymphocytes isolated from HIV infected mouse brain were co-cultured with target cells without peptide or loaded with CMVpp65 Irrelevant peptide or HIV pooled peptides in the presence of antibodies for CD107a-FITC and CD107b-FITC (BD Biosciences, San Jose, CA). At one hour of co-culture, BD Golgi Stop and BD Golgi Plug (BD Biosciences, San Jose CA) were added to eliminate internalization/ degradation of CD107ab. The culture was incubated for an additional 5 hours at 37°C. Cells were then were stained with LIVE/DEAD Fixable Violet Dead Cell Stain (Life Technologies Invitrogen, Carlsbad, CA) according to manufacturer’s instructions. After washing, the cells were stained for HLA-ABC-PE-Cy7, CD3 APC-H7, CD4-PE, and CD8-PERCP-Cy5.5 (BD Biosciences, San Jose, CA). CD3 was used to distinguish target cells from brain isolated T cells. Data was acquired on an LSR II flow cytometer (BD Biosciences, San Jose, CA) with BD FACSDiva software (BD Biosciences, San Jose, CA) and analyzed using FlowJo Software (Treestar Inc, Ashland, OR).
Intracranial injection of CD8+ T cells and PBMCs
PBMCs were isolated from venous blood of healthy donors as described above. CD8+ T cells were isolated from PBMCs prior to cell culture by untouched CD8+ T cell Isolation Kit II according to manufacturer’s instructions (Miltenyi Biotec, Cambridge, MA). CD8+ T cells were then cultured overnight in cRPMI. Cells were then stained with BD Horizon Violet Proliferation Dye, CD8-Percp-Cy5.5, and CD4-PE (BD Biosciences, San Jose, CA) according to manufacturer’s instructions. Cells were run on an LSR II Flow Cytometer to establish baseline proliferation stain, purity of CD8+ T cells in CD8 isolated cultures, and expression of CD4 on CD8+ T cells. Cells were re-suspended to 3×10⁶ cells/ 10µl in sterile PBS. 10µl Hamilton syringes with 32µg needles (Hamilton Co., Reno, Nevada) were autoclaved and cleaned with 70% ethanol and sterile PBS prior to surgery. Mice were anesthetized with 100mg/kg Ketamine and 20mg/kg Xylazine and placed in a stereotaxic frame. A scalp midline incision was made and burr hole was drilled through the skull of the left hemisphere at 0.22mm posterior to bregma, 0.85mm lateral to midline, and 2.35mm ventral to the skull. Using a motorized injection pump (Stoelting, Wood Dale, Illinois, USA) CD8+ T cells or PBS was injected directly into the ventricle at a rate of 1µl/min. The needle was left in place for two minutes after all volume was pushed into the brain before removal from the brain. Six days later brains were processed as described above to isolate injected cells for flow cytometry.
Flow Cytometric Analysis
Single cell suspensions of cells isolated from mouse brain, spleen, or PBMCs from venous blood were stained with LIVE/DEAD Fixable Violet Dead Cell Stain (Life Technologies Invitrogen, Carlsbad, CA) according to manufacturer’s instructions. Cells were washed with PBS and stained with CD3-APC-H7, CD4-PE or CD4-APC, and CD8-PERCP-Cy5.5, CCR7-PE, CD27-FITC, CD28-Alex Fluor 700, CD57- PE-Cy7 and/or CD45RA-PE-Cy7 (BD Biosciences, San Jose, CA) for extracellular stains. For intracellular detection of HIV-1 Core Antigen p24 cells were fixed and permeabillized utilizing BD Cytofix/Cytoperm Solution Kit (BD Biosciences, San Jose, CA) according to manufacturer’s instructions before staining with 1µl/ sample of HIV-1 core antigen –RD-1 (Beckmann Coulter, Pasadena, CA). When cell number was limiting, a minimum of 5×10³ live gated events were collected in each sample and analyzed to maintain cell number between samples for comparison of different T cell populations. Data was collected on an LSR II Flow Cytometer with BD FACSDiva software (BD Biosciences, San Jose, CA) and analyzed using FlowJo Software (Treestar Inc, Ashland, OR).
Human Progenitor-Derived Astrocytes (PDAs)
PDAs, provided by Dr. Eugene O. Major (National Institute of Neurological Disorders and Stroke, Bethesda, MD) were generated from neural progenitor cells, as previously described (31). Briefly, progenitors were seeded on poly-D-lysine coated (PDL) T 75 culture flasks at 2×10⁶ cells/flask and maintained in progenitor medium consisting of neurobasal media (Life Technologies Invitrogen, Carlsbad,CA), 25ng/mL fibroblast growth factor, 20ng/mL epidermal growth factor (R&D Systems, Minneapolis, MN), 50µg/mL gentamycin (Lonza BioWhittaker, Walkersville, MD) and 2mM L-glutamine (Life Technologies, Invitrogen, Carlsbad, CA). To induce differentiation, progenitor medium was replaced with PDA medium containing DMEM (Life Technologies Invitrogen, Carlsbad, CA) supplemented with 10% heat inactivated FBS (Sigma, St. Louis, MO), 2mM L-glutamine, and 50µg/mL gentamycin. Cultures were GFAP, glutamine synthetase, and Excitatory Amino Acid Transporter-2 (EAAT2) positive and nestin negative after 30 days of differentiation making them comparable to commercially available primary fetal astrocytes (31). After differentiation PDAs were maintained in PDA medium on PDL-coated plates, as described above. Media was changed every three days and cells were split when they reached 80–90% confluency. Astrocyte Conditioned Media (ACM) was harvested from three- day cultured PDAs. All ACM used in transfer experiments was taken from PDAs cultured in complete 10% heat-inactivated FBS containing DMEM.
Depletion of Wnt ligands from ACM
Wnts were depleted from ACM as described (32). Briefly, Pierce Protein A/G magnetic beads (Life Technologies Invitrogen, Carlsbad, CA) were washed two times for 1 hour at 4°C with 1XGE Binding Washing Buffer (GE Life Sciences, Pittsburgh, PA). The beads were then coated with 4µg of anti-rabbit Wnt1, Wnt2b, Wnt3, Wnt5b, Wnt10b, or rabbit IgG1 isotype control overnight (Abcam, Cambridge, MA). One mL of ACM was then applied to the beads and incubated overnight at 4°C with continuous rotation at 30 rpm. The supernatant was then collected by separation of magnetic beads under a magnetic field and depletion of Wnt(s) was confirmed by western blot of supernatant as previously shown (32).
Real time reverse transcriptase (rt)-PCR measurement of HIV and Wnts transcripts
Uninfected and HIV-infected NSG-huPBMC mice were anesthetized by isoflurane inhalation and perfused with 30–50mLs of ice cold PBS. Half of the brain was placed in Trizol (Life Technologies Invitrogen, Carlsbad, CA) in Lysing Matrix D tubes (MP Biomedicals, Santa Ana, CA). Brain was homogenized using FASTPrep-24 tissue homogenizer (MP Biomedicals, Santa Ana, CA) for 5 minutes with 1 minute rest at 2400rpm repeated three times. Trizol/Chloroform (Invitrogen Life Technologies, Carlsbad, CA) was then used to isolate mRNA from brain tissue. A260/280 was used to measure RNA concentration and 1µg of total RNA was used for downstream applications. DNA contamination was removed by DNAse I (Sigma, St. Louis, MO) treatment at room temperature for 15 minutes followed by denaturation of DNAse 1 at 70°C for 10 minutes. cDNA synthesis was performed using qScript cDNA supermix (Qiagen, Valencia, CA) according to manufacturer’s instructions. cDNA was diluted so that 1/20 of the original volume was used to perform real time-PCR using SsoFast eva green supermix with low Rox kit (Bio-Rad, Hercules, CA) and ROX Passive Reference Dye (Bio-Rad, Hercules, CA) in an ABI 7500 Fast Real Time PCR System using 7500 software V2.01. The PCR conditions were stage 1: 95°C for 20 seconds, stage 2: 95°C for 5 second, 60°for 30 seconds, and one dissociation stage which was at 95°for 15 seconds. This was performed for 45 cycles. Melting curve analysis was conducted to ensure single and specific product amplification. The following primers were used to: Gag: Forward 5’-AGAGAAGGCTTTCAGCCCAGAAGT-3’ Reverse 5’-TGCACTGGATGCACTCTATCCCAT-3; GapDH: Forward 5’-TGACTTCAACAGCGACACCCACT-3’ and Reverse 5’-ACCACCCTGTTGCTGTAGCCAAAT-3’. Fold change in mRNA expression was calculated by using the comparative CT method with GAPDH as endogenous control. A CT off value of 35 was used to determine if mRNA was expressed in tissue. For HIV fold change, all samples were first normalized to GAPDH then further normalized to the sample with the lowest detectable HIV thereby giving that sample an arbitrary value of 1 with the other higher 27 samples compared to that sample.
Transfection with TOPflash and dual luciferase assay
To measure β-catenin-dependent signaling activity, 5 ×10⁶ PBMCs cells cultured in cRPMI or cRPMI and ACM or cRPMI and Wnt-depleted ACM were transfected with 10µg TOPflash reporter construct (Millipore, Billerica, MA) or FOPflash using the Amaxa nucleofection protocol (Amaxa, Gaithersburg, MD), as recommended by the manufacturer. Three days later, construct reporter activity was performed using a dual-luciferase reporter assay using 10 to 20 µl of lysate (Promega, Madison, WI). The total protein concentration was measured using a Pierce BCA Protein Assay Kit (Thermo Scientific, Waltham, MA).
Statistical Analysis
When the data was distributed normally, ANOVA and post-hoc tests were used. When the data was not normally distributed, nonparametric analysis was performed. All tests assumed a two-sided significance level of 0.05 using GraphPad Instat 3 Software (San Diego, CA) for data analysis. Pearson correlation coefficients were determined using SAS analysis (SAS Institute, Cary, NC).
Results
Increased frequencies of CD8 single positive and CD4dimCD8bright T cells in the brains of HIV- infected NOD/SCID/IL-2rcγ−/− mice reconstituted with human PBMCs (NSG-huPBMC) in comparison to uninfected NSG-huPBMC mice
We evaluated the brains of uninfected and HIV- infected NSG-huPBMCs for CD8 single positive (CD4−CD8bright), CD4 single positive (CD4brightCD8−), and CD4dimCD8bright T cells. NSG mice were reconstituted with human PBMCs and at 2 weeks post-reconstitution; the mice were left uninfected or infected with HIVBaL by IP injection. Blood viremia was measured pre-infection (negative control), at two and three weeks post-infection (Fig. 1A). HIV infected mice had 2,063 HIV RNA copies/mL at two weeks post-infection and 67,400 HIV RNA copies/mL at three weeks post-infection. These data are consistent with previously published work (33–34). Two and three weeks post-HIV infection, the brains were harvested and T cells isolated by percoll gradient centrifugation. Total number of lymphocytes isolated from HIV-infected brains was three and two-folds higher in comparison to uninfected brains, at two and three weeks post-infection, respectively (Fig.1B). CD4 single positive, CD8 single positive, and CD4dimCD8bright T cells were detected in both uninfected and HIV-infected brains (Fig. 1C–F). Flow cytometry gating strategy is shown in (Supplementary Figure 1). HIV predominately infects CD4+ T cells and leads to their rapid depletion. We demonstrate that this also occurs in HIV infected CD4+ T cells that infiltrate the brain. At two weeks post infection, percent of CD4 single positive, CD8 single positive, and CD4dimCD8bright T cells in the brain were comparable between HIV uninfected and infected mice (Fig. 1C–E) Specifically, for CD4 single positive 25% vs. 17%; for CD8 single positive 55% vs 40%, and for CD4dimCD8bright T cells 8% vs. 12% of CD3+ T cells between uninfected and HIV infected mice, respectively. At three weeks post-infection, however, a dramatic depletion of CD4 single positive T cells (35% vs. 3.3%) (Fig. 1C) and increase in frequency of CD8 single positive T cells (37% vs. 56%) (Fig. 1D) in the brain of HIV- infected mice was observed. CD4 single positive T cells were depleted by 90% and CD8 single positive T cells were increased by 68% in brains of HIV infected mice in comparison to uninfected mice (Fig. 2B and data not shown). These findings are consistent with clinical data and data from the SIV- macaque model demonstrating expansion and activation of CD8+ T cells in the brain during acute infection (2–5, 10,12). The frequency of CD4dimCD8bright T cells was also altered at three weeks post infection. CD4dimCD8bright T cells decreased from approximately 13% of CD3+ T cells to approximately 2% of CD3+ T cells in HIV infected mouse brains (Fig. 1E), a loss of approximately 75% (Fig. 2B). These data indicate that T cells (CD4 single positive, CD8 single positive, and CD4dimCD8bright) infiltrate the brain and that the HIV susceptible target cells (e.g. CD4 single positive and CD4dimCD8bright T cells) are depleted post-infection. Current paradigm indicates that non-productively infected monocytes and perivascular macrophages are the “Trojan Horses” of HIV, allowing for its entry into the CNS. Our findings here indicate that CD4+ T cells can also infiltrate the brain and undergo depletion. CD8+ T cells are expanded in the CNS, which can contribute to heightened inflammatory responses in the CNS and neuronal injury.
Figure 1. CD4dimCD8bright T cells are found in the brain of NSG-huPBMCs Mice.

NSG mice were reconstituted with 2×10⁷ PBMCs isolated from healthy human donors and infected with 104 TCID50 HIVBAL. At two and three weeks post-infection, serum was collected and HIV RNA copies/mL was measured by real-time PCR (A). The total number of lymphocytes isolated from the brain of uninfected and HIV infected mice at two and three weeks post-infection was determined by cell counting using tryphan blue exclusion (B). Brain isolated lymphocytes were analyzed by flow cytometry. CD4 single positive (C), CD8 single positive (D), and CD4dimCD8bright (E) T cells populations were identified in the brain of uninfected mice and HIV-infected mice at two and three weeks post-infection and are shown in a representative flow plot (F). n=8 mice per group, *p≤0.05 between uninfected and infected animals using student’s t test.
Figure 2. Both CD4 single positive and CD4dimCD8bright T cells are HIV infected and CD4dimCD8bright T cells survive better while CD4 single positive T cells are depleted.

HIV-infected mice were sacrificed at two and three weeks post-infection and brain infiltrating CD4 single positive and CD4dimCD8bright T cells were isolated for flow cytometry and stained for intracellular HIVp24 Core Antigen. Differences between groups were not statistically significant (A). Percent of CD4 single positive and CD4dimCD8bright T cells from uninfected and HIV- infected mice were compared at two and three weeks post-infection to determine the percent of each population lost in HIV- infected mice relative to uninfected mice (B). n=8 mice per group, * p≤0.05 between CD4 single positive and CD4dimCD8bright T cells using student’s t test.
HIV infection of CD4 single positive and CD4dimCD8bright T cells in the brain
Expression of CD4 on CD8+ T cells renders them permissive to HIV infection (16, 20). Within the CNS, extent of HIV infection between CD4 single positive (6%) and CD4dimCD8bright T cells (3%) at two weeks post infection is comparable, as determined by measuring intracellular HIVp24 expression (Fig. 2A). Although statistically insignificant, at three weeks post infection, there was a trend towards a higher percentage of infected CD4 single positive cells in comparison to CD4dimCD8bright T cells (1% of CD4 single positive T cells vs. 4% of CD4dimCD8bright T cells expressed HIVp24; p≤0.07) (Fig. 2A), which may be due to differential loss of CD4 single positive in comparison to CD4dimCD8bright T cells. We compared the percent of CD4 single positive and CD4dimCD8bright T cells in the brain of uninfected NSG-huPBMC mice and HIV-infected NSG-huPBMC mice. At two weeks post-infection, approximately 60% of CD4 single positive T cells were lost compared to only 20% of CD4dimCD8bright T cells. Further, at three weeks post-infection, greater than 90% of CD4 single positive T cells were lost compared to 75% of CD4dimCD8bright T cells (Fig. 2B). These data indicate that, although both CD4 single positive and CD4dimCD8bright T cells found in the CNS are HIV-infected, CD4 single positive T cells are lost at an earlier time point than CD4dimCD8bright T cells. Reduction of T cell numbers in the brain may be due to trafficking of cells out of the brain, HIV-dependent death, HIV- independent death, or loss of CD4 expression as HIV infection results in down regulation of CD4 on the cell surface. Furher, this finding suggests that CD4dimCD8bright T cells may constitute a novel reservoir for HIV in the CNS, independent of resident brain cells (microglia, perivascular macrophages, and astrocytes).
CD4dimCD8bright T cells are inversely associated with HIV gag transcript in the brain
Peripheral CD4dimCD8bright T cells exhibit enhanced anti-HIV responses compared to CD8 single positive T cells. They constitute greater than 60% of the CD8+ tetramer-positive response against HIV and are polyfunctional (15). To determine the association between CD4dimCD8bright T cells and HIV control in the CNS, we harvested brains from HIV-infected NSG-huPBMC mice at three weeks post infection. One hemisphere was used to measure HIV gag by qRT-PCR and the other to isolate infiltrating lymphocytes. We show that while the percent of CD8 single positive T cells was not associated with change in HIV gag mRNA expression (R= −0.24; p<0.27; Fig. 3A), percent of CD4dimCD8bright T cells was inversely correlated with change in HIV gag mRNA expression (R= −0.62, p≤0.001; Fig. 3B). Further, the frequency of CD4dimCD8bright T cells and CD8 single positive T cells were positively associated (R=+0.99; p<0.0001, Fig.3C). These data suggest that CD4dimCD8bright T cells play a significant role in anti-HIV responses in the brain. Furthermore, CD4dimCD8bright T cells and CD8 single positive T cells may enter the brain at the same rate or that once in the brain CD8 single positive T cells may give rise to the CD4dimCD8bright T cell phenotype.
Figure 3. CD4dimCD8bright T cells control HIV infection in the brain of NSG mice.

Twenty-eight HIV-infected NSG-huPBMC mice were sacrificed three weeks post-infection. The brain was harvested and cut in hemispheres. Brain infiltrating lymphocytes were isolated from one hemisphere for analysis of percent of CD4dimCD8bright T cells and CD8 single positive T cells by flow cytometry. HIV-gag mRNA transcripts were amplified from the other hemisphere by qRT-PCR. The correlation between percent of CD8 single positive (A) or CD4dimCD8bright (B) T cells and HIV-gag transcript expression was determined using Pearson’s Correlation Coefficient. The total number of lymphocytes counted was multiplied by the percent of CD8 single positive or CD4dimCD8bright T cells to determine the frequency of CD8 single positive or CD4dimCD8bright T cells. The correlation between frequency of CD4dimCD8bright and CD8 single positive T cells from the same brain is represented in (C).
Brain CD4dimCD8bright T cells from HIV infected mice exhibit anti-HIV specific responses
Given the correlation between increased CD4dimCD8bright T cells and decreased HIV gag mRNA expression in the CNS, we assessed whether CD4dimCD8bright T cells exhibit anti-HIV specific responses. T cells were isolated from the brain of HIV infected NSG-huPBMC mice at two weeks post-infection, co-cultured with syngeneic CD3-depleted PBMCs pre-loaded with either an irrelevant peptide (CMVpp65), HIV pooled peptides, or left unloaded. CD107ab expression was evaluated at 6 hr post ex vivo culture. Surface expression of CD107a and b (a.k.a. Lysosome-associated membrane protein) is a marker of cytotoxic potential as CD107a and b translocate to the cell surface in response to activation-induced degranulation (35). Less than 2% CD4dimCD8bright T cells cultured with targets without peptide or targets loaded with an irrelevant peptide expressed CD107ab while 6–10% of CD4dimCD8bright T cells cultured with targets loaded with HIV pooled peptides expressed CD107ab (Fig. 4A&B). These data indicate that CD4dimCD8bright T cells in the brain of HIV infected NSG mice exhibit cytotoxic anti-HIV specific responses, which could contribute to the decreased level of HIV seen in the brain of animals with higher frequencies of CD4dimCD8bright T cells.
Figure 4. Brain CD4dimCD8bright T cells from the HIV infected mice exhibit anti-HIV specific responses ex vivo.

Two weeks post infection, lymphocytes were isolated from brains of HIV infected mice and co-cultured with autologous target cells loaded with HIV pooled peptides, irrelevant peptide (CMVpp65), or unloaded. At six hours. CD107ab staining was performed. (A) Data represent mean ± standard deviation percentage of CD107ab expression from 8 mice. *p≤ 0.05 between no peptide group and HIV pooled peptides group as well as irrelevant peptide group and HIV pooled peptides group using student’s t test. (B) Representative flow plot.
CD4 is upregulated on CD8+ T cells by Wnt ligands produced by astrocytes
We next evaluated whether the brain microenvironment can induce CD8 single positive T cells to become CD4dimCD8bright T cells in vitro and in vivo. The brain, particularly astrocytes, is a rich source of Wnts (27, 32) which initiates a cascade of events to induce β-catenin expression. Given that CD4 expression on CD8+ T cells is mediated by Wnt/β-catenin signaling (18), we evaluated whether astrocytes mediate CD4dimCD8bright T cell expression through Wnts secretion. We cultured αCD3/αCD28 activated normal human PBMCs with or without astrocyte conditioned media (ACM) from primary human Progenitor-Derived Astrocytes (PDAs). ACM induced CD4dimCD8bright T cells by 2-fold in comparison to control (Fig. 5A). Transfecting PBMCs with a reporter for Wnt/β-catenin (TOPflash construct which contains several TCF/LEF binding sites linked to firefly luciferase) induced TOPflash activity in PBMCs cultured in ACM by approximately 2.5-fold (Fig. 5B) compared to control, suggesting that Wnts in ACM may be driving CD4dimCD8bright T cell expression through increased β-catenin activity. To determine if this induction is indeed mediated by Wnts in ACM, and because there are no neutralizing antibodies for Wnts, we depleted ACM of Wnt 1, Wnt 2b, Wnt 3, Wnt 5b, or Wnt 10b by magnetic immunoprecipitation, as described (27). Depletion of IgG was used as a control throughout. Wnts depletion was confirmed by western blot (data not shown) (27). Depletion of Wnts 1, 2b, 3, and 5b from ACM abrogated the ability of the ACM to induce the CD4dimCD8bright T cell phenotype (Fig. 5C). These data indicate that Wnts expressed by human astrocytes can skew CD8+ T cells toward the CD4dimCD8bright T cell phenotype.
Figure 5. Wnts from astrocyte conditioned media (ACM) induce CD4 expression on CD8+ T cells in vitro by activating β-catenin signaling.
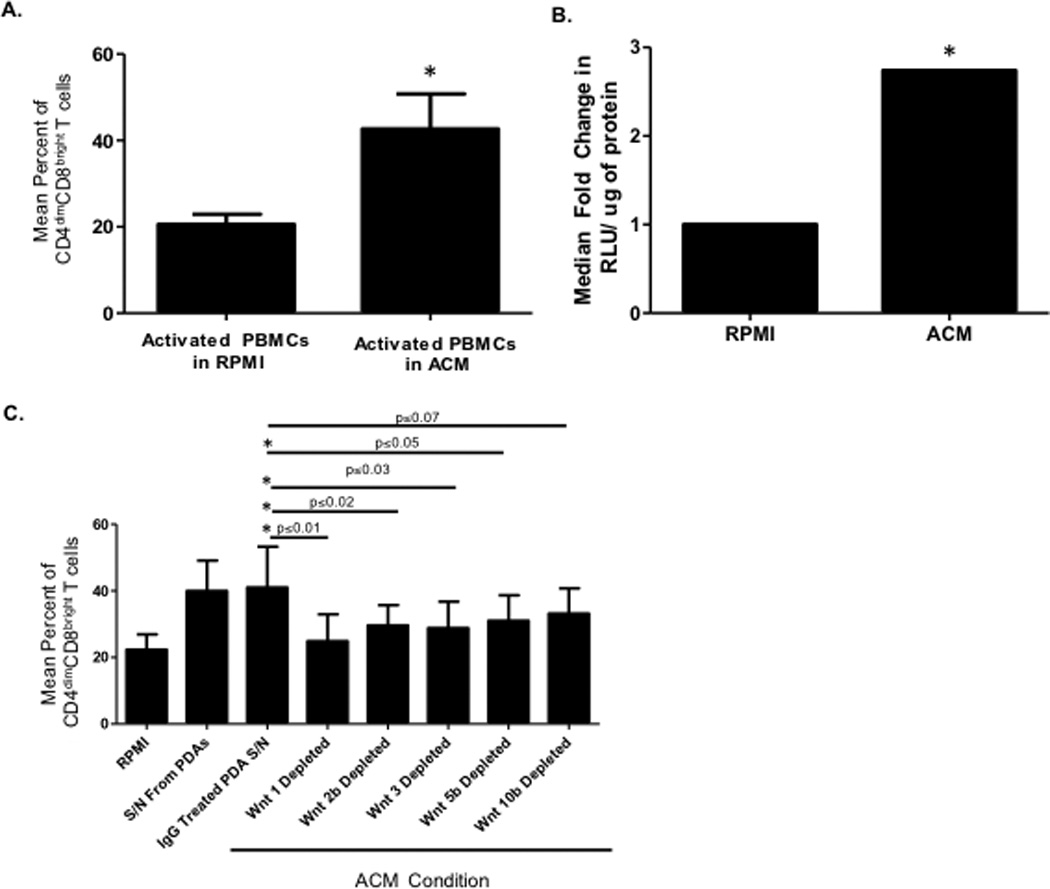
(A) Human PBMCs from 12 healthy donors were cultured for three days in cRPMI with 20 U/mL IL-2 and 1µg/mL αCD3/ αCD28. After three days, cells were cultured in a 1:1 mix of cRPMI and ACM with 20U/mL IL–2 and α-CD3/ α-CD28 for an additional three days. Cells were analyzed by flow cytometry for expression of CD4 on CD8+T cells and the mean percent of CD4dimCD8bright T cells was determined. Results are representative of 5 separate experiments. *p≤0.05 between cRPMI vs. ACM cultured wells using student’s t test. (B) PBMCs were cultured for three days in cRPMI as in (A) then transfected with TOPFlash or FOPFlash reporter plasmid before being cultured for an additional three days in cRPMI alone or a 1:1 mix of cRPMI and ACM. Cells were then lysed and a dual luciferase assay performed. Results are reported as fold change in relative light units (RLU) compared with FOPFlash control. Results are representative of 5 separate experiments. *p≤0.05 between cRPMI and ACM cultured PBMCs using student’s t test. (C) Human PBMCs were cultured for three days as in (A) then cultured in cRPMI alone or a 1:1 mix of cRPMI and individual Wnts depleted ACM by immunoprecipitation with antibodies for either IgG, Wnt 1, 2b, 3, 5b, or 10B. Cells were analyzed by flow cytometry for expression of CD4 on CD8+ T cells and the mean percent of CD4dimCD8bright T cells was determined. Results are representative of 5 separate experiments. *p≤0.05 between IgG treated ACM and Wnt depleted ACM using student’s t test unless otherwise indicated in figure.
The microenvironment of the brain induces CD8 single positive T cells to express CD4 in vivo
We next determined whether human CD8+ T cells could become CD4dimCD8bright T cells in vivo. CD8 single positive T cells were sorted from healthy human PBMCs by magnetic separation and cultured overnight with IL-2. After 24 hours in culture the cells were labeled with violet proliferation dye (VPD) then assessed by flow cytometry for the CD4dimCD8bright T cell population (Fig. 6A) and baseline VPD expression (Fig. 6D&E) directly before intracranial injection of 3×10⁶ cells in 10µl of PBS in the lateral brain ventricle of un-reconstituted NSG mice. Prior to injection, 0–2% of CD8+ T cells expressed CD4 (Fig. 6A&C). Six days later, cells were re-isolated from the brain and analyzed by flow cytometry for percent of CD4dimCD8bright T cells. We show that once injected into the brain, 13–20% of highly purified CD8 single positive cells become CD4dimCD8bright T cells. These CD4dimCD8bright T cells continue to proliferate in the brain to a comparable rate as that of CD8 single positive cells (Fig.6D&E). These data indicate that the microenvironment of the brain is conducive to differentiating infiltrating CD8+ T cells to express CD4 on their surface, generating the CD4dimCD8bright T cell phenotype.
Figure 6. CD8+ T cells differentiate into CD4dimCD8bright T cells in the brain where they are still proliferative.

Human PBMCs were isolated from healthy donors and CD8+ T cells were isolated from PBMCs by magnetic bead isolation. CD8+ T cells were cultured overnight with 20U/mL IL-2. The following day cells were stained with BD Violet Proliferation Dye (VPD) and analyzed by flow cytometry for expression of CD4 on CD8+ T cells (A & C) and baseline VPD expression in CD8 single positive (D) or CD4dimCD8bright (E) T cells. NSG mice were intracranially injected with 3×10⁶ cells in 10µl of PBS by stereotactic injection. Six days later, cells were re-isolated from the brain and expression of CD4 on CD8+ T cells was assessed by flow cytometry (B). The percent of CD4dimCD8bright T cells before and after intracranial injection is shown in (C). Proliferation of CD8 single positive (D) and CD4dimCD8bright (E) T cells was also determined by decrease in VPD. n=7, *p≤0.05 is between pre-injection CD4dimCD8bright T cells and post-injection CD4dimCD8bright T cells using student’s t test.
CD4dimCD8bright T cells induced by the brain microenvironment are Terminal Effector Memory T cells
We evaluated the phenotype of brain CD4dimCD8bright T cells; particularly whether those cells are central memory, effector memory or terminally differentiated effector memory (TEMRA) T cells using conventional phenotypic markers to distinguish these subsets (36–40). We found that although most CD8 single positive T cells were effector memory cells (CCR7−CD27loCD28loCD45RA−) prior to injection (Fig. 7A), six days post injection both CD8 single positive (Fig. 7A) and CD4dimCD8bright (Fig. 7B) T cells largely re-expressed CD45RA, indicating that they represent Terminal Effector Memory Cells re-expressing CD45RA (TEMRA, CCR7− CD27-CD28-CD45RA+). TEMRA cells are end-stage terminally differentiated cells with low proliferative capacity but high cytotoxicity due to high expression of perforin and FasL and enhanced cytokine production. TEMRA cells have been shown to play a vital role in control of HIV infection in the blood (40). Accumulation of terminally differentiated CD8+ T cells with low expression of CD28 is often associated with an increase in senescent T cells (36). To assess whether CD4dimCD8bright T cells in the HIV infected brain are senescent, we harvested lymphocytes from the brain of NSG-huPBMC mice that were uninfected or HIV infected and assessed expression of CD28loCD57+, a common delineator of T cell senescence (37–42). At three weeks post-infection, the percent of CD8 single positive T cells that were CD28loCD57+ was comparable in uninfected (47%) and HIV+ (40%) mice (Fig. 7C). This was also true in the CD4dimCD8bright subset with approximately 47% of brain infiltrating CD4dimCD8bright cells in the uninfected mice and 51% in the HIV infected mice (Fig. 7C). Collectively, these data indicate that the microenvironment of the brain can induce CD4 expression on CD8 T cells, which represent potent cytotoxic anti-HIV cells that are not senescent and are largely of the TEMRA phenotype in the brain.
Figure 7. Brain CD8 single positive and CD4dimCD8bright T cells are Terminal Effector Memory Cells and are not senescent.

CD8 single positive T cells were isolated from healthy human PBMCs by magnetic bead isolation and cultured overnight with 20U/mL IL-2 then assessed by flow cytometry to determine percent of effector memory cell populations. Unreconstituted and uninfected NSG mice were then intracranially injected with 3×10⁶ cells in 10µl of PBS by sterotactic injection. Six days later cells were re-isolated and the percent of Effector Memory (CCR7−CD27loCD28loCD45RA−) or TEMRA (CCR7−CD27loCD28loCD45RA+) in CD8 single positive (A) or CD4dimCD8bright (B) T cells was determined by flow cytometry. n=7 mice per group, *p≤0.05 between pre-injection and post-injection cell TEMRA or Effector Memory Cells using student’s t test. In (C) brain infiltrating CD8 single positive and CD4dimCD8bright T cells were assessed to determine expression of senescent markers CD28loCD57+ in uninfected and HIV infected mice at three weeks post-infection. n=8 mice per group. Data in C is not statistically significant between groups.
Discussion
CD8+ T cells play a critical role in anti-viral responses, including in HIV (2–6, 10–12, 15). However, in chronic HIV, peripheral CD8+ T cells undergo senescence and their lytic activity is diminished over time and does not normalize even after prolonged antiretroviral treatment (43). HIV is found in the brain of HIV infected individuals within 7–12 days of acute infection (44). Immunologic determinants of HIV control in the brain are not clear. We used the NSG-huPBMCs mouse model to assess the role of CD8+ T cell subsets in HIV control. We specifically focused on a unique subset of CD8+ T cells that co-expresses CD4 on its surface (CD4dimCD8bright T cells) because peripheral CD4dimCD8bright T cells have potent anti-HIV responses (15). We show here that while both CD8 single positive and CD4dimCD8bright T cells are found in the brain of NSG-huPBMC HIV+ mice, it is the CD4dimCD8bright T cells and not CD8 single positive T cells that are associated with lower HIV content in the brain. Furthermore, brain CD4dimCD8bright T cells of HIV infected mice exhibit anti-HIV specific responses ex vivo. These data indicate that in the CNS CD4dimCD8bright T cells control HIV infection. However, due to expression of CD4 on their surface, CD4dimCD8bright T cells are susceptible to HIV infection. In fact, both CD4 single positive and CD4dimCD8bright T cells are susceptible to HIV infection and loss, albeit CD4 single positive cell loss occurs at an earlier time point than CD4dimCD8bright T cells. Reduction of CD4dimCD8bright T cells in the brain may be independent of HIV infection, as p24 positive cells remain unchanged in this population. Although we did not directly assess whether CD4dimCD8bright T cells are more resistant to HIV infection, they have several properties that can confer resistance. CD4dimCD8bright T cells are enriched in β-catenin expression which is a co-transcriptional factor linked to suppression of HIV in PBMCs (46). Further, CD4dimCD8bright T cells express higher level of Bcl-XL, which is an anti-apoptotic factor under the control of β-catenin signaling that prevents activation induced cell death (18,45). As β-catenin represses HIV transcription (46), the high expression of β-catenin in CD4dimCD8bright T cells coupled with the Wnt rich microenvironment of the brain may either reduce the population size of HIV infected CD4dimCD8bright T cells or allow them to survive better post-infection. Further, other mechanisms contributing to reduction of brain CD4 single positive and CD4dimCD8bright T cells over time maybe due to HIV independent death (e.g inflammation/activation), change in phenotypic markers (loss of CD4 on CD4dimCD8bright T cells due to HIV infection), and/or trafficking out of the brain.
The Wnt/β-catenin pathway is important in thymocyte survival as thymocytes pass from the double negative to double positive stage (18,45). We have previously shown that this process still occurs in the periphery in CD8+ T cells to drive CD4 re-expression on mature CD8+ T cells (18). Another population of specialized CD8+ T cells with high β-catenin activity, high potency and durability, is the T stem cell memory (CD8+ Tscm) Population. Tscm make up approximately 2–4% of all circulating T cells and can rapidly differentiate into more mature central memory, effector memory, and effector T cells while maintaining their own pool (47). Like our study, previous work has shown that the frequency of circulating CD8 Tscm in untreated HIV+ individuals is inversely correlated with viral load suggesting a contribution in protecting patients from HIV disease progression (48). Although CD4dimCD8bright T cells and Tscm have numerous similarities, it is unknown if they are the same population. Tscm are routinely identified by a CD8+CD45RA+CCR7+CD27+CD95+ phenotype in the blood of HIV- infected patients (48). CD4dimCD8bright T cells in the brain of NSG mice are largely CCR7− and CD27− but do express CD45RA+ which would indicate that at least in the brain these are not phenotypically the same population of cells.
The expression of CD4dimCD8bright T cells is positively associated with CD8 single positive T cells in the brain. This finding suggests that both populations may enter the CNS together or that once in the brain, CD8 T cells give rise to CD4dimCD8bright T cells or both events could occur simultaneously. This is especially likely because the CNS and especially astrocytes are a rich source for Wnts which drive CD4dimCD8bright T cell phenotype. Indeed, Wnts from astrocyte conditioned media induced the CD4dimCD8bright T cell phenotype in vitro. Injecting a highly purified CD8 single positive T cell population into the brain also gave rise to CD4dimCD8bright T cells. Those cells are largely Terminal Effector Memory cells re-expressing CD45RA. Re-expression of CD45RA in effector memory cells is a marker of terminal differentiation where effector-memory cells display enhanced lytic capabilities but reduced proliferative potential (40, 50–53). Terminal differentiation of total CD8+ T cells and HIV specific CD8+ T cells has been associated with slower progression of HIV (54, 55). Accumulation of terminally differentiated CD8+ T cells has also been linked to senescence, which is characterized by CD8+ T cells with shortened telomeres, loss of the costimulatory molecule CD28, and increased expression of CD57 (43). CD57 is a marker of proliferative history and often indicates a cell that has poor proliferative capacity (43). Here we show that brain infiltrating CD4dimCD8bright T cells are not more senescent in the brain of HIV infected mice. Furthermore, HIV infection actually inhibits senescence in T cell populations in the periphery (40). Hence, the brain microenvironment induces CD4dimCD8bright T cells with a potent terminal effector phenotype and the capability of lysing HIV- infected cells in the brain. In support of this, it has been previously reported that CD8+ T cells in the CSF of HIV-infected patients have higher expression of CD38, HLA-DR, CXCR3, and adhesion markers indicating they are more highly activated than CD8+ T cells in the periphery (11, 38). While increased activation and increased expression of adhesion markers is necessary for activated CD8+ T cells to cross the blood brain barrier into the HIV- infected brain, it is possible that the microenvironment of the brain, likely through Wnts, further skews the differentiation of CD8+ T cells to enhance their anti-viral capacity. The consequence of heightened inflammatory CD8+ T cells in the brain is not clear. On one hand, they can control HIV spread in the CNS but on the other secretion of inflammatory cytokines and lytic molecules may lead to neuronal injury. Recently, Schreir et. al. showed that CD8+IFNγ+ T cells in CSF of HIV-infected patients positively correlated with neurocognitive impairment while CD8+CD107ab+ T cells negatively correlated with neurocognitive impairment (49). Our data shows that approximately 10% of brain CD4dimCD8bright T cells ex vivo express CD107ab when co-cultured with HIV pooled peptide loaded targets. Further studies are warranted to determine whether the frequency of CD4dimCD8bright T cells is associated with a better neurocognitive performance score among HIV infected individuals. On one hand, anti-HIV responses of CD4dimCD8bright T cells may be linked to lower brain viral burdem. On the other hand, higher expression of inflammatory cytokines and cytolytic molecules such as CD107ab from CD4dimCD8bright T cells may be detrimental to CNS homeostasis and function (15,49). It still remains to be determined whether CD4dimCD8bright T cells in CSF will also be associated with better CSF viral control and better neurocognitive outcome. Understanding the contribution of CD4dimCD8bright T cells in anti-HIV immunity and biology of CD8+ T cells is critical to devise therapeutic strategies to heighten and/or preserve anti-viral responses to a wide variety of viral infections.
Supplementary Material
Acknowledgments
This work is supported by National Institutes of Health grant 5R01NS060632 (LA), R01MH00628 (LA) and F32 NS080657 (MHR)
REFERNCES
- 1.Hickey WF. Migration of hematogenous cells through the blood-brain barrier and the initiation of CNS inflammation. Brain Pathol. 1991;1:97–105. doi: 10.1111/j.1750-3639.1991.tb00646.x. [DOI] [PubMed] [Google Scholar]
- 2.Marcondes MC, Burdo TH, Sopper S, Huitron-Resendiz S, Lanigan C, Watry D, Flynn C, Zandonatti M, Fox HS. Enrichment and persistence of virus-specific CTL in the brain of simian immunodeficiency virus-infected monkeys is associated with a unique cytokine environment. J Immunol. 2007;178:5812–5819. doi: 10.4049/jimmunol.178.9.5812. [DOI] [PubMed] [Google Scholar]
- 3.Marcondes MC, Burudi EM, Huitron-Resendiz S, Sanchez-Alavez M, Watry D, Zandonatti M, Henriksen SJ, Fox HS. Highly activated CD8(+) T cells in the brain correlate with early central nervous system dysfunction in simian immunodeficiency virus infection. J Immunol. 2001;167:5429–5438. doi: 10.4049/jimmunol.167.9.5429. [DOI] [PubMed] [Google Scholar]
- 4.Marcondes MC, Morsey B, Emanuel K, Lamberty BG, Flynn CT, Fox HS. CD8+ T Cells Maintain Suppression of Simian Immunodeficiency Virus in the Central Nervous System. J Infect. Dis. 2015;211:40–40. doi: 10.1093/infdis/jiu401. [DOI] [PMC free article] [PubMed] [Google Scholar]
- 5.Marcondes MC, Phillipson CA, Fox HS. Distinct clonal repertoire of brain CD8+ cells in simian immunodeficiency virus infection. Aids. 2003;17:1605–1611. doi: 10.1097/00002030-200307250-00004. [DOI] [PubMed] [Google Scholar]
- 6.McCrossan M, Marsden M, Carnie FW, Minnis S, Hansoti B, Anthony IC, Brettle RP, Bell JE, Simmonds P. An immune control model for viral replication in the CNS during presymptomatic HIV infection. Brain. 2006;129:503–516. doi: 10.1093/brain/awh695. [DOI] [PubMed] [Google Scholar]
- 7.Petito CK, Adkins B, McCarthy M, Roberts B, Khamis I. CD4+ and CD8+ cells accumulate in the brains of acquired immunodeficiency syndrome patients with human immunodeficiency virus encephalitis. J Neurovirol. 2003;9:36–44. doi: 10.1080/13550280390173391. [DOI] [PubMed] [Google Scholar]
- 8.Petito CK, Torres-Munoz JE, Zielger F, McCarthy M. Brain CD8+ and cytotoxic T lymphocytes are associated with, and may be specific for, human immunodeficiency virus type 1 encephalitis in patients with acquired immunodeficiency syndrome. J Neurovirol. 2006;12:272–283. doi: 10.1080/13550280600879204. [DOI] [PubMed] [Google Scholar]
- 9.Peluso R, Haase A, Stowring L, Edwards M, Ventura P. A Trojan Horse mechanism for the spread of visna virus in monocytes. Virology. 1985;147:231–236. doi: 10.1016/0042-6822(85)90246-6. [DOI] [PubMed] [Google Scholar]
- 10.Sadagopal S, Amara RR, Kannanganat S, Sharma S, Chennareddi L, Robinson HL. Expansion and exhaustion of T-cell responses during mutational escape from long-term viral control in two DNA/modified vaccinia virus Ankara-vaccinated and simian-human immunodeficiency virus SHIV-89.6P-challenged macaques. J Virol. 2008;82:4149–4153. doi: 10.1128/JVI.02242-07. [DOI] [PMC free article] [PubMed] [Google Scholar]
- 11.Sadagopal S, Lorey SL, Barnett L, Basham R, Lebo L, Erdem H, Haman K, Avison M, Waddell K, Haas DW, Kalams SA. Enhancement of human immunodeficiency virus (HIV)-specific CD8+ T cells in cerebrospinal fluid compared to those in blood among antiretroviral therapy-naive HIV-positive subjects. J Virol. 2008;82:10418–10428. doi: 10.1128/JVI.01190-08. [DOI] [PMC free article] [PubMed] [Google Scholar]
- 12.von Herrath M, Oldstone MB, Fox HS. Simian immunodeficiency virus (SIV)-specific CTL in cerebrospinal fluid and brains of SIV-infected rhesus macaques. J Immunol. 1995;154:5582–5589. [PubMed] [Google Scholar]
- 13.Nolz JC, Starbeck-Miller GR, Harty JT. Naïve, effector and memory CD8 T-cell trafficking: Parellels and distinctions. Immunotherapy. 2011;3:1223–1233. doi: 10.2217/imt.11.100. [DOI] [PMC free article] [PubMed] [Google Scholar]
- 14.Zloza A, Al-Harthi L. Multiple populations of T lymphocytes are distinguished by the level of CD4 and CD8 coexpression and require individual consideration. J Leukoc. Biol. 2006;79:4–6. doi: 10.1189/jlb.0805455. [DOI] [PubMed] [Google Scholar]
- 15.Zloza A, Schenkel JM, Tenorio AR, Martinson JA, Jeziorczak PM, Al-Harthi L. Potent HIV-specific responses are enriched in a unique subset of CD8+ T cells that coexpresses CD4 on its surface. Blood. 2009;114:3841–3853. doi: 10.1182/blood-2009-02-202481. [DOI] [PMC free article] [PubMed] [Google Scholar]
- 16.Zloza A, Sullivan YB, Connick E, Landay AL, Al-Harthi L. CD8+ T cells that express CD4 on their surface (CD4dimCD8bright T cells) recognize an antigen-specific target, are detected in vivo, and can be productively infected by T-tropic HIV. Blood. 2003;102:2156–2164. doi: 10.1182/blood-2002-07-1972. [DOI] [PubMed] [Google Scholar]
- 17.Sullivan YB, Landay AL, Zack JA, Kitchen SG, Al-Harthi L. Upregulation of CD4 on CD8+ T cells: CD4dimCD8bright T cells constitute an activated phenotype of CD8+ T cells. Immunology. 2001;103:270–280. doi: 10.1046/j.1365-2567.2001.01243.x. [DOI] [PMC free article] [PubMed] [Google Scholar]
- 18.Schenkel JM, Zloza A, Li W, Narasipura SD, Al-Harthi L. Beta-catenin signaling mediates CD4 expression on mature CD8+ T cells. J Immunol. 2010;185:2013–2019. doi: 10.4049/jimmunol.0902572. [DOI] [PMC free article] [PubMed] [Google Scholar]
- 19.Yang LP, Riley JL, Carroll RG, June CH, Hoxie J, Patterson BK, Ohshima Y, Hodes RJ, Delespesse G. Productive infection of neonatal CD8+ T lymphocytes by HIV-1. J Exp. Med. 1998;187:1139–1144. doi: 10.1084/jem.187.7.1139. [DOI] [PMC free article] [PubMed] [Google Scholar]
- 20.Kitchen SG, Jones NR, LaForge S, Whitmire JK, Vu BA, Galic Z, Brooks DG, Brown SJ, Kitchen CM, Zack JA. CD4 on CD8(+) T cells directly enhances effector function and is a target for HIV infection. Proc. Natl. Acad. Sci. U. S. A. 2004;101:8727–8732. doi: 10.1073/pnas.0401500101. [DOI] [PMC free article] [PubMed] [Google Scholar]
- 21.Kitchen SG, Korin YD, Roth MD, Landay A, Zack JA. Costimulation of naive CD8(+) lymphocytes induces CD4 expression and allows human immunodeficiency virus type 1 infection. J Virol. 1998;72:9054–9060. doi: 10.1128/jvi.72.11.9054-9060.1998. [DOI] [PMC free article] [PubMed] [Google Scholar]
- 22.Kitchen SG, LaForge S, Patel VP, Kitchen CM, Miceli MC, Zack JA. Activation of CD8 T cells induces expression of CD4, which functions as a chemotactic receptor. Blood. 2002;99:207–212. doi: 10.1182/blood.v99.1.207. [DOI] [PubMed] [Google Scholar]
- 23.Kitchen SG, Whitmire JK, Jones NR, Galic Z, Kitchen CM, Ahmed R, Zack JA. The CD4 molecule on CD8+ T lymphocytes directly enhances the immune response to viral and cellular antigens. Proc. Natl. Acad. Sci. U. S. A. 2005;102:3794–3799. doi: 10.1073/pnas.0406603102. [DOI] [PMC free article] [PubMed] [Google Scholar]
- 24.Ortolani C, Forti E, Radin E, Cibin R, Cossarizza A. Cytofluorimetric identification of two populations of double positive (CD4+,CD8+) T lymphocytes in human peripheral blood. Biochem. Biophys. Res. Commun. 1993;191:601–609. doi: 10.1006/bbrc.1993.1260. [DOI] [PubMed] [Google Scholar]
- 25.Blue ML, Daley JF, Levine H, Schlossman SF. Coexpression of T4 and T8 on peripheral blood T cells demonstrated by two-color fluorescence flow cytometry. J Immunol. 1985;134:2281–2286. [PubMed] [Google Scholar]
- 26.Flamand L, Crowley RW, Lusso P, Colombini-Hatch S, Margolis DM, Gallo RC. Activation of CD8+ T lymphocytes through the T cell receptor turns on CD4 gene expression: implications for HIV pathogenesis. Proc. Natl. Acad. Sci. U. S. A. 1998;95:3111–3116. doi: 10.1073/pnas.95.6.3111. [DOI] [PMC free article] [PubMed] [Google Scholar]
- 27.Richards MH, Narasipura SD, Kim S, Seaton MS, Lutgen V, Al-Harthi L. Dynamic interaction between astrocytes and infiltrating PBMCs in context of neuroAIDS. Glia. 2015;63:441–451. doi: 10.1002/glia.22763. [DOI] [PMC free article] [PubMed] [Google Scholar]
- 28.Polakis P. The many ways of Wnt in cancer. Curr. Opin. Genet. Dev. 2007;17:45–51. doi: 10.1016/j.gde.2006.12.007. [DOI] [PubMed] [Google Scholar]
- 29.Angers S, Moon RT. Proximal events in Wnt signal transduction. Nat. Rev. Mol. Cell Biol. 2009;10:468–477. doi: 10.1038/nrm2717. [DOI] [PubMed] [Google Scholar]
- 30.Coombs GS, Covey TM, Virshup DM. Wnt signaling in development, disease and translational medicine. Curr. Drug Targets. 2008;9:513–531. doi: 10.2174/138945008784911796. [DOI] [PubMed] [Google Scholar]
- 31.Henderson LJ, Sharma A, Monaco MCG, Major EO, Al-Harthi L. Human immunodeficiency virus type 1 (HIV-1) transactivator of transcription through its intact core and cysteine-rich domains inhibits wnt/β-catenin signaling in astrocytes: Relevance to HIV neuropathogenesis. J Neurosci. 2012;32:16306–16313. doi: 10.1523/JNEUROSCI.3145-12.2012. [DOI] [PMC free article] [PubMed] [Google Scholar]
- 32.Richards MH, Seaton MS, Wallace J, Al-Harthi L. Porcupine is not required for the production of the majority of Wnts from primary human astrocytes and CD8+ T cells. PLoS One. 2014;9:e92159. doi: 10.1371/journal.pone.0092159. [DOI] [PMC free article] [PubMed] [Google Scholar]
- 33.Dash PK, Gendelman HE, Roy U, Baslkundi S, Alnouti Y, Mosley RL, Glebard HA, McMillan J, Gorantla S, Poluektova LY. Long-acting nanoformulated antiretroviral therapy elicits potent antiretroviral and neuroprotective responses in HIV-1-infected humanized mice. AIDS. 2012;26:2135–2144. doi: 10.1097/QAD.0b013e328357f5ad. [DOI] [PMC free article] [PubMed] [Google Scholar]
- 34.Boska MD, Dash PK, Knibbe J, Epstein AA, Akhter SP, Fields N, High R, Makarov E, Bonasera S, Gelbard HA, Poluektova LY, Gendelman HE, Gorantla S. Associations between brain microstructures, metabolites, and cognitive deficits during chronic HIV-1 infection of humanized mice. Mol. Neurodegener. 2014;9:58. doi: 10.1186/1750-1326-9-58. [DOI] [PMC free article] [PubMed] [Google Scholar]
- 35.Betts MR, Brenchley JM, Price DA, De Rosa SC, Douek DC, Roederer M, Koup RA. Sensitive and viable identification of antige-specific CD8+ T cells by a flow cytometric assay for degranulation. J Immunol. Methods. 2003;281:65–78. doi: 10.1016/s0022-1759(03)00265-5. [DOI] [PubMed] [Google Scholar]
- 36.Shacklett BL, Cox CA, Wilkens DT, Karl Karlsson R, Nilsson A, Nixon DF, Price RW. Increased adhesion molecule and chemokine receptor expression on CD8+ T cells trafficking to cerebrospinal fluid in HIV-1 infection. J Infect. Dis. 2004;189:2202–2212. doi: 10.1086/421244. [DOI] [PubMed] [Google Scholar]
- 37.Sulggi A, Sinclair E, Hatano H, Hsue PY, Epling L, Hect FM, Bansberg DR, Martin JN, McCune JM, Deeks SG, Hunt PW. Impact of HIV on CD8+ T cell CD57 expression is distinct from that of CMV and aging. PLoS One. 2014;9:e89444. doi: 10.1371/journal.pone.0089444. [DOI] [PMC free article] [PubMed] [Google Scholar]
- 38.Effros RB. Replicative senescence: the final stage of memory T cell differentiation? Curr. HIV Res. 2003;1:131–152. doi: 10.2174/1570162033485348. [DOI] [PubMed] [Google Scholar]
- 39.Lee SA, Sinclair E, Hatano H, Hsue PY, Epling L, Hecht FM, Banspberg DR, Martin JN, McCune JM, Deeks SG, Hunt PW. Impact of HIV on CD8+ T cell CD57 expression is distinct from that of CMV and aging. PLoS One. 2014;9:e89444. doi: 10.1371/journal.pone.0089444. [DOI] [PMC free article] [PubMed] [Google Scholar]
- 40.Northfield JW, Loo CP, Barbour JD, Spotts G, Hecht FM, Klenerman P, Nixon DF, Michaelsson J. Human immunodeficiency virus type 1 (HIV-1)-specific CD8+ T(EMRA) cells in early infection are linked to control of HIV-1 viremia and predict the subsequent viral load set point. J Virol. 2007;81:5759–5765. doi: 10.1128/JVI.00045-07. [DOI] [PMC free article] [PubMed] [Google Scholar]
- 41.Hersperger AR, Martin JN, Shin LY, Sheth PM, Kovacs CM, Cosma GL, Makedonas G, Pereyra F, Walker BD, Kaul R, Deeks SG, Betts MR. Increased HIV-specific CD8+ T-cell cytotoxic potential in HIV elite controllers is associated with T-bet expression. Blood. 2011;117:3799–3808. doi: 10.1182/blood-2010-12-322727. [DOI] [PMC free article] [PubMed] [Google Scholar]
- 42.Lieberman J, Trimble LA, Friedman RS, Lisziewicz J, Lori F, Shankar P, Jenssen H. Expansion of CD57 and CD62L-CD45RA+ CD8 T lymphocytes correlates with reduced viral plasma RNA after primary HIV infection. AIDS. 1999;13:891–899. doi: 10.1097/00002030-199905280-00004. [DOI] [PubMed] [Google Scholar]
- 43.Dock HN, Effros RB. Role of CD8 T cell replicative senescence in human aging and in HIV-mediated immunosenescence. Aging Dis. 2011;2:382–397. [PMC free article] [PubMed] [Google Scholar]
- 44.Valcour V, Chalermchai T, Sailasuta N, Marovich M, Lerdlum S, Suttichom D, Suwanwela NC, Jagodzinski L, Michael N, Spudich S, van Griensven F, de Souza M, Kim J, Ananworanich J RV254/SEARCH 010 Study Group. Central nervous system viral invasion and inflammation during acute HIV infection. J Infect. Dis. 2012;206:275–282. doi: 10.1093/infdis/jis326. [DOI] [PMC free article] [PubMed] [Google Scholar]
- 45.Xie H, Huang Z, Sadim MS, Sun Z. Stabilized beta-catenin extends thymocyte survival by up-regulating Bcl-xL. J Immunol. 2005;175:7981–7988. doi: 10.4049/jimmunol.175.12.7981. [DOI] [PubMed] [Google Scholar]
- 46.Kumar A, Zloza A, Moon RT, Watts J, Tenorio AR, Al-Harthi L. Active beta-catenin signaling is an inhibitory pathway for human immunodeficiency virus replication in peripheral blood mononuclear cells. J Virol. 2008;82:2813–2820. doi: 10.1128/JVI.02498-07. [DOI] [PMC free article] [PubMed] [Google Scholar]
- 47.Gattinoni L, Lugli E, Ji Y, Pos Z, Paulos CM, Quigley MF, Almeida JR, Gostick E, Yu Z, Carpenito C, Wang E, Douek DC, Price DA, June CH, Marincola FM, Roederer M, Restifo NP. A human memory T cell subset with stem cell-like properties. Nat. Med. 2011;17:1290–1297. doi: 10.1038/nm.2446. [DOI] [PMC free article] [PubMed] [Google Scholar]
- 48.Ribeiro P, Milush S, Cunha-Neto JM, Kalla E, Kalil EG, Somsouk J, Hunt M, Deeks PW, Nixon SG, SenGupta D DF. The CD8+ memory stem T cell (T(SCM)) subset is associated with improved prognosis in chronic HIV-1 infection. J Virol. 2014;88:13836–13844. doi: 10.1128/JVI.01948-14. [DOI] [PMC free article] [PubMed] [Google Scholar]
- 49.Schrier RD, Hong S, Crescini M, Ellis R, Perez-Santiago J, Spina C, Letendre S HNRP Group. Cerebrospinal Fluid (CSF) CD8+ T-Cells That Express Interferon-Gamma Contribute to HIV Associated Neurocognitive Disorders (HAND) PLoS One. 2015;10:e0116526. doi: 10.1371/journal.pone.0116526. [DOI] [PMC free article] [PubMed] [Google Scholar]
- 50.Henson SM, Riddell NE, Akbar AN. Properties of end-stage human T cells defined by CD45RA re-expression. Curr. Opin. Immunol. 2012;24:476–481. doi: 10.1016/j.coi.2012.04.001. [DOI] [PubMed] [Google Scholar]
- 51.Lanzavecchia F, Sallusto A. Understanding the generation and function of memory T cell subsets. Curr. Opin. Immunol. 2005;17:326–332. doi: 10.1016/j.coi.2005.04.010. [DOI] [PubMed] [Google Scholar]
- 52.Sallusto F, Lenig D, Forster R, Lipp M, Lanzavecchia A. Two subsets of memory T lymphocytes with distinct homing potentials and effector functions. Nature. 1999;401:708–712. doi: 10.1038/44385. [DOI] [PubMed] [Google Scholar]
- 53.Appay V, Dunbar PR, Callan M, Klenerman P, Gillespie GM, Papagno L, Ogg GS, King A, Lechner F, Spina CA, Little S, Havlir DV, Richman DD, Gruener N, Pape G, Waters A, Easterbrook P, Salio M, Cerundolo V, McMichael AJ, Rowland-Jones SL. Memory CD8+ T cells vary in differentiation phenotype in different persistent virus infections. Nat. Med. 2002;8:379–385. doi: 10.1038/nm0402-379. [DOI] [PubMed] [Google Scholar]
- 54.Champagne P, Ogg GS, King AS, Knabenhans C, Ellefsen K, Nobile M, Appay V, Rizzardi GP, Fleury S, Lipp M, Forster R, Rowland-Jones S, Sekaly RP, McMichael AJ, Pantaleo G. Skewed maturation of memory HIV-specific CD8 T lymphocytes. Nature. 2001;410:106–111. doi: 10.1038/35065118. [DOI] [PubMed] [Google Scholar]
- 55.Meyer-Olson D, Simons BC, Conrad JA, Smith RM, Barnett L, Lorey SL, Duncan CB, Ramalingam R, Kalams SA. Clonal expansion and TCR-independent differentiation shape the HIV-specific CD8+ effector-memory T-cell repertoire in vivo. Blood. 2010;116:396–405. doi: 10.1182/blood-2009-11-254136. [DOI] [PMC free article] [PubMed] [Google Scholar]
Associated Data
This section collects any data citations, data availability statements, or supplementary materials included in this article.