

Abstract
In recent years, various studies have attempted to understand human evolution by examining relationships between athletic performance or physical fitness and facial attractiveness. Over a wide range of five homogeneous groups (n = 327), there is an approximate 3% shared variance between facial attractiveness and athletic performance or physical fitness (95% CI = 0.5–8%, p = 0.002). Further, studies relating human performance and attractiveness often have major methodological limitations that limit their generalizability. Thus, despite statistical significance, the association between facial attractiveness and human performance has questionable biological importance. Here, we present a critique of these studies and provide recommendations to improve the quality of future research in this realm.
Keywords: mate selection, exercise, endurance, attractiveness, masculinity, physiology
1. Introduction
The topics of mate selection and human sexual attraction have been studied within the fields of psychology and evolutionary biology. Studies demonstrate that facial attractiveness is associated with favourable physical fitness, suggesting the two are evolutionarily linked [1–5]. Attempts to relate concepts of evolutionary biology to modern competitive sports and physical fitness are interesting, but flaws in study design and statistical interpretation limit the meaningfulness of these associations. We argue that studies which extrapolate weak, sport-specific outcomes from homogeneous groups of athletes [3,4] or from college students [1,2,5] are not appropriate for making claims regarding human evolution and behaviour.
2. Homogeneous samples
Studies relating facial features to athletic performance generally focus on homogeneous populations and therefore lack external validity. This is exemplified by Postma [4], who reported a positive relationship between facial attractiveness and Tour de France (TDF) performance. The TDF represents an extremely elite group of professional cyclists from around the world (164 finishers in 2014, representing approximately 0.0002% of 20–34-year-old males from countries classified as ‘more developed’ [6]). TDF competitors represent the upper echelon of professional cyclists, with mean aerobic capacities of 73 (s.d. = 4) ml kg–1 min–1 [7]—nearly twofold higher than the mean of the general population of the same age [44(6) ml kg–1 min−1)] [8]. Thus, the TDF finishers with the lowest aerobic capacities (more than 65 ml kg–1 min−1) are still more than 3.5 s.d. units above the ‘average Joe’.
If the worst TDF cyclists (i.e. supposedly least facially attractive yet extremely fit compared to the general population) were rated alongside average recreational athletes (i.e. inferior endurance performance as indicated by aerobic capacity), a few outcomes are possible. One possibility is that last place TDF finishers, whose aerobic capacities are at least 3.5 s.d.s above the average population [7,8], are more attractive than approximately 80% of the general population, given Postma's correlation of approximately 0.25 [(65–44) ÷ 6 = 3.5 s.d.s; 3.5 × 0.25 = 0.88 s.d. units above the mean, approx. 81% of the area to the left of the normal curve)]. The greater facial attractiveness of TDF athletes has not been scientifically tested, thus the plausibility of this association is at the reader's discretion. Conversely, if the worst TDF finishers are less facially attractive than the aerobically inferior general population, one could conclude that evolution facially selects against lean aerobically fit individuals. Herein lies the danger of generalizing data from a homogeneous group of athletes to the larger population, and this emphasizes the need to confirm the external validity of such findings before making evolutionary implications.
3. Sport-specific performance metrics
Athletic performance metrics used in studies relating facial features to fitness often represent training-induced sport-specific adaptations rather than biological indicators of heritable fitness. While the TDF requires excellent endurance, no single competition serves as a gold standard of general endurance ability. This is exemplified by seven-time champion Lance Armstrong's domination of the TDF, which contrasts his best marathon finish of 2 : 46 : 43 (232nd overall in 2007 NYC Marathon), which is more than 40 min (more than 30%) slower than the men's world record. Moreover, if the NYC marathon field were as restricted as the TDF (approx. 200 athletes), Armstrong would not even qualify to start. If one uses TDF performance as the metric of endurance, Armstrong is expected to be highly attractive, but if marathon performance is used as the hallmark of endurance, Armstrong suddenly becomes relatively less attractive (but still considerably more attractive than actor Ryan Reynolds, named ‘Sexiest Man Alive’ in 2010: 7993rd place male finisher the following year in 3 : 50 : 22). Differences in long-term sport-specific training, rather than heritable fitness, likely account for large gaps in ‘endurance performance’ between marathon winners, Armstrong and Reynolds. Since running and cycling performance are not interchangeable measures of endurance performance at the elite level, and considerable anthropometric differences exist between sports (table 1), it seems unlikely for evolution of endurance to select for the cycling phenotype, when the running phenotype would likely be of greater value to early hominids. Thus, it seems risky to extrapolate sport-specific endurance performance data to evolution.
Table 1.
Comparison of key anthropometric/physiologic profiles of athletic populations whose performance has been linked to facial attractiveness. Mean (s.d.).
| athlete | height (cm) | body mass (kg) | BMI (kg m–2) | % body fat | aerobic capacity (ml kg–1 min–1) |
|---|---|---|---|---|---|
| TDF cyclists [7,9]a | 179 (6) (winners) | ∼67 (7) (winners) | 24.6 | 8 (1) % | 70–80 (average competitor), 79–81 (winners) |
| National Football League Quarterbacks [3,10] | 191 (3) | 101 (5) | 27.7 | 16 (5) | — |
| Soccer Goalkeepers [11] | >180 | >77 | >23.8 | 12–14% | 51 (6) |
| National Hockey League Goalies [12] | 180 (6) | 84 (7) | 25.9 | sum of 4 skinfolds 50 ± 10 mm | 50 (6) |
| National Hockey League Forwards [12] | 184 (5) | 90 (7) | 26.7 | sum of 4 skinfolds 39 ± 10 mm | 54 (5) |
aFor comparison, anthropometrics of elite distance runners (n = 44) are: height, approximately 173–174 cm; body mass, approximately 57 kg; BMI, approximately 19.0 [13].
Similarly, Williams et al. [3] proposed that the positive relationship identified between professional football quarterback rating and facial attractiveness may offer insight to natural selection and mate choice, and implies its relevance in current culture. While Williams et al. briefly acknowledge some limitations of their performance metric, they nonetheless conclude that facial attractiveness signals heritable fitness, which can be detected even among a homogeneous group of professional athletes [3]. However, quarterback rating is not a relevant metric of an individual's genetics, but rather a team sport-specific index that only considers passing performance, and excludes other aspects of quarterback success, such as rushing. Williams et al. justify their use of this performance metric citing White & Berry [14], who actually suggest the opposite: ‘Although we refer to these as quarterback ratings they are certainly confounded with the ability of the quarterback's offense … it would be more accurate to say that we are ranking the offense's passing ability with the particular quarterback in control … We also do not account for the strength of the defense…’[14, p. 18]. Thus, it is highly inappropriate to draw conclusions about mate selection related to one individual's genetics from a metric that is representative of an entire team and heavily influenced by multiple confounding factors.
4. Statistical significance versus biological meaningfulness
Perhaps the most important issue with all of the previously mentioned studies is that the strong conclusions are based on weak statistical findings. Correlations that are less than or equal to 0.35 are regarded as being low or weak [15] and all studies relating facial attractiveness to athletic performance and physical fitness are below this range (figure 1). Several sources state that with sufficient measurement precision and a large enough sample size, one can obtain a statistically significant (non-zero) effect [15,16]. What scientists ultimately should be interested in is the biological importance, which can be assessed using the magnitude of effect (i.e. effect size statistics) and their confidence intervals [16]. To collectively evaluate the associations between athletic performance/physical fitness and facial attractiveness, we performed a meta-analysis of five studies consisting of 327 individuals [1–5] (figure 1). While statistically significant, there was only approximately 3% shared variance (r2) between attraction and athletic performance/physical fitness, which ranged approximately from 0.5 to 8% (95% CI, figure 1). While this falls within the range of a meta-analysis performed on 43 other meta-analyses spanning from physiology, ecology and evolution, which demonstrate a weighted mean shared variance of 2.3–4.3% (95% CI) [17], any two large sets of random numbers have some mathematically shared variance. Thus, it is difficult to determine whether the approximate 3% shared variance between human performance and facial attractiveness is actually biologically meaningful, especially in the light of the many other methodological issues in such studies.
Figure 1.
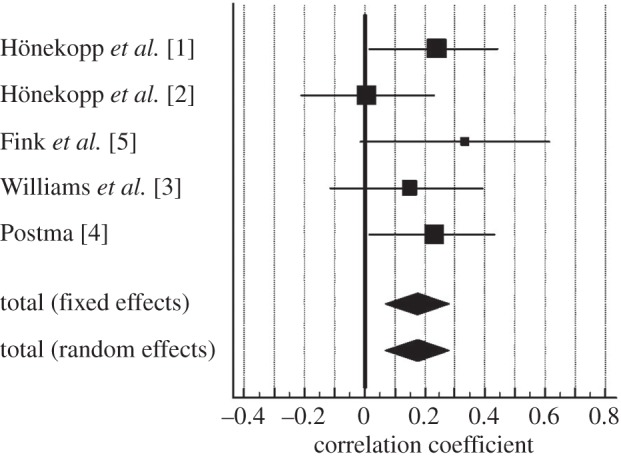
Meta-analysis of the association between physical fitness or athletic performance and facial attractiveness, representing 327 subjects. The first three studies used global measures of physical fitness (not sport-specific outcomes) and the last two studies are homogeneous groups of elite athletes (sport-specific outcomes). Age and weight/BMI were controlled for. Using a fixed or random effects model, the correlation coefficient between facial attractiveness and physical fitness/athletic performance was 0.18 (95% CI = 0.07–0.28, z-score = 3.16, p = 0.002). There was no heterogeneity between studies (Q = 3.69, d.f. = 4, p = 0.45). This overall association is not likely biologically meaningful since only approximately 3% of the variation in athletic performance or physical fitness is related to facial attractiveness.
When the r or r2 is especially weak, valid justification must be presented to argue that findings represent a real biological linkage, otherwise random patterns may be mistaken for interesting findings and supported through unscientific post-hoc explanations [18]. For instance, Williams et al. [3] suggest that high testosterone levels in better football players may positively influence their facial attractiveness. Thus, Williams et al. combine weak relationships between testosterone and facial morphology [19] with weak relationships between facial attractiveness and potentially inappropriate performance metrics to theorize that testosterone plays a meaningful role in linking quarterback rating, attractiveness and heritable fitness. Though testosterone is the central linkage in this theory that accounts for the small shared variance between attractiveness and quarterback rating, there is no evidence that high testosterone concentration is a pre-requisite for success as a professional quarterback, or that inter-individual variation in testosterone levels differentiates professional quarterbacks from one another. As such, the biological relevance of this weak relationship must be scrutinized. Hypotheses based on weak relationships with multiple degrees of separation must be tested through more direct research methods.
5. Contradicting findings
Even if one disregards biological meaningfulness in favour of statistical significance, collective evaluation of associations between facial attractiveness and human performance reveals contradictory characteristics (table 1). When data across different sports are compared, ridiculous arguments can be developed. For instance, one may suggest a genetic mechanism whereby the evolutionary advantage of superior vertical jump [11] is associated with facial attractiveness, as observed in soccer goalkeepers [20]. However, goalkeepers are inferior sprinters [21], which seems evolutionarily unfavourable. Likewise, soccer and ice hockey goalkeepers were statistically more attractive than their teammates [20], yet soccer goalkeepers are relatively tall [11], while ice hockey goalkeepers are relatively short [12]. However, goalkeepers in both sports are consistently less aerobically fit compared to other positions [11,12], which completely contradicts Postma's findings. These anthropometric and performance variables make sense when one considers the focused training and physical demands of the respective sports, but it is nonsensical to extrapolate desirable attributes of sport-specific roles to evolutionary biology and human sexual behaviour.
Likewise, if high testosterone is indeed associated with both facial attractiveness and athletic performance, all of Postma's TDF athletes would be expected to be quite unattractive, as cycling training has been demonstrated to reduce testosterone levels in professional cyclists [22] and elite amateur cyclists have lower testosterone levels than untrained controls [23]. If there is an underlying linkage between genes associated with endurance performance and facial attractiveness, one would expect NFL quarterbacks to have a completely different genetic profile (and thus muscle fibre phenotype) from TDF athletes and thus opposing levels of attractiveness. One could potentially justify these differences by suggesting that the relationship between facial features and fitness is unique within a given sport; however, this furthers the case that such findings cannot be applied to the human population as a whole and therefore are not valid for studying evolution.
6. Conclusion
Much as beauty is only skin deep, and the biological relevance and scientific rigor behind studies reporting links between facial attractiveness and fitness are superficial. While it remains possible that there are evolutionary links between seemingly unrelated features such as facial morphology and human physical performance, methodological limitations and weak correlations preclude current studies from providing sufficient support to any evolutionary theory. To improve our understanding of evolutionary biology in this realm:
(1) Scientists should be interested in biological meaningfulness (i.e. per cent of shared variance) of variables, rather than solely their statistical significance.
(2) Effect size statistics and their 95% CIs for correlation and regression should always be presented.
(3) Measures of physical fitness/athletic performance must be objective for the given individual, and not dependent on other/multiple individuals.
(4) Theories relating athletic performance to morphology must be built on direct measurable relationships, rather than multiple assumptions and indirect connections.
(5) Heterogeneous samples must be examined to ensure that results are applicable to the broader human population and are not confined to a specific level, position and/or sport.
Competing interests
J.M.S. and G.S.Z. have no competing interests, financial or otherwise, to declare.
Funding
J.M.S. and G.S.Z. did not receive any external funding in relation to this manuscript.
References
- 1.Hönekopp J, Bartholomé T, Jansen G. 2004. Facial attractiveness, symmetry, and physical fitness in young women. Hum. Nat. 15, 147–167. ( 10.1007/s12110-004-1018-4) [DOI] [PubMed] [Google Scholar]
- 2.Hönekopp J, Rudolph U, Beier L, Liebert A, Muller C. 2007. Physical attractiveness of face and body as indicators of physical fitness in men. Evol. Hum. Behav. 28, 106–111. ( 10.1016/j.evolhumbehav.2006.09.001) [DOI] [Google Scholar]
- 3.Williams KM, Park JH, Wieling MB. 2010. The face reveals athletic flair: better National Football League quarterbacks are better looking. Pers. Indiv. Differ. 48, 112–116. ( 10.1016/j.paid.2009.09.003) [DOI] [Google Scholar]
- 4.Postma E. 2014. A relationship between attractiveness and performance in professional cyclists. Biol. Lett. 10, 20130966 ( 10.1098/rsbl.2013.0966) [DOI] [PMC free article] [PubMed] [Google Scholar]
- 5.Fink B, Neave N, Seydel H. 2007. Male facial appearance signals physical strength to women. Am. J. Hum. Biol. 19, 82–87. ( 10.1002/ajhb.20583) [DOI] [PubMed] [Google Scholar]
- 6.Population Reference Bureau. 2014. World population data sheet. Washington, DC: United States Agency for International Development. [Google Scholar]
- 7.Fernandez-Garcia B, Perez-Landaluce J, Rodriguez-Alonso M, Terrados N. 2000. Intensity of exercise during road race pro-cycling competition. Med. Sci. Sports Exerc. 32, 1002–1006. ( 10.1097/00005768-200005000-00019) [DOI] [PubMed] [Google Scholar]
- 8.2014. ACSM's guidelines for exercise testing and prescription, 9th edn Baltimore, MD: Lippincott Williams & Wilkins. [Google Scholar]
- 9.Santalla A, Earnest CP, Marroyo JA, Lucia A. 2012. The Tour de France: an updated physiological review. Int. J. Sports Physiol. Perform. 7, 200–209. [DOI] [PubMed] [Google Scholar]
- 10.Pryor JL, Huggins RA, Casa DJ, Palmieri GA, Kraemer WJ, Maresh CM. 2014. A profile of a National Football League team. J. Strength Cond. Res. 28, 7–13. ( 10.1519/JSC.0000000000000303) [DOI] [PubMed] [Google Scholar]
- 11.Ziv G, Lidor R. 2011. Physical characteristics, physiological attributes, and on-field performances of soccer goalkeepers. Int. J. Sports Physiol. Perform. 6, 509–524. [DOI] [PubMed] [Google Scholar]
- 12.Quinney HA, Dewart R, Game A, Snydmiller G, Warburton D, Bell G. 2008. A 26 year physiological description of a National Hockey League team. Appl. Physiol. Nutr Metab 33, 753–760. ( 10.1139/H08-051) [DOI] [PubMed] [Google Scholar]
- 13.Kunimasa Y, Sano K, Oda T, Nicol C, Komi PV, Locatelli E, Ito A, Ishikawa M. 2014. Specific muscle–tendon architecture in elite Kenyan distance runners. Scand. J. Med. Sci. Sports 24, e269–e274. ( 10.1111/sms.12161) [DOI] [PubMed] [Google Scholar]
- 14.White CV, Berry S. 2002. Tiered polychotomous regression: ranking NFL quarterbacks. Am. Stat. 56, 10–21. ( 10.1198/000313002753631312) [DOI] [Google Scholar]
- 15.Taylor R. 1990. Interpretation of the correlation coefficient: a basic review. J. Diagn. Med. Sonogr. 1, 35–39. ( 10.1177/875647939000600106) [DOI] [Google Scholar]
- 16.Nakagawa S, Cuthill IC. 2007. Effect size, confidence interval and statistical significance: a practical guide for biologists. Biol. Rev. Camb. Philos. Soc. 82, 591–605. ( 10.1111/j.1469-185X.2007.00027.x) [DOI] [PubMed] [Google Scholar]
- 17.Møller AP, Jennions MD. 2002. How much variance can be explained by ecologists and evolutionary biologists? Oecologia 132, 492–500. ( 10.1007/s00442-002-0952-2) [DOI] [PubMed] [Google Scholar]
- 18.Nuzzo R. 2015. How scientists fool themselves—and how they can stop. Nature 526, 182–185. ( 10.1038/526182a) [DOI] [PubMed] [Google Scholar]
- 19.Lefevre CE, Lewis GJ, Perrett DI, Penke L. 2013. Telling facial metrics: facial width is associated with testosterone levels in men. Evol. Hum. Behav. 34, 273–279. ( 10.1016/j.evolhumbehav.2013.03.005) [DOI] [Google Scholar]
- 20.Park JH, Buunk AP, Wieling MB. 2007. Does the face reveal athletic flair? Positions in team sports and facial attractiveness. Pers. Indiv. Differ. 43, 1960–1965. ( 10.1016/j.paid.2007.05.020) [DOI] [Google Scholar]
- 21.Haugen T, Tonnessen E, Hisdal J, Seiler S. 2014. The role and development of sprinting speed in soccer. Int. J. Sports Physiol. Perform. 9, 432–441. ( 10.1123/ijspp.2013-0121) [DOI] [PubMed] [Google Scholar]
- 22.Chennaoui M, Gomez-Marino D, Drogou C, Bourrilhon C, Sautivet S, Guezennec CY. 2004. Hormonal and metabolic adaptation in professional cyclists during training. Can. J. Appl. Physiol. 29, 714–730. ( 10.1139/h04-046) [DOI] [PubMed] [Google Scholar]
- 23.Izquierdo M, Ibanez J, Hakkinen K, Kraemer WJ, Ruesta M, Gorostiaga EM. 2004. Maximal strength and power, muscle mass, endurance and serum hormones in weightlifters and road cyclists. J. Sports Sci. 22, 465–478. ( 10.1080/02640410410001675342) [DOI] [PubMed] [Google Scholar]