

Abstract
Background
Nonmedical use of pharmaceutical opioid analgesics (POA) increased dramatically over the past two decades and remains a major health problem in the United States, contributing to over 16,000 accidental poisoning deaths in 2010.
Objectives
Create a systems oriented theory/model to explain the historical behaviors of interest, including the various populations of nonmedical opioid users and accidental overdose mortality within those populations. Use the model to explore policy interventions including tamper resistant drug formulations and strategies for reducing diversion of opioid medicines.
Methods
A system dynamics model was constructed to represent the population of people who initiate nonmedical POA usage. The model incorporates use trajectories including development of use disorders, transitions from reliance on informal sharing to paying for drugs, transition from oral administration to tampering to facilitate non-oral routes of administration, and transition to heroin use by some users, as well as movement into and out of the population through quitting and mortality. Empirical support was drawn from national surveys (NSDUH, TEDS, MTF, and ARCOS) and published studies.
Results
Model was able to replicate the patterns seen in the historical data for each user population, and the associated overdose deaths. Policy analysis showed that both tamper resistant formulations and interventions to reduce informal sharing could significantly reduce nonmedical user populations and overdose deaths in the long term, but the modeled effect sizes require additional empirical support.
Conclusion
Creating a theory/model that can explain system behaviors at a systems level scale is feasible and facilitates thorough evaluation of policy interventions.
Introduction
The dramatic increase in nonmedical use of pharmaceutical opioid analgesics (POAs) in the late 1990’s and early 2000’s created an enduring public health challenge for the United States (1). Despite implementation of public health policies and regulations (2), and stabilization of nonmedical POA use (3), the prevalence of negative outcomes, including POA-related overdose deaths, persists (4).
POAs reach consumers through a complex delivery system comprised of many interacting agents: prescribers, patients, people using opioids non-medically, family, and peers. These interactions occur in the context of a policy environment that encompasses laws, regulations, public health policy interventions, and enforcement efforts. In highly connected systems of this nature feedback mechanisms may exist that have the potential to perversely diminish, neutralize or even reverse the influence of interventions (5).
This article presents an exploratory system dynamics simulation model of the complex system surrounding the initiation and nonmedical use of POAs in the United States and the drug use trajectories of people who use POAs nonmedically. In addition to fitting the model to historical trends, the model aims to increase understanding of the complex interactions and underlying processes that give rise to this major public health concern, to identify gaps in the published literature, and to allow for experimentation with policy options.
Background
Prescriptions for POAs increased 10 fold over the last two decades (6). A number of factors contribute to this trend including changing standards and guidelines for treatment of pain, changes in drug formulation, and demographic changes (7,8). This increase occurred in parallel with a rise in nonmedical use of POAs. The 2012 National Survey on Drug Use and Health reports that an estimated 1.9 million individuals initiated nonmedical POA use and 4.9 million individuals used POAs nonmedically within the month prior to the survey (3). The estimated number of people using POAs non-medically in the past 12 months has remained fairly stable since 2002: between 4–5% of the US population (3).
Despite the relative stability of the prevalence of non-medical use of POAs, negative outcomes associated with prescription drug use have continued to rise. Treatment admissions for POAs increased six-fold from 1998 to 2008 (9), emergency department visits involving prescription opioids increased by 153% between 2004 and 2011 (10), and POA-related poisoning deaths increased more than four-fold to 16,651 between 1999 and 2010 (11).
A number of supply-side interventions have been implemented in an attempt to curtail POA abuse and negative outcomes. These include continuing education for clinicians and other FDA-mandated Risk Evaluation and Mitigation Strategies (2), pill take-back programs (12,13), prescription drug monitoring programs (14), and tamper-resistant pills (15,16). Tampering refers to crushing or dissolving a pill in order to snort or inject it. Concern has arisen that faced with supply restriction, people dependent on POAs may switch to heroin because of its similarity to POAs. Anecdotal reports and emerging research suggest that this may be occurring.
Several qualitative studies clearly identify a drug use trajectory that includes initiation to POAs and later transition to heroin (17–19). However, these studies have small sample sizes and estimates of prevalence based on them may not be generalizable. Two studies have reported that a high proportion (65–73%) of heroin users reported use of POAs prior to heroin initiation (20,21). Surveys conducted among intravenous heroin users performed in San Diego, Portland and Seattle provide further evidence of this phenomenon: between 39–47% of respondents 18–40 years of age reported having been “hooked on” POAs before initiating heroin use (22–24). Studies among heroin users with a history of prescription opioid abuse suggest a number of factors influencing transition from POAs to heroin. Respondents have reported that heroin is cheaper (18,20,21,25), more effective (20), gives a better high (21), and is easier to access (21).
Tamper resistant formulations (that make pills harder to crush or dissolve) of extended release opioids may serve to reduce non-oral abuse (26); however, it is not clear what the long term impacts of this intervention will be, nor how the drug use trajectories of POA users might be impacted by policies that produce scarcity of abusable POAs. System dynamics modeling offers a method that leverages existing research in order to explore the behavior of the prescription drug delivery system under circumstances of supply restriction and thereby help to explain historical trends and evaluate the consequences of policy changes.
Method
System dynamics modeling
Policy decisions should be made on the basis of the best available evidence (27). Under the best circumstances evaluation studies are available that look at the efficacy of similar policy changes enacted in other settings. At times the evidence evaluating an intervention or proposed policy may be limited or non-existent, so decisions must be based on existing related research and general domain knowledge. Research in the policy arena has the dual purpose to provide an evidence base for policy decisions (the problem solving function) and a tool for explanation and communication (the enlightenment function) (28). Depending on the policy domain these two roles may be of greater or lesser importance. The behavior of systems that feature feedback among endogenous variables and non-linearity is less intuitive, and thus the explanatory/knowledge translation role of research becomes more important.
Every policy intervention contains an implicit causal hypothesis. The policy maker proposes that the policy change will initiate a chain of causal events that will result in a desired outcome. The challenge of policy making lies in having a sufficient understanding of the underlying processes at work. It can be difficult to estimate the range of probable outcomes of a policy change based on existing research and domain knowledge. Academic research often provides a fine-grained view of specific local conditions and estimates the relationships between a number of variables and a dependent variable. When a policy is enacted the outcome may be dependent on a chain of events compounded over time. Feedback mechanisms may lead to counter-intuitive results. Cognitively we are not well equipped to develop mental models of systems that involve complex highly interdependent sets of variables that change over time.
System dynamics modeling is a tool that allows us to augment our mental models by making the network of relationships that comprise a system manifest in an influence diagram (cf, 5, 29). The influence diagram is a graphical model that provides a high level view of the system. Elements of the model are represented as constants, auxiliary variables (functions), stock variables, and flows (rates). System dynamics models offer an analytical platform for calculating and visualizing the behavior of the modeled system over time (ibid). The behavior is simulated through time by numerical integration of differential equations for the rates of change of the stock variables. System dynamics is often used to study health issues (cf 30, 31, 32, 33).
This type of modelling has several benefits. First, it provides a broad view of the structure of a system that can help explain the underlying processes and feedback loops that generate complex behavior. Second, it can be used to simulate complex feedback relationships that have no analytical solution. Third, the process of constructing such a model provides an opportunity to assess the gaps in our knowledge. System dynamics models require estimated values for all salient components of the system, and empirical support is drawn from many different sources in the literature and from public data sets. In constructing the model, speculative assertions become stated assumptions and limitations, and may be subjected to greater scrutiny and sensitivity testing, including tests to determine which model parameters most strongly influence model behavior and therefore must be estimated as precisely as possible with the best available data and statistical methods.
Model development
System dynamics modeling is comprised of a number of distinct stages (5). Specification of a model defines the overall structure of the dynamical system. Calibration is the fitting of parameter values for the model. Validation is the comparison of model performance to a reference behavior pattern- a new data set that was not used in specifying or calibrating the model.
Developing a system dynamics model has both qualitative and quantitative components. Our model specification process began with interviews with our expert advisory panel- a group of four researchers and practitioners with domain knowledge in the areas of pain medicine (n=2), pharmaceutical abuse liability (n=3), substance abuse (n=2), public health (n=3), and health economics (n=1). The qualitative understanding gained from these interviews provided the initial influence diagram depicting the qualitative connections among variables of interest. This diagram was presented back to the advisory panel to be evaluated for face validity, literally whether the model is consistent with their domain knowledge and understanding of the system. Updates and amendments were made per their recommendations.
Once the structure of the model was established, a literature review was conducted to locate sources of empirical support for the relationships represented in the model. At this stage in the modeling process the wealth of research in the field becomes the raw data used to calibrate a model. Research from the large body of published literature was synthesized to estimate parameter values. When estimates of incidence from cohort studies or measures of correlation are in the right form they can be used to provide direct empirical support for a parameter, otherwise a parameter value may be estimated indirectly.
Best practices in simulation research require that the conceptual structure of a simulation be driven by the research question rather than data availability (34).Thus, it is inevitable in simulation studies that not all parameters or structural relationships can be fully supported empirically (35). In this study, where empirical support was lacking experts were consulted, proxy measures were employed, and parameters were defined through model calibration.
The model was implemented in Vensim (36), the industry standard system dynamics software (cf 5, 27, 29) and calibrated to reproduce historical behavior. Large national surveys and data sets—the National Survey on Drug Use and Health (NSDUH), Treatment Episode Data Set (TEDS), Monitoring the Future (MTF), and the Automation of Reports and Consolidated orders System (ARCOS) —provided data against which the results of the model could be compared. System dynamics models can be highly sensitive to initial conditions for stock variables, and while reliable data are available for some of the stock variables, others had to be estimated as part of the calibration process. Once calibrated, mean percentage error between model-calculated values and reference data was 8–12% for the # of people initiating POA misuse, # of POA misusers, # of heroin users, POA deaths, and heroin deaths (see Figures 4, 6, and 7 for details. These errors were judged to be small enough to warrant proceeding to use the model to explore and compare policy interventions.
Figure 4.
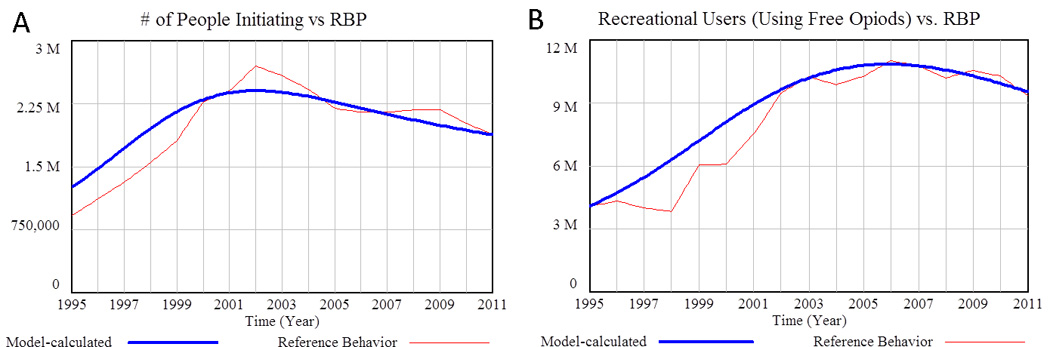
Initiation of nonmedical POA use and the number of Recreational Users (Using Free Opioids). A) Model-calculated number of people initiating nonmedical POA usage over time compared to the reference data (Mean Absolute Percentage Error = 6.6%). B) Model calculated Recreational Users (Using Free Opioids) over time compared to reference data (MAPE = 11.5%). Source: National Household Survey on Drug Abuse (NHSDA) 1995–2001, NSDUH 2002–2011. (68,69)
Figure 6.
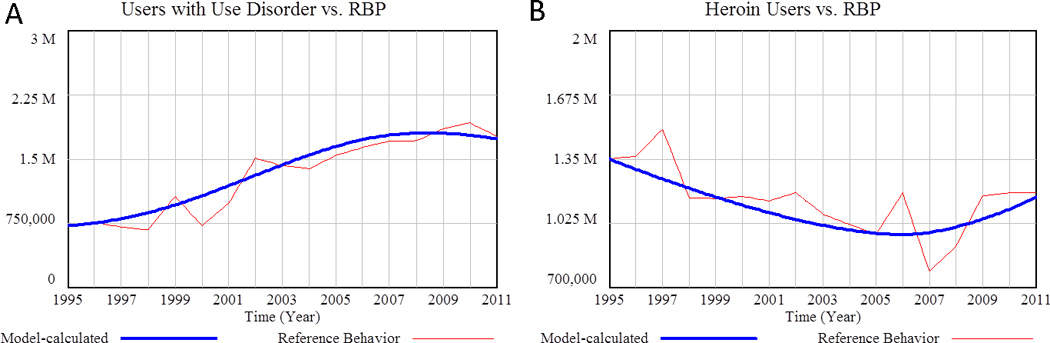
A) Model calculated number of users with use disorder compared to reference data (Mean Absolute Percentage Error = 10.7%).. Source: NHSDA1995-2001, NSDUH 2002–2011. (3,68) B) Model-calculated number of heroin users versus reference data (MAPE = 7.9%). Source: Office of National Drug Control Strategy 1988–2000, 2000–2006, NSDUH (2012) (69–71)
Figure 7.
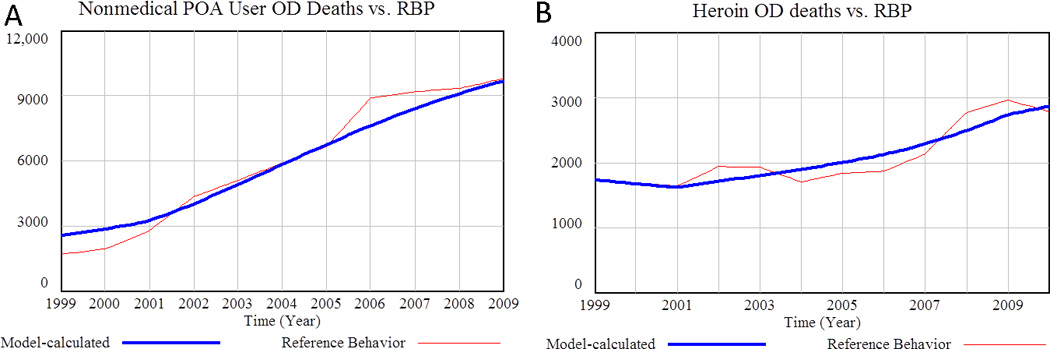
Deaths associated with POAs and heroin vs. reference behavior (Mean Absolute Percentage Error = 12.6%).. A) Model calculated deaths associated with nonmedical POA use vs reference data (MAPE = 7.1%). Source: National Vital Statistics System (NVSS) 1999–2009 (11). B) Model calculated heroin-related deaths vs. reference data. Source: NVSS 1999–2010
This article describes three supply-side interventions—introducing tamper resistant formulations, reducing medicine sharing via patient education or smaller prescription sizes, and implementing drug take-back days.
Model structure and logic
Figure 1 provides a high level picture of model structure which highlights the feedback processes at work in the system. Feedback processes exist when outcomes end up influencing inputs, resulting in circular rather than linear causality. Fundamentally, the POA story is as follows: POA misuse follows a trajectory in which people may initiate nonmedical use, may transition to paying for opioids and tampering with them, and finally may transition to heroin use.
Figure 1.
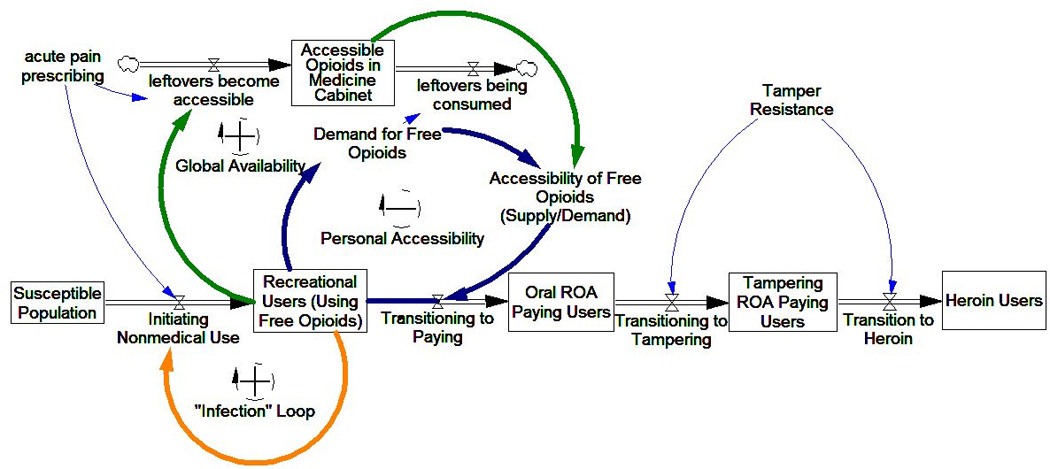
Simplified influence diagram of POA supply impact on POA user trajectories. Three main feedback mechanisms impact user trajectories: Infection and Global Availability tend to increase initiation, while Personal Accessibility tends to drive transition to paying and riskier use.
The POA drug misuse trajectory is influenced by the availability, accessibility, and physical properties of the POA supply; and at any point in the trajectory, people may quit or die. To aid in understanding the entire model with its multiple feedback loops, we focus on its sectors: peer initiation, global availability, personal accessibility, and transition to tampering and heroin use. The description of each sector includes an outline of empirical support, a narrative description of model elements and structure, and a simplified influence diagram. A full model diagram is provided as a supplemental figure.
Peer Initiation
Empirical studies endorse peer influence, exposure via legitimate prescription, and social exposure as factors in drug use initiation (19,37). These recruitment mechanisms, shown in Figure 2, are modeled using a “susceptible, infected, recovered” (SIR) epidemic framework (5). In SIR epidemic models, an infected person interacts with susceptible individuals based on a contact rate. The infectivity of the disease is the likelihood that contact results in infection. When the number of infected individuals becomes large, members of the susceptible group are likely to have multiple contacts with infected people, and the rate of infection grows, resulting in an epidemic.
Figure 2.
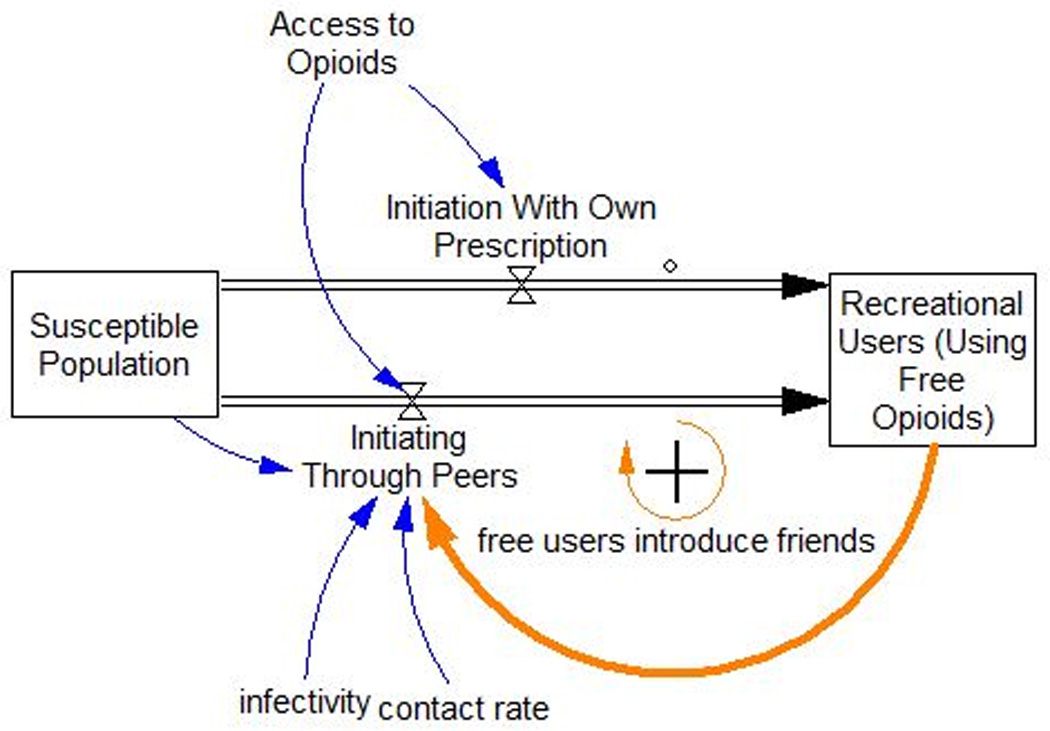
Nonmedical POA initiation as an infection process plus initiation due to exposure by having a prescription. Current nonmedical users may introduce peers to nonmedical use, or a person with a prescription may initiate use outside of a social recruitment process.
The SIR model framework can also be applied to peer initiation processes (5). In this instance, susceptible individuals are those who have never used opioids nonmedically. When susceptibles interact with Recreational Users (Using Free Opioids), the idea of using opioids recreationally may spread. After exposure, the susceptible person may initiate POA use depending on the how compelling the idea is—its “infectivity.” An increase in the number of Recreational Users increases the rate of initiation, further increasing the number of Recreational Users, and so on. This type of growth process is known as a reinforcing feedback loop.
In the typical SIR infectious disease model, people who recover from infection are not susceptible to reinfection nor do they spread the disease. Similarly, in the present model, not all nonmedical POA users participate in the peer recruitment process that influences susceptibles to initiate nonmedical usage. Once a misuser develops a use disorder and begins using more than he or she can obtain for free, this person is assumed not to interact significantly with susceptibles (38–40). Use disorder is associated with frequency and/or intensity of use, and could involve the normal oral route of administration (ROA) or snorting or intravenous injection. These other ROAs require tampering with the pills to crush them or dissolve them. Users with use disorder include Oral ROA Paying Users, and Tampering ROA Paying Users in Figure 1.
Global Availability
To initiate POA use, a susceptible must have exposure to the idea of POA use and have access to POAs. Figure 3 describes the relationship between the supply of free POAs in medicine cabinets, and the progression of users from casual use of free POAs, to development of a use disorder, to paying for POAs.
Figure 3.
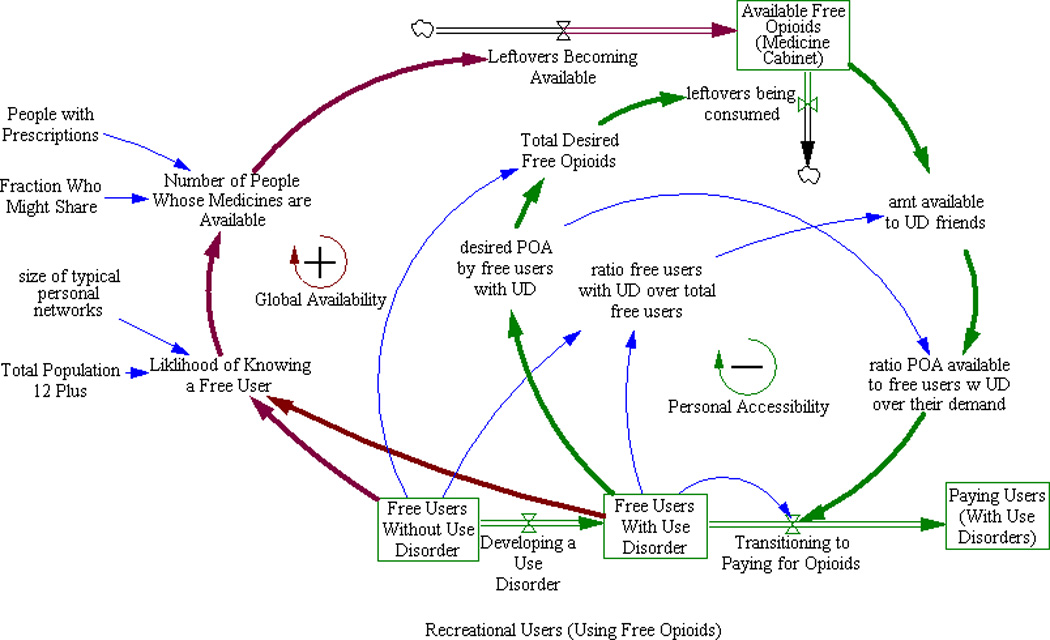
Impact of informal shared “Medicine Cabinet” supply on user progression to paying POA. People who want to use POA nonmedically “open up” the available supply by requesting POA from friends and family, increasing available POA supply, but also consume these medicines, thereby limiting available supply.
Informal sharing of POAs is the source of POAs for the majority of nonmedical users; 70% of respondents to the 2010 NSDUH indicated that they received POAs from friends or relatives (41). A recent study of people who use POAs nonmedically found that most individuals did not have to venture outside of their social networks to find people who would share pills (42). Leftover medicine from prescriptions are likely implicated in diversion (43). Diversion refers to medicines being made available for nonmedical use. Another study found that 42% of POAs prescribed were not consumed, 67% of patients had leftover medicine, and 91% of the patients with leftover medicine did not dispose of it (44). A recent survey of college students found that 35% had diverted POAs (45).
The outermost arrows in Figure 3 represent the global dynamics of opioid availability: much of the leftover POA supply is not accessible because prescription holders may have no desire to use POAs nonmedically or know anyone who does. As the population of Recreational Users seeking free POAs increases (boxed variables at the bottom of Figure 3), the likelihood that a prescription holder will be approached by at least one friend requesting free diverted POAs increases dramatically. Some fraction of prescription holders approached will choose to share. Their leftover medicine becomes “Available Free POA Medicine Cabinet” supply (boxed variable at the top of Figure 3). In short, increased initiation leads to increased accessibility of leftover POAs which further increases initiation and the population of Recreational Users and “opens up” more sharing. This completes a second reinforcing feedback loop.
Personal accessibility
Frequent use of pharmaceutical opioids can lead to the development of opioid use disorders (46) and consumption levels that cannot be sustained by free leftover medicines prescribed to those in one’s personal network. Research indicates that students who screened positive for a substance use disorder were more likely to buy POAs and obtain them from multiple sources (47) and that paying money for POAs was associated with more frequent use (42).
The inner arrows shown in Figure 3 also show the local dynamics of opioid availability, which operate differently than the global dynamics. A fraction of Free Users Without Use Disorder develop an opioid use disorder (Free Users With Use Disorder in Figure 3). These users exhaust the free supply of opioids accessible in their social networks and may transition to paying for POAs. Although increasing the number of people using free POAs further opens up supply globally, increased consumption by Free Users With Use Disorder reduces free supply of POAs locally. Consequently, Transitioning to Paying for Opioids increases and Free Users With Use Disorder decreases. In short, as the increase in available medications results in more use disorder, individual availability is diminished resulting in individuals transitioning to paying for pills. These individuals no longer participate in the peer influence process resulting in a decrease in availability and initiation. This type of self-limiting process is referred to as a balancing feedback loop.
Transition to tampering and heroin use
The literature on the association between paying for POA and tampering is sparse, but a recent study found that people who pay for POA are 1.5 times more likely to snort POAs (42). While most recreational users use the oral ROA (40), most experienced abusers tamper with POAs to increase the subjective effects (49–51). Length of time abusing POAs and use disorders are associated with higher prevalence of non-oral ROAs (51,52). A study of people abusing POAs found that those who also used heroin were less likely to use POA orally and more likely to snort, smoke or inject POAs (53). People who transition from POAs to heroin give many reasons for doing so, including inability to access their POA of choice (21). While many heroin users first initiated POAs (17,20,21,23,24), this is not always the case. A recent cohort analysis showed that older heroin abusers tended to initiate heroin use before POA use (54).
In the model, people who pay for POAs fall into two groups, Oral ROA Paying Users and Tampering ROA Paying Users (see Figure 1). Paying users begin with oral ROA and may transition to tampering, and of those who tamper with POAs some may transition to heroin use. The model assumes that transition directly from oral abuse to heroin use is negligible, consistent with empirical studies (53). Transition from Tampering ROA Paying Users to Heroin Users increases when trafficked supply of POAs decreases. Trafficked means a “dealer” is involved and drugs are paid for with money or trade. Trafficked supply availability is an exogenous input to the model that was derived from a dynamic model of medical POA use and trafficking (55), and is consistent with anecdotal evidence reported in the popular press (e.g. 56). Other pathways to heroin use are modeled simply as a single additional inflow to the heroin user population.
Model Calibration and Testing
Making a computational version of the model could be viewed as creating an elaborate “theory” for how the system actually “works.” Calibrating the model to endogenously reproduce the dynamic behaviors of this complex nonlinear system at multiple points (number of new users per year, user population levels, and overdose deaths) is not an easy task, and therefore, once it has been shown that the theory/model can in fact reproduce these reference behaviors, the the model can be considered ready to be used to explore policy options. In the section that follows, we first show the comparisons of model-calculated behavior to reference data, and then report policy analysis results.
Comparison of model-calculated results to reference data
Beginning with the initiation process, Figure 4 shows the number of model-calculated new initiates and Recreational (using Free Opioids) Users compared to data from the annual NSDUH survey.
Figure 5 shows the number of nonmedical users with use disorder at each stage of the progression: Free Users with Use Disorder, Oral ROA Paying Users, and Tampering ROA Paying Users.
Figure 5.
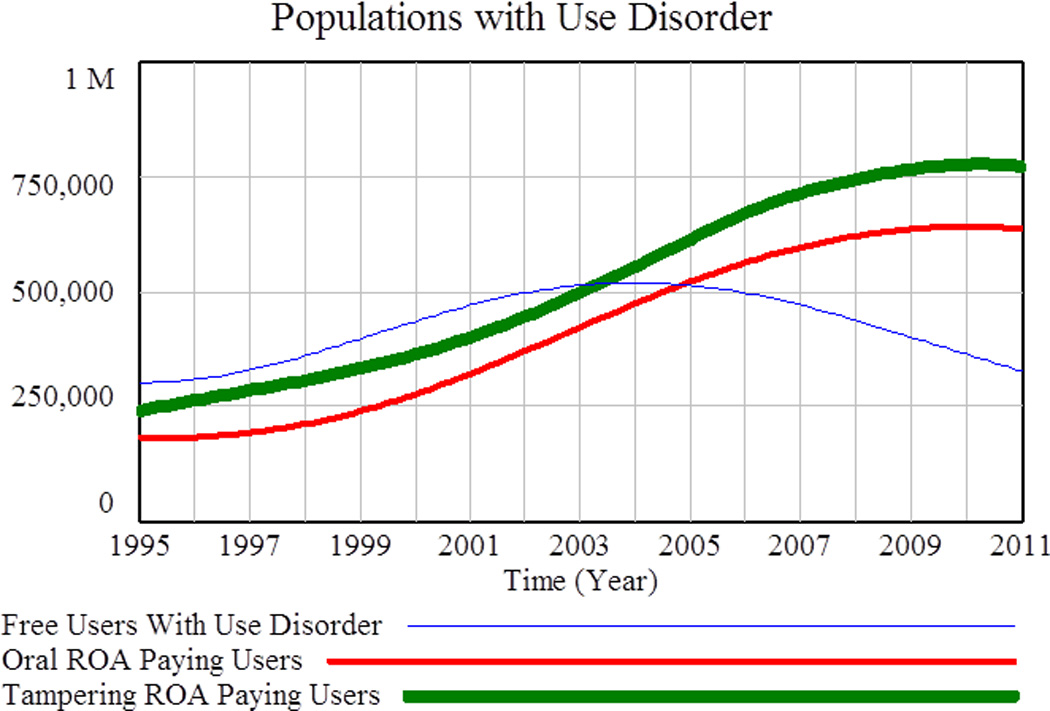
Populations with Use Disorder. Nonmedical users with use disorder at each stage of the progression from “Free Users with Use Disorder, to Oral ROA Paying Users to Tampering ROA Paying Users.
The final user transition represented in the model is from Tampering ROA Paying Users to Heroin Users. Figure 6 shows model-calculated populations versus reference data for the number of POA users with use disorder (total of the populations in Figure 5) and for Heroin Users.
Figure 7 shows model calculated deaths associated with nonmedical POA use and with heroin use compared to reference data. In order for the model to accurately calculate death figures consistent with reference data, it was necessary to incorporate a multiplier representing increasing mortality rates over time (from 1 prior to 2000, to 2.5 in 2011 and later). This ramp up is primarily attributed to a trend toward increased usage of multiple drugs (poly drug use) by all categories of nonmedical users (49,50), and an increase in the proportion of high dosage opioid users.
Exploration of policy interventions
Once the model had been calibrated to reproduce reference behavior, it was used to explore the impact of policies implemented in mid-2010 and evaluated over the period from 2011 to 2016 since it can take several years for the even short-term impacts of policy changes to manifest.
Tamper resistant drug formulations
A very simple analysis was done to assess the effectiveness and potential side effects that might result from the introduction of tamper resistant (TR) formulations of POAs. We assume that tamper resistant formulations do not significantly impact Recreational Users who tend to take the pills orally (48), and relatively infrequently (34). We also assume that transition from oral use of POAs directly to heroin is negligible (53). Given these assumptions, it follows that the main effects of TR would be to inhibit the transition from oral use to tampering with POAs and to accelerate the transition of Tampering ROA Paying Users to heroin use. The degree of inhibition and the degree of acceleration are inversely related and symmetric: if half the POAs are TR, then transition to tampering is reduced by a factor of two and transition from tampering to heroin is doubled.
The rollout of TR POAs was modeled very simply as the fraction of POAs that are tamper resistant, which increases over time. The fraction is zero prior to the middle of 2010, when a TR formulation of Oxycontin® was first introduced (26). In order to cut the number of Tampering ROA Paying Users in half by 2016, the upper limit was set to 70% over the six-year policy exploration period. Table 1 shows projected changes in Paying Users and heroin users, and the impact on overdose deaths.
Table 1.
Impact of 70% tamper resistant formulations market penetration over a six-year period on prevalence and overdose (OD) deaths
| 2010 | 2016 baseline |
2016 with policy |
% change | |
|---|---|---|---|---|
| Oral ROA Paying Users | 1,002,000 | 731,000 | 893,000 | +22% |
| Tampering ROA Paying Users | 775,000 | 693,000 | 363,000 | −48% |
| Heroin Users | 1,097,000 | 1,441,000 | 1,585,000 | +10% |
| Total Projected OD Deaths 2011– 2016, Oral ROA Paying Users |
11,020 | 11,880 | +8% | |
| Total Projected OD Deaths 2011– 2016, Tampering ROA Paying Users |
14,370 | 11,850 | −18% | |
| Total Projected OD Deaths 2011– 2016, Heroin Users |
17,100 | 17,800 | +4% |
Assuming it is true that nonmedical users with use disorder are likely to either remain oral abusers or switch to heroin, the net benefits in terms of accidental deaths would seem to be modest overall—perhaps 1000 lives saved. The population of Tampering ROA Paying Users is quickly reduced. Many switch to heroin in the short term, but the effect is transitory. Once the population of Tampering ROA Paying Users declines, the flow from tampering to heroin is also reduced. The population of Oral ROA Paying Users increases in this scenario because fewer oral users transition to tampering. The overdose (OD) mortality rate for oral users is assumed to be lower (59), so a decrease in mortality is expected.
Informal sharing supply interventions
Two policy interventions focused on reducing informal sharing were then tested: 1) removing 100 million dosage units of POAs available for nonmedical use per year through drug take-backs, and 2) reducing sharing of leftovers by 50%. The magnitudes of each policy scenario were selected to illustrate plausible upper limits for the potential impact rather than realistic implementation scenarios. DEA drug take back events have collected about 503 tons (roughly 10 billion pills) of unwanted medicine per year since 2010 (60). Gray and Hagemeier (2012) found that 10% of disposed medicines were controlled substances at take back events in Appalachian areas (12). If just 1% of all disposed medicines were POAs, then removal of 100 million dosage units of POAs from the free nonmedical POA supply per year would be quite feasible.
The amount of leftover medicine per prescription could be reduced after the fact by educating patients about risks, safe storage, and safe disposal, or at the point of prescription by shortening the length of prescriptions, restricting refills, and/or reclassifying medicines such as hydrocodone from Schedule III to Schedule II (61). Two parameters in the model are relevant; the “fraction who might share” and the “typical leftover percentage” (see Figure 3). We model a 50% reduction in new leftovers becoming available for nonmedical use by reducing each parameter by 25%. Unfortunately, to date no studies have been published on the impact of patient centered interventions on medication sharing (62), so the modeled magnitude of impact is speculative. Figure 8 shows how such a change in informal sharing of leftovers and drug take backs impact the nonmedical POA user populations in the model.
Figure 8.
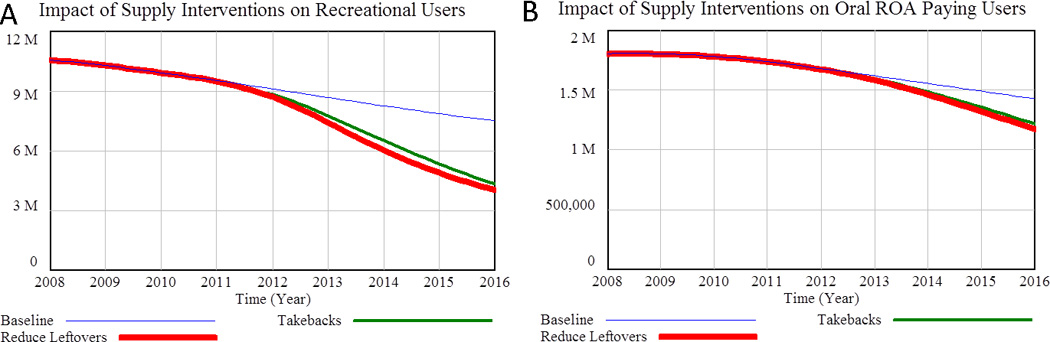
Impact of reduced informal sharing/leftovers and drug take-backs on A) recreational users and B) Oral ROA Paying Users. Tampering ROA Paying Users and Heroin Users are not shown because the model indicates that the impact of reducing the informal POAsupply would have neglible impact on these populations over the policy period.
As shown in Figure 8, model results suggest that reducing the fraction of people willing to share and/or the amount of leftover medicine could significantly reduce user populations over time. Patient education and drug take-backs days appear to have nearly the same potential. Table 2 provides additional details, including the likely impact on overdose deaths. Although the effect on the population of Tampering ROA Paying Users is small, it does begin to shrink by the end of the policy period as reduced initiation upstream reduces all of the user populations eventually. During most of the policy period, however, the number of Tampering ROA Paying Users is elevated because in the near term supply restriction drives people with use disorder to paying for POAs and risker behaviors. Cumulative OD deaths for this population over the policy period rise slightly above baseline.
Table 2.
Impact of 50% reduction in leftover medicine on prevalence and overdose (OD) deaths
| 2010 | 2016 baseline |
2016 with policy |
% change | |
|---|---|---|---|---|
| Recreational Users | 9,923,000 | 7,502,000 | 4,037,000 | −46% |
| Oral ROA Paying Users | 1,002,000 | 732,000 | 489,000 | −33% |
| Tampering ROA Paying Users | 775,000 | 693,000 | 683,000 | −1.4% |
| Total Projected OD Deaths 2011– 2016, Recreational Users |
23,080 | 18,780 | −19% | |
| Total Projected OD Deaths 2011– 2016, Oral ROA Paying Users |
11,020 | 9,790 | −11% | |
| Total Projected OD Deaths 2011– 2016, Tampering ROA Paying Users |
14,370 | 14,600 | +1.5% |
Combining tamper resistant formulations and reduced informal supply in the model leads essentially to the two sets of benefits being added together, since the interventions mostly impact different populations. Another possible strategy could be to combine policies to reduce sharing/leftovers with drug take-back programs. The model shows that if both interventions were successfully implemented, but at half of their presumed standalone effectiveness, the net impact would be comparable. A potential benefit of such a strategy could be to avoid the diminishing returns that might tend to plague a single-pronged strategy.
Discussion
Although the model logic for the tamper resistant (TR) drug formulation analysis was defined in an abstract fashion, it may in fact approximate how the intervention is being implemented—as a linear increase over a several-year period. There are many POA products, and pharmaceutical companies are working to develop and gain approval for new TR formulations (63). This process takes time. While TR formulations significantly reduce tampering of POAs, a major policy concern is possible “balloon effects” users changing their ROA, or switching to other drugs, especially heroin. In the model, heroin use does increase, though perhaps less than might be expected (+10%); the larger effect is on Oral ROA Paying Users (+22%). Thus, the net result for the TR policy is quite modest--a 6% reduction in OD deaths amongst the affected populations over the policy period. Another reason for the modest impact is that the TR policy as modeled does not reduce OD deaths associated with the largest population of nonmedical POA users (and therefore is not shown in Table 1) Recreational Users. Recreational Users are subject to OD mortality risk and these users account for 47% of the total OD deaths in the baseline model for the 2011–2016 policy period. We assume that TR formulations do not impact these users appreciably because the overwhelming majority take the pills orally (59,64). Unless TR formulations could somehow reduce OD mortality risk for recreational users who do not tamper with POAs, the rate of ODs in this population may remain unchanged. This may explain in part why actual OD deaths have continued to rise despite the introduction of multiple TR POA products including OxyContin® and Opana®.
Our analysis suggests that reducing leftover medicines could reduce all nonmedical POA user populations and OD deaths in the long run, to a greater degree than tamper-resistant drug formulations. Our model, in concordance with results from an analysis of NSDUH survey data conducted by Jones (2012), supports a cohort theory for the increase in negative outcomes (65). The dramatic increase in nonmedical POA initiation witnessed in the late nineties and early 2000s resulted in lagged increases in dependence, transition to tampering or heroin use, and OD deaths. Interventions that discourage initiation of nonmedical or support early quitting have high leverage precisely because they result in lagged reductions in all nonmedical user populations including those with high risk of OD death. To date the effectiveness of policies to reduce leftovers and the impact on nonmedical POA use have not been systematically studied and remain speculative, whereas tamper resistant formulations have already reached the market and post-marketing surveillance results are encouraging if not conclusive (26, 66, 67). However, since this intervention primarily reduces risks for nonmedical users who have already transitioned to riskier usage, the overall scale of the benefits is limited by their relatively smaller population numbers. Our model supports a diverse approach—interventions that impact larger populations which are at lower risk may result in long-term benefits due to a cohort effect, and interventions that impact populations at greater risk may save lives in the short term while we wait for long-term effects to accrue.
Study Limitations
Limitations include the complexity of the model, the scarcity of data regarding some aspects of the overall system, which required assumptions that lack empirical support, albeit with oversight from a knowledgeable panel. Some crucial assumptions in this model include:
Paying users are assumed to be socially isolated from susceptible individuals
Drug take-backs do not affect only those who never share their medicine, and
Oral Paying POA Users first tamper with POAs before switching to heroin
Another limitation is the six-year policy period. While this may seem to be a generous length of time to evaluate the effectiveness of policy changes, it is not long enough for cohort effects to be fully revealed. On the other hand, drug abuse and drug policy occur in a highly dynamic environment, which tends to lessen the credibility of extrapolations beyond a few years.
In conclusion, we believe we have provided evidence that the creation of an overall system-level theory of drug diversion and abuse is feasible and that such models can deepen understanding and facilitate policy evaluation.
Supplementary Material
Acknowledgements
We gratefully acknowledge support from NIH/NIDA grant 5R21DA031361-02 and from our key collaborators, Dennis McCarty, PhD and Neal Wallace, PhD. We also very much appreciate the guidance and oversight provided by other members of our expert advisory panel, Lynn Webster, MD, and Aaron Gilson, PhD. We also acknowledge graduate students Amanuel Zimam, Christan Echt, and Teresa Schmidt for their help in locating data resources and relevant literature.
Declaration of Interest
Support was provided by NIH/NIDA grant 5R21DA031361-02
References
- 1.Substance Abuse and Mental Health Services Administration. Results from the 2005 national survey on drug use and health: national findings [Internet] Rockville: Department of Health and Human Services; 2006. [Google Scholar]
- 2.Food and Drug Administration. Extended-release (er) and long-acting (la) opioid analgesics risk evaluation and mitigation strategy (rems) [Internet] 2013 Apr 15; [Google Scholar]
- 3.Substance Abuse and Mental Health Services Administration. Results from the 2012 national survey on drug use and health: summary of national findings [Internet] 2013 [Google Scholar]
- 4.Centers for Disease Control and Prevention. Prescription drug abuse and overdose: public health perspective [Internet] 2012. [Google Scholar]
- 5.Sterman J. Business Dynamics: Systems Thinking and Modeling for a Complex World. Boston: Irwin/McGraw-Hill; 2000. [Google Scholar]
- 6.Centers for Disease Control and Prevention (U.S.) Unintentional drug poisoning in the united states. [Internet] 2010. [Google Scholar]
- 7.Roper Starch Worldwide. Chronic pain in america: roadblocks to relief. Am Acad Pain Med Am Pain Soc Janssen Pharm EUA. 1999 [Google Scholar]
- 8.Institute of Medicine (U.S.) Committee on Advancing Pain Research C. Relieving Pain in America a Blueprint for Transforming Prevention, Care, Education, and Research [Internet] Washington, D.C.: National Academies Press; 2011. [PubMed] [Google Scholar]
- 9.Substance Abuse and Mental Health Services Administration, Center for Behavioral Health Statistics and Quality. Highlights of the 2011 drug abuse warning network (dawn) findings on drug-related emergency department visits [Internet] Rockville, MD: 2013. [PubMed] [Google Scholar]
- 10.Substance Abuse and Mental Health Services Administration. Drug abuse warning network (dawn) [Internet] 2012 [PubMed] [Google Scholar]
- 11.Chen LH, Hedegaard H, Warner M. Quickstats: number of deaths from poisoning, drug poisoning, and drug poisoning involving opioid analgesics—united states, 1999–2010. Morb Mortal Wkly Rep. 2013;62(12):234. [Google Scholar]
- 12.Gray JA, Hagemeier NE. Prescription drug abuse and dea-sanctioned drug take-back events: characteristics and outcomes in rural appalachia. Arch Intern Med. 2012;172(15):1186–1187. doi: 10.1001/archinternmed.2012.2374. [DOI] [PubMed] [Google Scholar]
- 13.Drug Enforcement Administration. Dea’s fifth national prescription drug take-back day results in another big haul [Internet] News Release. 2012 [Google Scholar]
- 14.PMP Center of Excellence. Briefing on pmp effectiveness: prescription drug monitoring programs: an effective tool in curbing the prescription drug abuse epidemic [Internet] Brandeis University; 2011. [Google Scholar]
- 15.Mastropietro DJ, Omidian H. Current approaches in tamper-resistant and abuse-deterrent formulations. Drug Dev Ind Pharm. 2013;39(5):611–624. doi: 10.3109/03639045.2012.680468. [DOI] [PubMed] [Google Scholar]
- 16.Romach MK, Schoedel KA, Sellers EM. Update on tamper-resistant drug formulations. Drug Alcohol Depend. 2013;130(1–3):13–23. doi: 10.1016/j.drugalcdep.2012.12.028. [DOI] [PubMed] [Google Scholar]
- 17.Lankenau SE, Teti M, Silva K, Bloom JJ, Harocopos A, Treese M. Initiation into prescription opioid misuse amongst young injection drug users. Int J Drug Policy. 2012;23(1):37–44. doi: 10.1016/j.drugpo.2011.05.014. [DOI] [PMC free article] [PubMed] [Google Scholar]
- 18.Inciardi JA, Surratt HL, Cicero TJ, Beard RA. Prescription opioid abuse and diversion in an urban community: the results of an ultrarapid assessment. Pain Med. 2009;10(3):537–548. doi: 10.1111/j.1526-4637.2009.00603.x. [DOI] [PMC free article] [PubMed] [Google Scholar]
- 19.Daniulaityte R, Carlson RG, Kenne DR. Initiation to pharmaceutical opioids and patterns of misuse: preliminary qualitative findings obtained by the ohio substance abuse monitoring network. J Drug Issues. 2006;36(4):787–808. [Google Scholar]
- 20.Canfield MC, Keller CE, Frydrych LM, Ashrafioun L, Purdy CH, Blondell RD. Prescription opioid use among patients seeking treatment for opioid dependence. J Addict Med. 2010;4(2):108. doi: 10.1097/ADM.0b013e3181b5a713. [DOI] [PMC free article] [PubMed] [Google Scholar]
- 21.Levy MS. An exploratory study of oxycontin use among individuals with substance use disorders. J Psychoactive Drugs. 2007;39(3):271–276. doi: 10.1080/02791072.2007.10400613. [DOI] [PubMed] [Google Scholar]
- 22.Pollini RA, Banta-Green CJ, Cuevas-Mota J, Metzner M, Teshale E, Garfein RS. Problematic use of prescription-type opioids prior to heroin use among young heroin injectors. Subst Abuse Rehabil. 2011;2(1):173. doi: 10.2147/SAR.S24800. [DOI] [PMC free article] [PubMed] [Google Scholar]
- 23.Peavy KM, Banta-Green CJ, Kingston S, Hanrahan M, Merrill JO, Coffin PO. “hooked on” prescription-type opiates prior to using heroin: results from a survey of syringe exchange clients. J Psychoactive Drugs. 2012;44(3):259–265. doi: 10.1080/02791072.2012.704591. [DOI] [PubMed] [Google Scholar]
- 24.Lindsay Jenkins. Syringe exchange survey: drug use, injection practices, and overdose. Portland, Oregon: Multnomah County Health Department; 2014. May, [Google Scholar]
- 25.Subramaniam GA, Stitzer MA. Clinical characteristics of treatment-seeking prescription opioid vs. heroin-using adolescents with opioid use disorder. Drug Alcohol Depend. 2009;101(1):13–19. doi: 10.1016/j.drugalcdep.2008.10.015. [DOI] [PMC free article] [PubMed] [Google Scholar]
- 26.Butler SF, Cassidy TA, Chilcoat H, Black RA, Landau C, Budman SH, Coplan PM. Abuse rates and routes of administration of reformulated extended-release oxycodone: initial findings from a sentinel surveillance sample of individuals assessed for substance abuse treatment. J Pain Off J Am Pain Soc. 2012 doi: 10.1016/j.jpain.2012.08.008. [DOI] [PubMed] [Google Scholar]
- 27.Sterman JD. Learning from evidence in a complex world. American Journal of Public Health. 2006;96(3) doi: 10.2105/AJPH.2005.066043. [DOI] [PMC free article] [PubMed] [Google Scholar]
- 28.Weiss CH. Research for policy's sake: The enlightenment function of social research. Policy analysis. 1977:531–545. [Google Scholar]
- 29. [accessed 3/2/15]; http://www.systemdynamics.org/what-is-s/
- 30.Homer JB1993. A system dynamics model of national cocaine prevalence. System Dynamics Review. 9(1):49–78. [Google Scholar]
- 31.Homer J, Hirsch G, Milstein B. Chronic illness in a complex health economy: the perils and promises of downstream and upstream reforms. System Dynamics Review. 2007;23(2–3):313–343. [Google Scholar]
- 32.Milstein B, Homer J, Hirsch G. Analyzing national health reform strategies with a dynamic simulation model. American Journal of Public Health. 2010;100(5) doi: 10.2105/AJPH.2009.174490. [DOI] [PMC free article] [PubMed] [Google Scholar]
- 33.Nielsen A, Wakeland W. Dynamic Simulation of the Effect of Tamper Resistance on Opioid Misuse Outcomes. In: Obaidat MS, Filipe J, Kacprzyk J, Pina N, editors. Simulation and Modeling Methodologies, Technologies and Applications. Vol. 256. Springer International Publishing; 2014. pp. 169–181. [Google Scholar]
- 34.Caro JJ, Briggs AH, Siebert U, Kuntz KM. Modeling good research practices—overview a report of the ispor-smdm modeling good research practices task force-1. Med Decis Making. 2012;32(5):667–677. doi: 10.1177/0272989X12454577. [DOI] [PubMed] [Google Scholar]
- 35.Schmidt TD, Haddox JD, Nielsen AE, Wakeland W, Fitzgerald K. Key data gaps regarding the public health issues associated with opioid analgesics. J Behav Health Serv Res. 2014:1–14. doi: 10.1007/s11414-014-9396-9. [DOI] [PMC free article] [PubMed] [Google Scholar]
- 36.Ventana Systems, Inc. [accessed 3/2/15];60 Jacob Gates Road, Harvard, MA 01451. http:\\vensim.com.
- 37.Mui HZ, Sales P, Murphy S. Everybody’s doing it initiation to prescription drug misuse. J Drug Issues. 2014;44(3):236–253. doi: 10.1177/0022042613497935. [DOI] [PMC free article] [PubMed] [Google Scholar]
- 38.Rosenbaum M. Women on Heroin. New Brunswick, NJ: Rutgers University Press; 1981. [Google Scholar]
- 39.Winkler D, Caulkins JP, Behrens DA, Tragler G. Estimating the relative efficiency of various forms of prevention at different stages of a drug epidemic. Socioecon Plann Sci. 2004;38(1):43–56. [Google Scholar]
- 40.Havens JR, Oser CB, Knudsen HK, Lofwall M, Stoops WW, Walsh SL, Leukefeld CG, Kral AH. Individual and network factors associated with non-fatal overdose among rural appalachian drug users. Drug Alcohol Depend. 2011;115(1):107–112. doi: 10.1016/j.drugalcdep.2010.11.003. [DOI] [PMC free article] [PubMed] [Google Scholar]
- 41.Substance Abuse and Mental Health Services Administration. Results from the 2010 national survey on drug use and health: national findings. Rockville: Department of Health and Human Services; 2011. [Google Scholar]
- 42.Daniulaityte R, Falck R, Carlson RG. Sources of pharmaceutical opioids for non-medical use among young adults. J Psychoactive Drugs. 2014;46(3):198–207. doi: 10.1080/02791072.2014.916833. [DOI] [PMC free article] [PubMed] [Google Scholar]
- 43.Compton WM, Volkow ND. Major increases in opioid analgesic abuse in the united states: concerns and strategies. Drug Alcohol Depend. 2006;81(2):103–108. doi: 10.1016/j.drugalcdep.2005.05.009. [DOI] [PubMed] [Google Scholar]
- 44.Bates C, Laciak R, Southwick A, Bishoff J. Overprescription of postoperative narcotics: a look at postoperative pain medication delivery, consumption and disposal in urological practice. J Urol. 2011;185(2):551–555. doi: 10.1016/j.juro.2010.09.088. [DOI] [PubMed] [Google Scholar]
- 45.Garnier LM, Arria AM, Caldeira KM, Vincent KB, O’Grady KE, Wish ED. Sharing and selling of prescription medications in a college student sample. J Clin Psychiatry. 2010;71(3):262–269. doi: 10.4088/JCP.09m05189ecr. [DOI] [PMC free article] [PubMed] [Google Scholar]
- 46.Fishbain DA, Cole B, Lewis J, Rosomoff HL, Rosomoff RS. What percentage of chronic nonmalignant pain patients exposed to chronic opioid analgesic therapy develop abuse/addiction and/or aberrant drug-related behaviors? a structured evidence-based review. Pain Med. 2008;9(4):444–459. doi: 10.1111/j.1526-4637.2007.00370.x. [DOI] [PubMed] [Google Scholar]
- 47.McCabe SE, West BT, Teter CJ, Cranford JA, Ross-Durow PL, Boyd CJ. Adolescent nonmedical users of prescription opioids: brief screening and substance use disorders. Addict Behav. 2012;37(5):651–656. doi: 10.1016/j.addbeh.2012.01.021. [DOI] [PMC free article] [PubMed] [Google Scholar]
- 48.McCabe SE, Cranford JA, Boyd CJ, Teter CJ. Motives, diversion and routes of administration associated with nonmedical use of prescription opioids. Addict Behav. 2007;32(3):562–575. doi: 10.1016/j.addbeh.2006.05.022. [DOI] [PMC free article] [PubMed] [Google Scholar]
- 49.Passik SD, Hays L, Eisner N, Kirsh KL. Psychiatric and pain characteristics of prescription drug abusers entering drug rehabilitation. J Pain Palliat Care Pharmacother. 2006;20(2):5–13. [PubMed] [Google Scholar]
- 50.Hays LR. A profile of oxycontin addiction. J Addict Dis. 2004;23(4):1–9. doi: 10.1300/J069v23n04_01. [DOI] [PubMed] [Google Scholar]
- 51.Butler SF, Black RA, Serrano JM, Wood ME, Budman SH. Characteristics of prescription opioid abusers in treatment: prescription opioid use history, age, use patterns, and functional severity. J Opioid Manag. 2010;6(4):239. doi: 10.5055/jom.2010.0022. [DOI] [PubMed] [Google Scholar]
- 52.Young AM, Havens JR, Leukefeld CG. Route of administration for illicit prescription opioids: a comparison of rural and urban drug users. Harm Reduct J. 2010;7:24. doi: 10.1186/1477-7517-7-24. [DOI] [PMC free article] [PubMed] [Google Scholar]
- 53.Surratt H, Kurtz SP, Cicero TJ. Alternate routes of administration and risk for hiv among prescription opioid abusers. J Addict Dis. 2011;30(4):334–341. doi: 10.1080/10550887.2011.609805. [DOI] [PMC free article] [PubMed] [Google Scholar]
- 54.Kral A, Novak SP, Wenger L, Chu D, Iguchi MY, Bluthenthal R. Which comes first, prescription opiate medications or heroin? Drug Alcohol Depend. 2014;140:e111–e111. [Google Scholar]
- 55.Wakeland W, Nielsen A, Schmidt TD, McCarty D, Webster LR, Fitzgerald J, Haddox JD. Modeling the impact of simulation educational interventions on the use and abuse of pharmaceutical opioids in the united states: a report on initial efforts. Health Educ Behav. 2013 doi: 10.1177/1090198113492767. [DOI] [PMC free article] [PubMed] [Google Scholar]
- 56.Katherine Q Seelye. Heroin in new england, more abundant and deadly. N. Y. Times; 2013. [Google Scholar]
- 57.Substance Abuse and Mental Health Services Administration. Outcomes of drug-related emergency department visits associated with polydrug use. Rockville, MD: Substance Abuse and Mental Health Services Administration; 2012. Jul 12, [Google Scholar]
- 58.Hall AJ, Logan JE, Toblin RL, Kaplan JA, Kraner JC, Bixler D, Crosby AE, Paulozzi LJ. Patterns of abuse among unintentional pharmaceutical overdose fatalities. JAMA J Am Med Assoc. 2008;300(22):2613–2620. doi: 10.1001/jama.2008.802. [DOI] [PubMed] [Google Scholar]
- 59.Katz N, Dart RC, Bailey E, Trudeau J, Osgood E, Paillard F. Tampering with prescription opioids: nature and extent of the problem, health consequences, and solutions. Am J Drug Alcohol Abuse. 2011;37(4):205–217. doi: 10.3109/00952990.2011.569623. [DOI] [PubMed] [Google Scholar]
- 60.Drug Enforcement Administration. Dea’s national prescription drug take-back days meet a growing need for americans [Internet] 2014 http://www.justice.gov/dea/divisions/hq/2014/hq050814.shtml.
- 61.Center for Drug Evaluation and Research. Drug safety and availability - statement on proposed hydrocodone reclassification from janet woodcock, m.d., director, center for drug evaluation and research [Internet] [Google Scholar]
- 62.Beyene KA, Sheridan J, Aspden T. Prescription medication sharing: a systematic review of the literature. Am J Public Health. 2014;104(4):e15–e26. doi: 10.2105/AJPH.2013.301823. [DOI] [PMC free article] [PubMed] [Google Scholar]
- 63.Webster L, MD, St. Marie B, NP, McCarberg B, MD, Passik SD, PhD, Panchal SJ, MD, Voth E., MD Review article current status and evolving role of abuse-deterrent opioids in managing patients with chronic pain. J Opioid Manag. 2011;7(3):235–245. doi: 10.5055/jom.2011.0066. [DOI] [PubMed] [Google Scholar]
- 64.Kirsh K, Peppin J, Coleman J. Characterization of prescription opioid abuse in the united states: focus on route of administration. J Pain Palliat Care Pharmacother. 2012;26(4):348–361. doi: 10.3109/15360288.2012.734905. [DOI] [PubMed] [Google Scholar]
- 65.Jones CM. Frequency of prescription pain reliever nonmedical use: 2002–2003 and 2009–2010. Arch Intern Med. 2012;172(16):1265–1267. doi: 10.1001/archinternmed.2012.2533. [DOI] [PubMed] [Google Scholar]
- 66.Cassidy T. Impact of tamper resistant opioid formulations: findings from navippro [Internet] 2012 [Google Scholar]
- 67.Severtson SG, Bartelson BB, Davis JM, Muñoz A, Schneider MF, Chilcoat H, Coplan PM, Surratt H, Dart RC. Reduced abuse, therapeutic errors, and diversion following reformulation of extended-release oxycodone in 2010. J Pain Off J Am Pain Soc. 2013 doi: 10.1016/j.jpain.2013.04.011. [DOI] [PubMed] [Google Scholar]
- 68.Substance Abuse and Mental Health Services Administration. National household survey on drug abuse advance report [Internet] Office of Applied Studies; 1995. [Google Scholar]
- 69.Substance Abuse and Mental Health Services Administration. Results from the 2011 national survey on drug use and health: detailed tables. Rockville: Department of Health and Human Services; 2012. [Google Scholar]
- 70.Office of National Drug Control Policy. What america’s users spend on illegal drugs, 2000–2006. Washington, D.C.: Executive Office of the President; 2012. [Google Scholar]
- 71.Office of National Drug Control Policy. What america’s users spend on illegal drugs: 1988–2000. Washington, D.C.: Executive Office of the President; 2001. [Google Scholar]
Associated Data
This section collects any data citations, data availability statements, or supplementary materials included in this article.