



Abstract
Differences in seasonal migration might promote reproductive isolation and differentiation by causing populations in migratory divides to arrive on the breeding grounds at different times and/or produce hybrids that take inferior migratory routes. We examined this question by quantifying divergence in song, colour, and morphology between sister pairs of North American migratory birds. We predicted that apparent rates of phenotypic differentiation would differ between pairs that do and do not form migratory divides. Consistent with this prediction, results from mixed effects models and Ornstein–Uhlenbeck models of evolution showed different rates of divergence between these groups; surprisingly, differentiation was greater among non-divide pairs. We interpret this finding as a result of variable rates of population blending and fusion between partially diverged forms. Ancient pairs of populations that subsequently fused are now observed as a single form, whereas those that did not fuse are observable as pairs and included in our study. We propose that fusion of two populations is more likely to occur when they have similar migratory routes and little other phenotypic differentiation that would cause reproductive isolation. By contrast, pairs with migratory divides are more likely to remain reproductively isolated, even when differing little in other phenotypic traits. These findings suggest that migratory differences may be one among several isolating barriers that prevent divergent populations from fusing and thereby increase the likelihood that they will continue differentiating as distinct species.
Keywords: migratory divide, seasonal migration, speciation, comparative analysis, evolutionary rate, phenotypic divergence
1. Background
Seasonal migration has been proposed as an important driver of population differentiation, reproductive isolation, and speciation [1–6]. One set of hypotheses on this topic is derived from cases of ‘migratory divides’, in which closely related but somewhat differentiated populations breed adjacent to one another but use different migratory routes. Differences in the migratory behaviour of these populations could serve as both pre- and postmating isolating barriers (reviewed in [5]). For instance, populations at divides could arrive on their breeding grounds at different times and mate assortatively based on arrival time [5,7]. Migratory routes are largely genetically determined in many groups and can involve navigation around unsuitable areas (e.g. deserts and mountain ranges). Accordingly, hybrids in divides could use intermediate or mixed routes that are inferior to those of parental forms [5,6,8–12].
Migratory divides are found in many taxonomic groups [13–15], and there is growing interest in the role that they and other behavioural differences could play in speciation [16,17]. A few empirical studies focusing on single species have accumulated support for migration's role in speciation. For example, Bearhop et al. [7] used stable isotopes to identify the wintering grounds of European blackcap populations that form a divide in central Europe. These authors documented differences in arrival time between the populations and assortative mating based on location of wintering grounds. In another study, Helbig [12] bred first-generation hybrids between populations of blackcaps and assayed their orientation using Emlen funnels. Hybrids oriented in directions intermediate to parental forms that would have brought them over the Alps, the Mediterranean Sea and the Sahara Desert. More recently, Delmore & Irwin [11] used light-level geolocators to track hybrids between two subspecies groups of Swainson's thrushes that form a divide in western North America; hybrids took intermediate routes over mountainous and arid regions in southwestern North America.
A few studies have begun to examine the role migration plays in speciation on a broader scale. For example, Møller et al. [4] used data on band recoveries to identify migratory divides between passerines in Europe. Over one-quarter of all species they identified formed divides and many showed evidence of local adaptation, likely reducing gene flow at divides. Rohwer & Irwin [6] identified migratory divides between birds in North America, and found that 12 pairs of closely related taxa had well-studied contact zones and eight formed migratory divides with substantial reproductive isolation (a lack of hybrids and/or narrow hybrid zone). Likewise, north Asian migratory behaviour was reviewed by Irwin & Irwin [5], who found that seven species are known to form migratory divides between western and eastern subspecies that migrate to south Asia via routes going west or east of the Tibetan Plateau, a high-elevation desert. These studies established the plausibility that migratory divides could promote reproductive isolation on a broad scale but did not include a rigorous statistical analysis or a quantitative measure of reproductive isolation.
Quantitative measures of reproductive isolation are often collected using mate choice trials and measurements of the viability and fertility of hybrids produced in laboratory crosses [18–20]. Studies using these measures focus primarily on organisms that can be held in the laboratory (e.g. Drosophila, plants, and domestic species of birds). New methods to estimate reproductive isolation using phenotypic data from natural populations have recently been employed in the literature [21–23]. These methods use divergence in traits related to mate choice and species recognition—morphology, colour and, song—as a proxy for reproductive isolation [17,24–26]. There are two ways reproductive isolating barriers like seasonal migration could drive divergence in these traits: (i) selection against maladaptive hybridization and competition (i.e. character displacement [16,17]) and/or (ii) a reduction in gene flow caused by pre- and/or postmating isolation which allows populations to follow different evolutionary trajectories.
In this study, we used divergence in phenotypic traits (morphology, colour, and song) as a proxy for reproductive isolation to test the hypothesis that differences in migratory routes promote speciation in taxonomic groups that form migratory divides. We focused on birds because divides are common in this group [4–6] and could be especially important for their speciation, as intrinsic postmating isolation is believed to play a limited role in avian speciation [19,27,28]. We identified pairs of closely related bird species or subspecies that breed in North America and compared phenotypic divergence between pairs that form divides and pairs that do not. If migration plays a role in generating reproductive isolation, we predicted that rates of phenotypic divergence would differ between pairs that do and pairs that do not form divides, with two possible outcomes: (i) greater phenotypic differentiation among pairs that form divides, suggesting that differences in migration cause faster rates of phenotypic differentiation or (ii) greater phenotypic differentiation among pairs that do not form divides, suggesting that ancient pairs of partially differentiated populations were more likely to fuse into a single population if they lacked both migratory differences and phenotypic divergence.
The first outcome described above follows from the potential for migratory differences to lead to greater reproductive isolation and associated phenotypic divergence. The second outcome would be explained by the geographic history of North American birds and the process of differential fusion [29,30]. Specifically, differentiating groups have likely experienced cycles of allopatry and secondary contact throughout their geographic histories [31–33]. Gene flow following secondary contact could result in blending and fusion of population pairs that had not diverged sufficiently in traits involved in reproductive isolation while allopatric [34]. If differences in migration reduce gene flow between groups, the process of fusion would be less likely to occur in pairs with migratory divides. By contrast, pairs that do not form divides and had not diverged sufficiently in other phenotypic traits would have fused upon secondary contact, owing to low levels of reproductive isolation. This selective elimination of ancient pairs that were not sufficiently phenotypically divergent would result in greater phenotypic differentiation among surviving pairs that do not form divides compared to those that do.
Geography can influence phenotypic differentiation through either convergence or divergence (e.g. convergence can occur if taxa learn heterospecific acoustic signals, and divergence can occur if interspecific interactions lead to character displacement [35,36]). In pairs of migratory species or subspecies that do not form divides, both members of the pair are often restricted to either eastern or western North America. This is not the case in pairs that form divides; the range of one taxon is often restricted to the east and the other to the west (see the electronic supplementary material, figure S1 for examples). This difference between migratory categories could result in greater secondary contact among pairs that do not form divides. We examined this potentially confounding effect of geography on phenotypic divergence by including the extent of geographical overlap between pairs in our analyses. We also used mitochondrial sequence data to control for differences in divergence time in our analyses.
2. Methods
(a). Study species
We identified 49 pairs of closely related migratory passerines and near-passerines that breed in North America using information from published molecular phylogenies [37], literature reviews [6], focused studies of particular taxa [38], Clements checklist (http://www.birds.cornell.edu/clementschecklist/), and Birds of North America (http://bna.birds.cornell.edu/bna/). We defined migrants as those that winter primarily south of the United States–Mexico border. In total, 38/49 pairs were immediate sister taxa (i.e. each other's most closely related taxonomic group, including subspecies) and 11/49 pairs were from the same phylogenetic clade but not the most closely related group (e.g. if the most closely related group was not migratory, we chose the next most closely related migratory group). The latter set of pairs (‘clade sisters’) were never more than two branches apart and thus will still be relevant to our understanding of phenotypic divergence in recent evolutionary history [23]. We split these pairs into two categories based on whether they formed a migratory divide or not. Most pairs that form divides come into contact along the Rocky Mountains or the Great Plains (electronic supplementary material, figure S1).
(b). Measuring phenotypic traits
We measured divergence in three sets of phenotypic traits: morphology, plumage colour, and song. To the best of our knowledge, all of the birds included in our study were breeding adult males (based on breeding plumage, location, and date of capture (May–July, with a few from August for taxa with low sample sizes) for museum specimens and location and date of recording (May–July) for recordings). When available, we included 10 individuals per taxon (mean for colour and morphology = 9.89, range = 6–10; mean for song = 9.27, range = 4–10).
(i). Morphology and colour
We measured morphology and colour from specimens at the Beaty Biodiversity Museum in Vancouver, British Columbia, and the Field Museum of Chicago in Chicago, Illinois. We measured six morphological variables: distance between the longest primary and secondary flight feathers, wing chord, tail, tarsus, and bill length (all measured in millimetres [39]). We used an Ocean Optics USB2000 spectrometer (Dunedin, FL) to gather reflectance data from the feathers of seven body regions: crown, back, rump, tail, throat, belly, and wing coverts. We took five measurements from each region and plotted these data in tetrahedral colour space [40] using the average avian UV visual model and the ‘pavo’ package [41] in R v. 3.0.3 [42] to model the relative stimulation of each of the four cones in the avian visual system. In total, we collected measures of the maximum stimulation of each cone for all seven body regions, resulting in 28 plumage variables for each individual specimen.
(ii). Song
We focused our analysis on those vocalizations that play a major role in mate selection: songs of songbirds and territorial or pair-bonding calls in non-songbirds [43]. We obtained vocalizations from the Macaulay Library (http://macaulaylibrary.org), Xeno-canto (http://www.xeno-canto.org), and field recordings (K.E.D., H.L.K. and D.E.I.). We used Syrinx v. 2.6 [44] to analyse these songs, measuring the following five variables from at least three songs for each individual: duration (s), bandwidth (kHz), maximum frequency (kHz), total number of syllables, and number of syllable types. We defined a syllable as a unit within a vocalization which is made up of components that are always repeated together in the same sequence [43].
(c). Quantifying phenotypic divergence
We used Hedges' g to quantify divergence [45]. This parameter is calculated by taking the difference between mean values for a given trait in two separate taxonomic groups and dividing it by the pooled standard deviation of the trait. Higher values of Hedges' g suggest that mean trait values are farther apart and/or that variability within each group is lower. We calculated Hedges' g for all variables and averaged these estimates for each set of traits separately (i.e. song, colour, and morphology). We then averaged these summary values (i.e. averages for each set of traits) to obtain an overall estimate of divergence for each pair.
(d). Measuring additional predictors of phenotypic divergence
(i). Genetic distance
It can be expected that phenotypic divergence would tend to increase with the time that populations have evolved in separation. To control for this variation in divergence times, we estimated genetic distance between each pair using mitochondrial sequences from GenBank (https://www.ncbi.nlm.nih.gov/genbank). When available, we obtained sequence data from cytochrome b (available for 37 pairs). When data from this region were not available, we used other mitochondrial sequences: cytochrome c oxidase subunit I (COI) (nine pairs), control region (two pairs), nicotinamide adenine dinucleotide plus hydrogen (NADH) (one pair) [46,47]). We aligned sequence data using MEGA 6.06 and estimated genetic distances as p-distance, the proportion of nucleotide sites that differ between clades [48]. Note that we also ran analyses removing pairs with data from NADH and the control region and adjusting estimates from COI to account for slower divergence times with this locus compared to cytochrome b (p-distance 7.8% smaller [49]) and found similar results (electronic supplementary material, tables S2 and S3).
(ii). Geographical distribution, breeding latitude, and migration distance
Secondary contact can result in phenotypic divergence or convergence. We accounted for this potentially confounding effect by including the extent of geographical overlap between pairs in our models. We downloaded range maps from Bird Life International and Nature Serve [50] and used ArcGIS (Esri) to calculate geographical overlap, as the proportion of the smaller range that occurred within the larger range [21]. Separate range maps were not available for subspecies pairs; for these pairs, we split the ranges and estimated the width and length of hybrid zones using Birds of North America and the literature (see the electronic supplementary material, table S1 for sources). We estimated the range of overlap as half of the hybrid zones' area (square kilometres (km2)), since in most hybrid zones the parental forms are both reasonably common in roughly the central 50% of the hybrid zone. Results are robust to changes in this assumption, including the use of 0% overlap for these pairs. Migratory divides are also more common at higher latitudes [6] and selection related to differences in migration may be higher for taxa that travel longer distances. We controlled for these effects by including estimates of breeding range latitude and migratory distance (km).
(iii). Body mass
We included body mass in our analyses to control for allometric effects on the traits measured. We obtained estimates of body mass from the CRC Handbook of Avian Body Masses [51]. Where available, mean male mass was used, otherwise mass estimates come from both sexes or unknown sexes. For some pairs, mass estimates were not available at the subspecies level—for those the mean mass for the species was recorded for both members of the pair (for a difference of zero).
(e). Statistical analysis
We used two complimentary approaches to evaluate the prediction that phenotypic divergence will differ between taxa that do and do not form divides. First, we used an information theoretic approach with linear mixed effects models and model averaging [52]. We ran these analyses using the ‘lmer’, ‘MuMin’, and ‘visreg’ packages in R and included six fixed effects: migration category (divide or no divide), geographical overlap, genetic distance, breeding range latitude, migration distance, and body mass. We controlled for phylogenetic relationships in our dataset by including genus nested within family as a random effect in all models [23]. In total, we ran 64 models with average divergence as the response variable (all possible models from n = 6 predictor variables [2n models, where n = number of predictors]). We selected models with ΔAICc (Akaike information criterion, corrected for sample size) less than 2 from the top model [52] and ran these selected models again to recalculate relative AICc weights. Parameter estimates for each predictor were then averaged across the selected top models and weighted by the summed relative AICc weight of each model in which they were included [52]. This model averaging approach allows us to investigate how different combinations of the fixed effects influence phenotypic divergence, select the most parsimonious combination, and understand how influential different migratory strategies are in relation to other predictors.
We also used Brownian motion (BM) and Ornstein–Uhlenbeck (OU) models to compare phenotypic divergence between different migratory categories. These models estimate rates of evolutionary divergence. BM models include a single parameter for evolutionary rate (β) and assume that phenotypic divergence is unbounded. OU models extend BM models by including an additional parameter (α) that constrains phenotypic divergence to an intermediate value, constraining phenotypic divergence. The constraint parameter (α) varies from 0 to 1, with higher values making divergence more difficult. We ran these analyses using the ‘EvoRAG’ package [53] in R and compared four models: (i) a single evolutionary rate; (ii) separate evolutionary rates for the two migratory categories; (iii) a single evolutionary rate that varied linearly with geographical overlap; and (iv) separate evolutionary rates for each migratory category that each varied linearly with geographical overlap. Note that models including geographical overlap allowed β but not α to vary with geographical overlap (OUβ-linear). We multiplied p-distance by 100 to run these models, divided phenotypic divergence by 10 and considered the model with the lowest AICc value the most parsimonious fit to the data [52]. These models allow us to examine rates of phenotypic divergence in more detail than our model averaging approach, including a comparison between models with and without evolutionary constraint.
3. Results
The entire dataset used in our analysis can be found in the electronic supplementary material (electronic supplementary material, table S1). Phenotypic divergence between pairs ranged from 0.44 to 3.93 (Hedges' g-values; mean = 1.37). To examine the contribution of each trait set (i.e. song, colour, morphology) to total divergence, we identified the trait set with the highest Hedges' g-value in each pair. The number of pairs maximally diverged in the song, colour, and morphological datasets was not different than expected by chance (18 morphology, 18 plumage, 16 song; expected values = 16.33; χ2 = 0.124, d.f. = 2, p = 0.93).
Using the model averaging approach to investigate how different combinations of the fixed effects influenced overall phenotypic divergence, we found that migration category (divide or no divide), time since divergence, and body mass were significant predictors of overall phenotypic divergence (i.e. confidence intervals on estimates did not overlap zero, table 1a). The modelled relationship between migration category and phenotypic divergence is shown in figure 1 (relationships for all significant predictors in the final averaged model are shown in the electronic supplementary material, figure S2). In support of our second predicted outcome, phenotypic divergence was greater among pairs that do not form divides than among those that do. Time since divergence and body mass were positively associated with phenotypic divergence (table 1a).
Table 1.
Results from averaged linear mixed models examining the relationship between phenotypic divergence and a series of predictor variables, including migration category (divide or no divide). Models were run with family and genus as nested random variables and phenotypic divergence as a dependent variable (for all traits combined (a) and each set of traits separately (b–d)). Fixed effects included migration category, time since divergence (p-distance, the proportion of nucleotide sites that differ between clades); geographical overlap, migration distance, breeding latitude, and body mass. Only fixed effects included in the final model are shown; those that are significant predictors of phenotypic divergence (where confidence intervals (CI) do not overlap zero) are shown in bold. Negative parameter estimates for migration category indicate that groups with migratory divides tend to have lower phenotypic divergence than groups without divides. n = number of models in final averaged model (i.e. within ΔAICc of 2), R2 = goodness-of-fit of the global model.
| predictor variables | parameter estimates | standard errors | lower CI | Upper CI |
|---|---|---|---|---|
| (a) overall phenotypic divergence (R2 = 0.56, n = 4) | ||||
| (intercept) | 1.73 | 1.27 | −0.79 | 4.25 |
| migration category | −0.44 | 0.11 | −0.65 | −0.22 |
| time since divergence | 0.22 | 0.047 | 0.13 | 0.32 |
| breeding latitude | −0.51 | 0.35 | −1.22 | 0.20 |
| body mass | 0.23 | 0.098 | 0.03 | 0.43 |
| (b) song divergence (R2 = 0.37, n = 6) | ||||
| (intercept) | −0.0057 | 1.59 | −3.17 | 3.16 |
| migration category | −0.58 | 0.17 | −0.92 | −0.25 |
| time since divergence | 0.19 | 0.073 | 0.039 | 0.33 |
| geographical overlap | −0.48 | 0.55 | −1.58 | 0.62 |
| breeding latitude | 0.43 | 0.53 | −0.63 | 1.50 |
| migration distance | 0.30 | 0.17 | −0.036 | 0.63 |
| (c) colour divergence (R2 = 0.38, n = 9) | ||||
| (intercept) | 1.18 | 1.69 | −2.19 | 4.55 |
| migration category | −0.45 | 0.18 | −0.81 | −0.084 |
| time since divergence | 0.24 | 0.085 | 0.072 | 0.41 |
| geographical overlap | 1.10 | 0.61 | −0.13 | 2.32 |
| breeding latitude | −0.52 | 0.61 | −1.75 | 0.71 |
| body mass | 0.30 | 0.17 | −0.041 | 0.64 |
| (d) morphological divergence (R2 = 0.29, n = 4) | ||||
| (intercept) | 5.28 | 2.21 | 0.84 | 9.72 |
| time since divergence | 0.18 | 0.076 | 0.028 | 0.33 |
| geographical overlap | 0.71 | 0.47 | −0.23 | 1.65 |
| breeding latitude | −1.28 | 0.56 | −2.41 | 0.14 |
Figure 1.
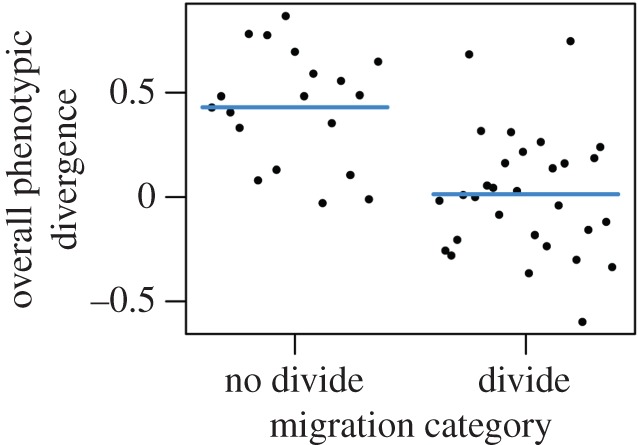
Modelled relationship between overall phenotypic divergence and migration category (no divide, divide). Model averaging with linear mixed effects models were run with a random variable of genus nested within family to control for phylogenetic relationships. Significant predictors in the final model included migration category, time since divergence, and body mass. The effect of migration category is plotted with these additional variables held at their medians. (Online version in colour.)
The results described above considered all traits together (i.e. average divergence in song, colour, and morphological traits). We also used model averaging to examine the relationship between our predictor variables and divergence in each set of traits separately. Migration category and time since divergence emerged as significant predictors in the average best model for divergence in song and colour (table 1b,c). Time since divergence was the only significant predictor of morphological divergence (table 1d). Similar to results using divergence in all trait sets, pairs that formed migratory divides had lower values of song and colour divergence, and time since divergence had a positive effect on divergence in both traits. Geographical overlap did not emerge as a significant predictor in the average best model of any trait set (table 1).
Figure 2 shows the relationship between phenotypic divergence and time since divergence for all trait sets. In each case, the evolution of phenotypic divergence appears to be bounded, with divergence occurring rapidly at first and slowing down with increased time since divergence. ΔAICc values from a comparison of BM and OU models support this observation, with OU models providing the best fit to the data in all comparisons (table 2). The best-fit model in all cases (when all traits were combined and when each trait set was examined separately) included separate rates for each migration category and allowed these rates to vary linearly with geographical overlap. Similar to results from model averaging and in support of our second predicted outcome, rates of evolution (β) were lower for pairs that form divides (table 2 and figure 2). Note, that the sign of β slope (which describes how evolutionary rates change with geographical overlap) was not consistent between comparisons (i.e. was positive for some and negative for others) and 95% confidence intervals on these slopes included 0, suggesting that they are non-significant.
Figure 2.

Relationship between phenotypic divergence and time since divergence. Results are shown for all traits combined (a) and each set of traits separately (b–d). Time since divergence was measured using genetic distance; phenotypic divergence was measured using average Hedges' g. Curves show results from OU (Ornstein–Uhlenbeck) models of evolutionary change, fitting separate models for taxa that do (dotted line and open points) and do not (black line and filled points) form migratory divides.
Table 2.
Results from BM (Brownian Motion) and OU (Ornstein–Uhlenbeck) models of evolutionary change. Models including a single evolutionary rate are compared with models fitting separate rates for each migration category (no divide/divide), allowing phenotypic divergence to vary linearly with geographical overlap (overlap) and allowing rates of evolution to vary with both migration category and geographical overlap (no divide/divide and overlap). Models were run with all traits combined (a) and each set of traits separately (b–d). OU models include an additional parameter (α) that constrains the rate (β) of divergence to an intermediate value. β slope describes how the evolutionary rate changes with geographical overlap (α was not permitted to vary with geographical overlap); 95% confidence intervals generated using 10 000 bootstraps are shown in parentheses.
| Brownian motion |
Ornstein–Uhlenbeck |
||||||
|---|---|---|---|---|---|---|---|
| β | ΔAICc | β | β slope no divide | β slope divide | α | ΔAICc | |
| (a) overall phenotypic divergence | |||||||
| one rate | 0.0061 | 16.09 | 0.018 | n.a. | 0.62 | 7.82 | |
| no divide/divide | 0.0097/0.0038 | 10.79 | 0.040/0.0061 | n.a. | 1.18/0.18 | 3.73 | |
| overlap | 0.0066 | 17.95 | 0.039 | 0.17 (0.0040–3.86) | 2.90 | 5.79 | |
| no divide/divide and overlap | 0.014/0.0035 | 7.88 | 0.042/0.0081 | 0.0041 (−0.043–5.80) | 0.078 (−0.0065–2.43) | 1.29/0.68 | 0 |
| (b) song divergence | |||||||
| one rate | 0.0053 | 20.94 | 0.013 | n.a. | 0.48 | 13.55 | |
| no divide/divide | 0.0092/0.0028 | 12.44 | 0.021/0.0085 | n.a. | 0.42/0.69 | 3.81 | |
| overlap | 0.0061 | 21.44 | 0.013 | 0.0051 (−0.016–1.87) | 0.01 | 15.74 | |
| no divide/divide and overlap | 0.013/0.0029 | 7.96 | 0.015/0.0073 | −0.01 (−0.033–0.81) | 0.095 (0.0088–2.62) | 0.20/1.13 | 0 |
| (c) colour divergence | |||||||
| one rate | 0.0087 | 14.36 | 0.020 | n.a. | 0.43 | 8.32 | |
| no divide/divide | 0.014/0.0053 | 8.59 | 0.037/0.0092 | n.a. | 0.57/0.24 | 3.36 | |
| overlap | 0.0079 | 16.22 | 0.037 | 0.20 (0.0061–5.59) | 2.01 | 4.03 | |
| no divide/divide and overlap | 0.017/0.0052 | 8.14 | 0.063/0.0091 | 0.49 (−0.020–13.57) | 0.0091 (−0.014–4.29) | 4.36/0.35 | 0 |
| (d) morphological divergence | |||||||
| one rate | 0.0078 | 20.92 | 0.021 | n.a. | 0.56 | 14.57 | |
| no divide/divide | 0.011/0.0056 | 17.97 | 0.14/0.0059 | n.a. | 6.43/0.018 | 4.88 | |
| overlap | 0.0086 | 22.36 | 0.17 | 0.98 (−0.0095–5.31) | 11.29 | 10.34 | |
| no divide/divide and overlap | 0.015/0.0047 | 12.59 | 0.14/0.012 | −0.018 (−0.097–0.0013) | 0.16 (−0.036–6.25) | 5.71/0.76 | 0 |
4. Discussion
In this study, we used a quantitative and comparative approach to examine a prediction based on a prominent hypothesis in the speciation literature, that differences in the migratory routes of populations that form migratory divides promote reproductive isolation [4–12]. Our broad statistical analysis of divergence between migratory taxon pairs supports the hypothesis that differentiated migratory routes promote reproductive isolation: the extent and rate of phenotypic differentiation differed among sister pairs that do or do not form migratory divides, with divergence being less for pairs that form divides. This result suggests that a portion of the reproductive isolation between pairs that form divides results from migratory differences. We explain the role the geographical history of North American birds and the process of differential fusion likely played in generating this pattern below.
Owing to climatic cycles throughout the Pleistocene, bird species in North America have had complex histories that involved periods of population contraction and fragmentation followed by periods of population expansion and contact between refugial populations [31–33]. Upon contact, many partially differentiated populations simply fused back together, blending back into a single form [54]. Examples in which population fusion is thought to have occurred include ravens [55], black-capped chickadees [56], and snow geese [57] of North America, and blue tits [58] of Europe. Cases in which blending appears to be presently occurring include the Pacific-slope and cordilleran flycatchers, which have similar migratory behaviour and are blending together over a large section of southern British Columbia and Alberta, Canada [59]; the Townsend's and hermit warblers, in which a hybrid zone is spreading rapidly southward and may lead to the eventual extinction of hermit warblers as a plumage form while preserving much of its genomic variation in the resulting Townsend's warblers [60]; and the blue-winged and golden-winged warblers, in which a hybrid zone is moving northward [61].
Whether population fusion occurs upon population contact is determined largely by the level of reproductive isolation between two forms [34]. There are a wide variety of traits that could play a role in reproductive isolation, including migratory differences as well as the other phenotypic traits examined here. If a particular level of total reproductive isolation is required to avoid fusion, and if migratory divides cause some reproductive isolation, then populations with differences in migration do not require as much differentiation in other traits to remain distinct forms. In other words, for a given level of differentiation in other phenotypic traits, ancient fusion of populations would have been less likely to occur when those populations had migratory divides. Populations that differed insufficiently in migration and other traits would have been more likely to fuse, such that they would no longer exist as a pair of forms available to a study such as this one. Altogether, this process of differential fusion would lead to the observed pattern, of greater observed phenotypic difference in pairs without migratory divides.
The potentially greater rates of ancient fusion between groups with similar migratory divides would in principal be detectable with very detailed genomic analyses. These are beyond the scope of this study, but we comment here on approaches one might take to detect such ancient fusion. If a current species resulted from an ancient species splitting for a period of time into two refugial populations that subsequently fused into a single population, there would tend to be distinct peaks in the distribution of inferred coalescence times across small segments of the genome. These peaks would correspond to those genomic fragments with coalescence times in the ancient single population (old coalescence times) and those that coalesce in the more recent single population (recent coalescence times). There would also be some genomic fragments that coalesce within one of the refugial populations, but these would tend to occur at a lower frequency (per unit of past time), because such a pattern of coalescence would result from the improbable extinction of all those alleles that emerged from just one of the refugial populations, with multiple alleles from the other population surviving. Approaches to inferring such complex population history from genomic data are in their infancy (e.g. [62,63]), but further development of this field may allow a test of our hypothesis that there has been more fusion between groups with similar migratory behaviour. In addition to the complexities of inferring history from genomic patterns, one would also need to infer past migratory behaviour, a task that would involve careful inference of past migratory behaviour from current patterns.
Geography had the potential to influence our results, by causing either convergence or divergence in the phenotypic traits we measured [35,36]. Recall that members of sister pairs that do not form divides are often found either both in western or both in eastern North America while pairs that form divides often include one taxon in the west and the other in the east. Accordingly, pairs that do not form divides are more proximate and may, as a result, have come into secondary contact more often than those that do form divides. This potential increase in secondary contact among pairs that do not form divides might account at least partially for increased rates of divergence in this group. Nevertheless, the bulk of evidence presented in our study does not support this suggestion: geographical overlap was not a significant predictor in any of the final linear mixed effects models and while models of trait evolution that included both migratory category and geographical overlap provided the best fit to our data, slopes describing the rate of increase between phenotypic divergence and geographical overlap were neither significant nor consistent in sign. In addition, models including only geographical overlap did not provide a better fit to the data than those with separate rates for each migration category (table 2). This finding is in accordance with other comparative analyses that have failed to find an effect of sympatry in explaining phenotypic divergence ([23,46], but see [21,53]).
Instead, several additional anecdotes support the first interpretation of our results, that secondary contact and differences in the main reproductive isolating barriers between migratory categories account for increased phenotypic divergence in pairs that do not form divides. To begin with, following this interpretation we would expect to find an excess of pairs with low values of trait divergence in the divide category. This is exactly what we see in figure 2, where there are more young pairs with low differentiation in the divide group (open circles, bottom left hand corner). Sister pairs that form divides today also provide support for this expectation, as many of the migratory divides described to date occur between taxa that exhibit low levels of phenotypic divergence, including subspecies of willow warblers [9], populations of European blackcaps [64] and subspecies groups of the Swainson's thrush. For example, two groups of Swainson's thrushes form a migratory divide in western North America, where they differ in song, morphology, and colour [65,66]. Differences in migratory routes distinguish these groups more clearly than the other traits (Cohen's D of 9.01 for migration, 3.61 for song, 2.15 for morphology, and 0.28 for colour [11]). Finally, a comparison between migratory and non-migratory taxa supports the suggestion that migration could be maintaining reproductive isolation between taxa that form divides. Specifically, as suggested above, most migratory divides comprise one taxon in the east and another in the west. This is often not the case for widespread non-migratory groups such as boreal chickadees, black-capped chickadees [56], ruby-crowned kinglets, and golden-crowned kinglets [67]. During the glacial advances, these species would likely have experienced similar periods of allopatry to taxa that form divides, occupying both eastern and western refugia (as inferred from their widespread current ranges). Accordingly, they might each be expected to exhibit differentiation between eastern and western forms. Perhaps the fact that they did not differ in migratory behaviour caused forms from the different refugia to blend together freely.
Future analyses could take a variety of approaches to expand on our results. To begin with, a more quantitative comparison of migratory versus non-migratory taxa to confirm our suggestion above that non-migrants rarely form east/west divides would be informative. In addition, whereas we used divergence in phenotypic traits as our measure of reproductive isolation, studies using a more direct measure of this variable would be valuable. Data on hybrid zone width, for instance, are often used to examine the strength of reproductive isolation, with narrower hybrid zones suggesting stronger reproductive isolation [68]. Using a measure of reproductive isolation that is not also involved in generating reproductive isolation would allow us to more directly evaluate the prediction that migratory divides promote speciation in birds. At this time, data for the width of 13 hybrid zones between pairs in our study are available and suggest that hybrid zones between taxa that form divides may be narrower than hybrid zones between taxa without divides (divide, mean = 163 km, range = 60–400; no divide, mean = 289 km, range = 32–600), supporting a role for migration in reproductive isolation. With the current surge of next-generation sequencing, it is likely that additional data on hybrid zones will become available, allowing a more quantitative approach to this analysis. One additional extension that would be informative is to collect similar data in other migratory systems. The main ecological barriers encountered by birds breeding in North America are mountain chains and deserts in western North America. These barriers may only moderately reduce the fitness of hybrids. By contrast, birds breeding in Siberia and encountering the Tibetan Plateau and Gobi Desert on their way to Asia may experience greater reductions in fitness on migration than birds breeding in North America [5].
Our findings support a role for migration in promoting differentiation and reproductive isolation among North American species and subspecies of birds. These results are in line with several recent reviews [1–6] highlighting both the role migration plays in generating diversity worldwide and the importance of considering the complex life history of migratory birds in models of speciation [2]. Differences in the life history of migrants (versus residents) that should be considered in models of speciation include the time they spend on migration and the wintering grounds and adaptations associated with the ability to migrate [2]. Our findings also highlight the importance of considering the geographical histories of temperate species and potential for differential fusion in explaining patterns of differentiation across taxa. For instance, differential fusion is often disregarded in the speciation literature as it was shown to have a limited role in Drosophila [16,18,30] but recent work in birds suggests this process should be reconsidered in other taxonomic groups [21,69].
Supplementary Material
Supplementary Material
Acknowledgements
We thank the Field Museum of Chicago (especially Dr John Bates and Dr Ben Marks) and the Beaty Biodiversity Museum (especially Ildiko Szabo and Chris Stinson) for access to specimens. We are grateful to Jason Weir, Chris Muir, and Dolph Schluter for advice on the analysis and Leslie Poulson for assistance in data collection. The manuscript also benefitted from comments from Oscar Gaggiotti and Kevin Winker.
Data accessibility
The entire dataset used in our analysis can be found in the electronic supplementary material.
Authors' contributions
K.E.D. designed the research with help from D.E.I. and H.L.K. K.E.D., H.L.K., and R.R.G. collected and analysed the data. K.E.D. wrote the paper with input from all authors.
Competing interests
We have no competing interests.
Funding
This work was supported by grants from the Natural Sciences and Engineering Research Council of Canada (Discovery Grant 311931 to D.E.I. and CGS-D to K.E.D. and R.R.G.), the Field Museum of Chicago (Visiting Scholarship to K.E.D.), and Environment Canada (Science Horizons Youth Internship Program for H.L.K. and Leslie Poulson).
References
- 1.Friesen VL, Burg TM, McCoy KD. 2007. Mechanisms of population differentiation in seabirds. Mol. Ecol. 16, 1765–1785. ( 10.1111/j.1365-294X.2006.03197.x) [DOI] [PubMed] [Google Scholar]
- 2.Winker K. 2010. On the origin of species through heteropatric differentiation: a review and a model of speciation in migratory animals. Ornithol. Monogr. 69, 1–30. ( 10.1525/om.2010.69.1.1) [DOI] [Google Scholar]
- 3.Webster MS, Marra PP. 2005. The importance of understanding migratory connectivity and seasonal interactions. In Birds of two worlds: the ecology and evolution of migration (eds Greenberg R, Marra PP), pp. 199–209. Baltimore, MD: Johns Hopkins University Press. [Google Scholar]
- 4.Møller AP, Garamszegi LZ, Peralta-Sánchez JM, Soler JJ. 2011. Migratory divides and their consequences for dispersal, population size and parasite–host interactions. J. Evol. Biol. 24, 1744–1755. ( 10.1111/j.1420-9101.2011.02302.x) [DOI] [PubMed] [Google Scholar]
- 5.Irwin DE, Irwin JH. 2005. Siberian migratory divides: the role of seasonal migration in speciation. In Birds of two worlds: the ecology and evolution of migration (eds Greenberg R, Marra PP), pp. 27–40. Baltimore, MD: Johns Hopkins University Press. [Google Scholar]
- 6.Rohwer S, Irwin DE. 2011. Molt, orientation, and avian speciation. Auk 128, 419–425. ( 10.1525/auk.2011.10176) [DOI] [Google Scholar]
- 7.Bearhop S, Fiedler W, Furness RW, Votier SC, Waldron S, Newton J, Bowen GJ, Berthold P, Farnsworth K. 2005. Assortative mating as a mechanism for rapid evolution of a migratory divide. Science 310, 502–504. ( 10.1126/science.1115661) [DOI] [PubMed] [Google Scholar]
- 8.Veen T, Svedin N, Forsman JT, Hjernquist MB, Qvarnström A, Hjernquist KAT, Träff J, Klaassen M. 2007. Does migration of hybrids contribute to post-zygotic isolation in flycatchers? Proc. R. Soc. B 274, 707–712. ( 10.1098/rspb.2006.0058) [DOI] [PMC free article] [PubMed] [Google Scholar]
- 9.Bensch S, Grahn M, Müller N, Gay L, Åkesson S. 2009. Genetic, morphological, and feather isotope variation of migratory willow warblers show gradual divergence in a ring. Mol. Ecol. 18, 3087–3096. ( 10.1111/j.1365-294X.2009.04210.x) [DOI] [PubMed] [Google Scholar]
- 10.Rolshausen G, Segelbacher G, Hobson KA, Schaefer HM. 2009. Contemporary evolution of reproductive isolation and phenotypic divergence in sympatry along a migratory divide. Curr. Biol. 19, 2097–2101. ( 10.1016/j.cub.2009.10.061) [DOI] [PubMed] [Google Scholar]
- 11.Delmore KE, Irwin DE. 2014. Hybrid songbirds employ intermediate routes in a migratory divide. Ecol. Lett. 17, 1211–1218. ( 10.1111/ele.12326) [DOI] [PubMed] [Google Scholar]
- 12.Helbig AJ. 1991. Inheritance of migratory direction in a bird species: a cross-breeding experiment with SE- and SW-migrating blackcaps (Sylvia atricapilla). Behav. Ecol. Sociobiol. 28, 9–12. ( 10.1007/BF00172133) [DOI] [Google Scholar]
- 13.O'Corry-Crowe GM, Suydam RS, Rosenberg A, Frost KJ, Dizon AE. 1997. Phylogeography, population structure and dispersal patterns of the beluga whale Delphinapterus leucas in the western Nearctic revealed by mitochondrial DNA. Mol. Ecol. 6, 955–970. ( 10.1046/j.1365-294X.1997.00267.x) [DOI] [Google Scholar]
- 14.Gagnaire PA, Albert V, Jónsson B, Bernatchez L. 2009. Natural selection influences AFLP intraspecific genetic variability and introgression patterns in Atlantic eels. Mol. Ecol. 18, 1678–1691. ( 10.1111/j.1365-294X.2009.04142.x) [DOI] [PubMed] [Google Scholar]
- 15.Altizer S, Davis AK. 2010. Populations of monarch butterflies with different migratory behaviors show divergence in wing morphology. Evolution 64, 1018–1028. ( 10.1111/j.1558-5646.2010.00946.x) [DOI] [PubMed] [Google Scholar]
- 16.Coyne JA, Orr HA. 2004. Speciation. Sunderland, MA: Sinauer Associates, Inc. [Google Scholar]
- 17.Price T. 2008. Speciation in birds. Greenwood Village, CO: Roberts and Company Publishers. [Google Scholar]
- 18.Coyne JA, Orr HA. 1997. ‘Patterns of speciation in Drosophila’ revisited. Evolution 51, 295–303. ( 10.2307/2410984) [DOI] [PubMed] [Google Scholar]
- 19.Price TD, Bouvier MM. 2002. The evolution of F1 postzygotic incompatibilities in birds. Evolution 56, 2083–2089. ( 10.1111/j.0014-3820.2002.tb00133.x) [DOI] [PubMed] [Google Scholar]
- 20.Lowry DB, Modliszewski JL, Wright KM, Wu CA, Willis JH. 2008. The strength and genetic basis of reproductive isolating barriers in flowering plants. Phil. Trans. R. Soc. B 363, 3009–3021. ( 10.1098/rstb.2008.0064) [DOI] [PMC free article] [PubMed] [Google Scholar]
- 21.Martin PR, Montgomerie R, Lougheed SC. 2010. Rapid sympatry explains greater color pattern divergence in high latitude birds. Evolution 64, 336–347. ( 10.1111/j.1558-5646.2009.00831.x) [DOI] [PubMed] [Google Scholar]
- 22.Weir JT, Wheatcroft DJ, Price TD. 2012. The role of ecological constraint in driving the evolution of avian song frequency across a latitudinal gradient. Evolution 66, 2773–2783. ( 10.1111/j.1558-5646.2012.01635.x) [DOI] [PubMed] [Google Scholar]
- 23.Seddon N, et al. 2013. Sexual selection accelerates signal evolution during speciation in birds. Proc. R. Soc. B 280, 20131065 ( 10.1098/rspb.2013.1065) [DOI] [PMC free article] [PubMed] [Google Scholar]
- 24.Slabbekoorn H, Smith TB. 2002. Bird song, ecology and speciation. Phil. Trans. R. Soc. Lond. B 357, 493–503. ( 10.1098/rstb.2001.1056) [DOI] [PMC free article] [PubMed] [Google Scholar]
- 25.Hill GE, McGraw K. 2006. Bird coloration. Vol 2. Function and evolution. Cambridge, MA: Harvard University Press. [Google Scholar]
- 26.Uy JAC, Moyle RG, Filardi CE. 2009. Plumage and song differences mediate species recognition between incipient flycatcher species of the Solomon Islands. Evolution 63, 153–164. ( 10.1111/j.1558-5646.2008.00530.x) [DOI] [PubMed] [Google Scholar]
- 27.Grant PR, Grant BR. 1992. Hybridization of bird species. Science 256, 193–197. ( 10.1126/science.256.5054.193) [DOI] [PubMed] [Google Scholar]
- 28.Rabosky DL, Matute DR. 2013. Macroevolutionary speciation rates are decoupled from the evolution of intrinsic reproductive isolation in Drosophila and birds. Proc. Natl Acad. Sci. USA 110, 15 354–15 359. ( 10.1073/pnas.1305529110) [DOI] [PMC free article] [PubMed] [Google Scholar]
- 29.Templeton AR. 1981. Mechanisms of speciation–a population genetic approach. Annu. Rev. Ecol. Syst. 12, 23–48. ( 10.1146/annurev.es.12.110181.000323) [DOI] [Google Scholar]
- 30.Noor MAF. 1999. Reinforcement and other consequences of sympatry. Heredity 83, 503–508. ( 10.1038/sj.hdy.6886320) [DOI] [PubMed] [Google Scholar]
- 31.Hewitt G. 2000. The genetic legacy of the Quaternary ice ages. Nature 405, 907–913. ( 10.1038/35016000) [DOI] [PubMed] [Google Scholar]
- 32.Weir JT, Schluter D. 2004. Ice sheets promote speciation in boreal birds. Proc. R. Soc. Lond. B 271, 1881–1887. ( 10.1098/rspb.2004.2803) [DOI] [PMC free article] [PubMed] [Google Scholar]
- 33.Lovette IJ. 2005. Glacial cycles and the tempo of avian speciation. Trends Ecol. Evol. 20, 57–59. ( 10.1016/j.tree.2004.11.011) [DOI] [PubMed] [Google Scholar]
- 34.Arnold M. 1997. Natural hybridization and evolution. New York, NY: Oxford University Press. [Google Scholar]
- 35.Pfennig KS. 1998. The evolution of mate choice and the potential for conflict between species and mate–quality recognition. Proc. R. Soc. Lond. B 265, 1743–1748. ( 10.1098/rspb.1998.0497) [DOI] [Google Scholar]
- 36.Haavie J, Borge T, Bures S, Garamszegi LZ, Lampe HM, Moreno J, Qvarnström A, Török J, Sætre G-P. 2004. Flycatcher song in allopatry and sympatry—convergence, divergence and reinforcement. J. Evol. Biol. 17, 227–237. ( 10.1111/j.1420-9101.2003.00682.x) [DOI] [PubMed] [Google Scholar]
- 37.Lovette IJ, et al. 2010. A comprehensive multilocus phylogeny for the wood-warblers and a revised classification of the Parulidae (Aves). Mol. Phylog. Evol. 57, 753–770. ( 10.1016/j.ympev.2010.07.018) [DOI] [PubMed] [Google Scholar]
- 38.Boulet M, Gibbs HL, Hobson KA. 2006. Integrated analysis of genetic, stable isotope, and banding data reveal migratory connectivity and flyways in the northern yellow warbler (Dendroica petechia; Aestiva group). Ornithol. Monogr. 61, 29–78. ( 10.1642/0078-6594(2006)61%5B29:IAOGSI%5D2.0.CO;2) [DOI] [Google Scholar]
- 39.Pyle P, Howell SNG, Ruck S. 1997. Identification guide to North American Birds. Ann Arbor, MI: Braun-Brumfield. [Google Scholar]
- 40.Stoddard MC, Prum RO. 2008. Evolution of avian plumage color in a tetrahedral color space: a phylogenetic analysis of new world buntings. Am. Nat. 171, 755–776. ( 10.1086/587526) [DOI] [PubMed] [Google Scholar]
- 41.Maia R, Eliason CM, Bitton P-P, Doucet SM, Shawkey MD. 2013. pavo: an R package for the analysis, visualization and organization of spectral data. Meth. Ecol. Evol. 4, 906–913. ( 10.1111/2041-210x.12069) [DOI] [Google Scholar]
- 42.R Development Core Team. 2014. R: a language and environment for statistical computing. Vienna, Austria: R Foundation for Statistical Computing. [Google Scholar]
- 43.Catchpole CK, Slater PJB. 2008. Bird song: biological themes and variations. Cambridge, UK: Cambridge University Press. [Google Scholar]
- 44.Burt J. 2005. Syrinx, version 2.6. Seattle, WA: University of Washington; (www.syrinxpc.com) [Google Scholar]
- 45.Hedges LV. 1981. Distribution theory for Glass's estimator of effect size and related estimators. J. Educ. Behav. Stat. 6, 107–128. ( 10.3102/10769986006002107) [DOI] [Google Scholar]
- 46.Weir JT, Wheatcroft D. 2011. A latitudinal gradient in rates of evolution of avian syllable diversity and song length. Proc. R. Soc. B 278, 1713–1720. ( 10.1098/rspb.2010.2037) [DOI] [PMC free article] [PubMed] [Google Scholar]
- 47.Barker FK, Benesh MK, Vandergon AJ, Lanyon SM. 2012. Contrasting evolutionary dynamics and information content of the avian mitochondrial control region and ND2 gene. PLoS ONE 7, e46403 ( 10.1371/journal.pone.0046403) [DOI] [PMC free article] [PubMed] [Google Scholar]
- 48.Nei M, Kumar S. 2000. Molecular evolution and phylogenetics. West Sussex, UK: Oxford University Press. [Google Scholar]
- 49.Lavinia PD, Kerr KCR, Tubaro PL, Hebert PDN, Lijtmaer DA. 2015. Calibrating the molecular clock beyond cytochrome b: assessing the evolutionary rate of COI in birds. J. Avian Biol. ( 10.1111/jav.00766) [DOI] [Google Scholar]
- 50.Ridgely R, Allnutt T, Brooks T, McNicol D, Mehlman D, Young B, Zook J, BirdLife International. 2011. Digital distribution maps of the birds of the Western Hemisphere, version 4.0. In BirdLife international and natureserve bird species distribution maps of the world. Cambridge, UK: BirdLife International and NatureServe. [Google Scholar]
- 51.Dunning JB. 1992. CRC handbook of avian body masses. Boca Raton, FL: CRC press. [Google Scholar]
- 52.Burnham KP, Anderson DR. 2002. Model selection and multimodel inference: a practical information-theoretic approach. New York, NY: Springer. [Google Scholar]
- 53.Weir JT, Lawson A. 2015. Evolutionary rates across gradients. Methods Ecol. Evol. ( 10.1111/2041-210X.12419) [DOI] [Google Scholar]
- 54.Newton I. 2003. Speciation and biogeography of birds. London, UK: Academic Press. [Google Scholar]
- 55.Webb WC, Marzluff JM, Omland KE. 2011. Random interbreeding between cryptic lineages of the Common Raven: evidence for speciation in reverse. Mol. Ecol. 20, 2390–2402. ( 10.1111/j.1365-294X.2011.05095.x) [DOI] [PubMed] [Google Scholar]
- 56.Gill FB, Mostrom AM, Mack AL. 1993. Speciation in North American chickadees: I. patterns of mtDNA genetic divergence. Evolution 47, 195–212. ( 10.2307/2410129) [DOI] [PubMed] [Google Scholar]
- 57.Rattray B, Cooke F. 1984. Genetic modelling: an analysis of a colour polymorphism in the Snow Goose (Anser caerulescens). Zool. J. Linn. Soc. 80, 437–445. ( 10.1111/j.1096-3642.1984.tb02554.x) [DOI] [Google Scholar]
- 58.Taberlet P, Meyer A, Bouvetv J. 1992. Unusual mitochondrial DNA polymorphism in two local populations of blue tit Parus caeruleus. Mol. Ecol. 1, 27–36. ( 10.1111/j.1365-294X.1992.tb00152.x) [DOI] [PubMed] [Google Scholar]
- 59.Rush AC, Cannings RJ, Irwin DE. 2009. Analysis of multilocus DNA reveals hybridization in a contact zone between Empidonax flycatchers. J. Avian Biol. 40, 614–624. ( 10.1111/j.1600-048X.2009.04681.x) [DOI] [Google Scholar]
- 60.Krosby M, Rohwer S. 2010. Ongoing movement of the Hermit Warbler×Townsend's Warbler hybrid zone. PLoS ONE 5, e14164 ( 10.1371/journal.pone.0014164) [DOI] [PMC free article] [PubMed] [Google Scholar]
- 61.Vallender R, Robertson RJ, Friesen VL, Lovette IJ. 2007. Complex hybridization dynamics between golden-winged and blue-winged warblers (Vermivora chrysoptera and Vermivora pinus) revealed by AFLP, microsatellite, intron and mtDNA markers. Mol. Ecol. 16, 2017–2029. ( 10.1111/j.1365-294X.2007.03282.x) [DOI] [PubMed] [Google Scholar]
- 62.Nadachowska-Brzyska K, Li C, Smeds L, Zhang G, Ellegren H. 2015. Temporal dynamics of avian populations during Pleistocene revealed by whole-genome sequences. Curr. Biol. 25, 1375–1380. ( 10.1016/j.cub.2015.03.047) [DOI] [PMC free article] [PubMed] [Google Scholar]
- 63.Zhao S, et al. 2013. Whole-genome sequencing of giant pandas provides insights into demographic history and local adaptation. Nat. Genet. 45, 67–71. ( 10.1038/ng.2494) [DOI] [PubMed] [Google Scholar]
- 64.Pérez-Tris J, Bensch S, Carbonell R, Helbig A, Tellería JL. 2004. Historical diversification of migration patterns in a passerine bird. Evolution 58, 1819–1832. ( 10.1554/03-731) [DOI] [PubMed] [Google Scholar]
- 65.Ruegg K, Slabbekoorn H, Clegg S, Smith T. 2006. Divergence in mating signals correlates with ecological variation in the migratory songbird, Swainson's thrush (Catharus ustulatus). Mol. Ecol. 15, 3147–3156. ( 10.1111/j.1365-294X.2006.03011.x) [DOI] [PubMed] [Google Scholar]
- 66.Ruegg K. 2008. Genetic, morphological, and ecological characterization of a hybrid zone that spans a migratory divide. Evolution 62, 452–466. ( 10.1111/j.1558-5646.2007.00263.x) [DOI] [PubMed] [Google Scholar]
- 67.Päckert M, Martens J, Kosuch J, Nazarenko AA, Veith M, Dunn P. 2003. Phylogenetic signal in the song of crests and kinglets (Aves: regulus). Evolution 57, 616–629. ( 10.1111/j.0014-3820.2003.tb01553.x) [DOI] [PubMed] [Google Scholar]
- 68.Barton NH, Hewitt GM. 1985. Analysis of hybrid zones. Annu. Rev. Ecol. Syst. 16, 113–148. ( 10.1146/annurev.es.16.110185.000553) [DOI] [Google Scholar]
- 69.Martin PR, Montgomerie R, Lougheed SC. 2015. Color patterns of closely related bird species are more divergent at intermediate levels of breeding-range sympatry. Am. Nat. 185, 443–451. ( 10.1086/680206) [DOI] [PubMed] [Google Scholar]
Associated Data
This section collects any data citations, data availability statements, or supplementary materials included in this article.
Supplementary Materials
Data Availability Statement
The entire dataset used in our analysis can be found in the electronic supplementary material.