

Abstract
A large number of published studies have shown that adaptive immunity to a particular antigen, including pathogen-derived, can be boosted by another, cross-reacting antigen while inducing suboptimal immunity to the latter. Although this phenomenon, called original antigenic sin (OAS), was first reported approximately 70 years ago (Francis et al. 1947 Am. J. Public Health 37, 1013–1016 (doi:10.2105/AJPH.37.8.1013)), its underlying biological mechanisms are still inadequately understood (Kim et al. Proc. Natl Acad. Sci. USA 109, 13 751–13 756 (doi:10.1073/pnas.0912458109)). Here, focusing on the humoral aspects of adaptive immunity, I propose a simple and testable mechanism: that OAS occurs when T regulatory cells induced by the first antigen decrease the dose of the second antigen that is loaded by dendritic cells and available to activate naive lymphocytes. I use both a parsimonious mathematical model and experimental data to confirm the deductive validity of this proposal. This model also explains the puzzling experimental observation that administering certain dendritic cell-activating adjuvants during antigen exposure alleviates OAS. Specifically, the model predicts that such adjuvants will attenuate T regulatory suppression of naive lymphocyte activation. Together, these results suggest additional strategies for redeeming adaptive immunity from the destructive consequences of antigenic ‘sin’.
Keywords: vaccine effectiveness, suboptimal immunity, influenza virus, mathematical modelling, virus dynamics
1. Introduction
It has previously been observed [1–9] that when adaptive immunity (i.e. both humoral and cellular immunity) to a particular antigen is boosted by a second antigen that cross-reacts with the first one, the resulting immune response reacts better with the first antigen compared with the second one. (In this paper, I consider two antigens to cross-react if lymphocytes induced by one antigen recognize the other one.) This phenomenon, called original antigenic sin (OAS) [10], represents a striking paradox in the field of immunology. In particular, it violates a basic rule in immunology established by McFarlane Burnet; that rule predicts that the second antigen would activate specific lymphocytes that proliferate and differentiate into effector cells capable of reacting better with that antigen compared with the first one [11]. More importantly, OAS compromises effector immune responses to infectious agents that cross-react with previously encountered antigens [4–8], with deleterious consequences on an individual's ability to control an infection.
OAS has been documented in a variety of species and with antigens derived from both pathogenic and non-pathogenic sources [1–10]. Its occurrence in response to antigens derived from influenza virus has, however, attracted the greatest attention. Indeed, OAS was first reported in a previous study of antibody responses found in 39 young adult humans who were infected in 1947 by a variant (or strain) of the influenza A (H1N1) virus called Rhodes, less than 1 year after being vaccinated with another cross-reacting strain called PR8 [4]. The researchers measured the ability of antibody-containing blood sera collected from the young adults to neutralize PR8 and Rhodes, using the neutralization assay. They discovered that, with sera collected during the acute phase of influenza disease, the neutralization titre against PR8 was three times larger than that against Rhodes [4]. In addition, even after convalescence, the neutralization titre against PR8 was still twice as large as that against Rhodes [4]. These results suggested that infection by Rhodes reinforced immunity to PR8. This conclusion was supported by subsequent analyses [1], which showed that neutralization titres against the strain that an individual encountered during childhood were generally higher than against other strains encountered later in life. More recent studies have further strengthened these earlier results, and also added more nuance to the understanding of the conditions in which OAS occurs.
In particular, experiments published recently have shown how the severity of OAS depends on the manner in which an individual is exposed to antigen [5]. Mice were sequentially infected with a mouse-adapted strain of PR8 and another cross-reacting strain called FM1. The neutralization titre against PR8 was found to be 12× larger in sequentially infected mice versus mice infected with PR8 alone [5], implying that FM1 reinforced immunity to PR8. However, immunity to FM1 itself was suboptimal; the neutralization titre against FM1 was approximately 10× smaller in sequentially infected mice versus immune controls—i.e. mice infected with FM1 alone. In addition, infecting both sequentially infected mice and immune controls with FM1, researchers found that the lungs of the former mice contained 104× more virus particles compared with the latter [5]. This indicates that the suppression of virus replication was profoundly impaired in the sequentially infected mice. Similar results were obtained after sequentially immunizing mice using DNA vaccines encoding the hemagglutinin surface proteins of both PR8 and FM1, although OAS was less severe in this case [5]. In contrast, no significant effect on antibody responses was observed when mice were sequentially immunized with inactivated whole PR8 and FM1 virus vaccines [5]. Nevertheless, after re-infecting the same mice with FM1, the lungs of sequentially immunized mice contained approximately 50× more virus particles than those of immune controls, implying that the former mice were less able to suppress virus replication. Thus, OAS occurs through various modes of antigen exposure—including infection (as in nature) and vaccination—with consistently destructive effects.
A recent study [6] investigated ways to mitigate OAS in mice sequentially exposed to two cross-reacting influenza virus strains. The researchers found that OAS could be prevented by administering certain dendritic cell-activating vaccine adjuvants during the second exposure [6], indicating that effector lymphocyte repertoires were beneficially altered by those adjuvants. Remarkably, they found that OAS could also be prevented by administering one of the considered adjuvants during the first exposure [6], implying that beneficial changes to effector lymphocyte repertoires that were elicited by that adjuvant persisted for at least as long as the time interval between the sequential exposures. What is the nature of those changes?
While it has been approximately 70 years since the phenomenon of OAS was first described [4], its underlying mechanism remains to be fully elucidated [6]. Past work has provided some useful insights. For example, it has been suggested that OAS might occur when antigen presentation is mostly effected by B cells, which are less efficient at this task than dendritic cells [6]. In addition, it has also been suggested that ‘negative interference’, whereby antibodies to the first antigen prevent the subsequent induction of antibodies to the second one, can explain some of the effects of OAS [12]. Similarly, a theoretical model showed that the ruggedness of the mapping from possible B cell receptor (BCR) sequences to antigen affinities can impede the discovery by affinity maturation of optimal BCRs subsequent to a sequential infection by cross-reacting strains [13]. These BCR dynamics are thought to contribute to the observation [12,14–16] that influenza vaccines tend to be less effective in individuals with prior exposure to potentially cross-reacting strains. There remains, however, considerable uncertainty concerning the precise biological mechanisms that underlie OAS [6]. In addition, the recently reported [6] effects of adjuvants on OAS require further elucidation.
In an attempt to shed additional light on the mechanistic causes of OAS, I present herein a new explanation of this phenomenon, as a logical consequence of immune suppression by cross-reacting T regulatory (Treg) lymphocytes. As I will show, this theory provides a logical explanation for the aforementioned effects of adjuvants. I will begin with a verbal description of the theory, and then develop and use a parsimonious mathematical model to validate the logic that underpins it.
2. Results
2.1. A verbal explanation of original antigenic sin
In the following, I will explain OAS as resulting from the interplay between effector and regulatory immune responses to two cross-reacting strains (denoted V1 and V2, respectively), focusing on B cell responses. (A particular strain typically contains many different antigens. It is trivial to apply this explanation to the special case when V1 and V2 consist of single antigens.) First, consider the response to V1 in an adaptive immune system that has not previously encountered any antigen that cross-reacts with V1. The immune system will not mount a specific lymphocyte response to V1. However, V1 will eventually activate specific naive lymphocytes, including: (i) B cells, which produce antibodies capable of neutralizing V1 and promoting its uptake by other immune cells [11], (ii) T helper cells, which enhance the activation and maturation of B cells [11,17,18] and (iii) Treg cells, which suppress the activation of both B and T helper cells by various mechanisms, including by reducing the ability of dendritic cells to present antigens to them [19–22]. A subset of the activated lymphocytes will persist long after V1 has been eliminated, poised to respond swiftly to a subsequent encounter with another, cross-reacting strain [11].
Now, consider a subsequent encounter with strain V2. If V2 is cross-reacting with V1, then a subset of the pre-existing V1-specific lymphocytes will be reactivated by V2. The strength of the humoral immune response to V2 will depend on the combined effects of these reactivated lymphocytes and previously naive lymphocytes that are newly activated by V2. Reactivated V1-specific Treg cells will suppress the presentation of V2-derived antigens by dendritic cells [22], thereby decreasing the antigen dose of V2 that is available to activate naive B lymphocytes and their specific T cell helpers [23]. In contrast, the reactivation of pre-existing V1-specific B and T helper lymphocytes will be less affected, because this requires a much lower antigen dose [24] in comparison with de novo activation of naive lymphocytes. If the resulting increase in the amount of reactivated V1-specific B lymphocytes fails to compensate for the Treg cell-mediated decrease in de novo activation of V2-specific B lymphocytes, then the humoral immune response to V2 will be suboptimal. This model explains parsimoniously why V2 can boost pre-existing B cell immunity to V1 while failing to induce optimal immunity to itself [1–6].
Interestingly, this new model predicts that OAS can be alleviated by activating dendritic cells. Specifically, activating dendritic cells will stabilize the antigens that are loaded by these cells [25], thereby increasing the antigen dose that they present to B lymphocytes [26] and their specific T cell helpers. This will render lymphocytes less sensitive to suppression by Treg cells [23,27], because suppression depends on a lymphocyte's activation threshold [28] being much greater than the available antigen dose. Eventually, this will lead to a larger number of both cross-reacting and specific B lymphocytes being activated and, hence, a stronger humoral immune response to V2. Importantly, these beneficial effects will occur whether dendritic cells are activated during exposure to V1 or V2. During exposure to V1, the dominant effect of dendritic cell activation will be through increased activation of V1-specific B lymphocytes, larger numbers of which will persist to subsequently cross-react with V2. On the other hand, during exposure to V2, the dominant effect of dendritic cell activation will be through both increased reactivation of existing V1-specific effector B lymphocytes and increased de novo activation of naive V2-specific B lymphocytes.
This verbal model explaining OAS and its alleviation by adjuvants can be difficult to grasp. Therefore, I will now use mathematical modelling both to confirm its underlying logic and to further explicate it.
2.2. Mathematical analysis of the verbal model
2.2.1. Mathematical model
Here, I develop a parsimonious mathematical instance of the verbal explanation given above. I include in the mathematical model only those biological events that I consider essential to the explanation—i.e. the interplay between influenza virus, cells that the virus infects, the humoral immune response to infection and regulation of this response by Treg cells. I focus on effector responses by B cells and IgG antibodies, which have also been the primary focus of most previous studies [1–6].
More specifically, the model consists of a system of ordinary differential equations describing the dynamics of influenza virus, uninfected and infected target cells, virus-specific B cells and the IgG antibodies they produce, and virus-specific Treg cells (figure 1a; equations (4.1)–(4.7)). Influenza virus preferentially infects epithelial cells found in the lungs of a mammalian host [30]. Infected epithelial cells subsequently produce new virus particles. Antigen-presenting cells such as dendritic cells load constitutively the virus-derived antigens [31]. The loaded antigens may be complexed to type I or type II major histocompatibility complexes (MHCs) and displayed on the surface of a dendritic cell, or they may be directly bound to the cell's membrane. Antigens that are bound to type II MHC molecules activate both Treg and T helper cells [11], whereas those that are bound to the cell membrane of follicular dendritic cells activate B cells [26]. B cells can also be activated by freely diffusing antigens, although this appears to occur less frequently in vivo [26]. In the light of these empirical facts, I assume that the activation rate of B cells is correlated with the antigen dose loaded by dendritic cells. This assumption also captures phenomenologically the enhancement of B cell activation by activated T helper cells subsequent to the interaction between the latter cells and antigen-bearing dendritic cells. Activated B cells produce antibodies that neutralize virus.
Figure 1.

Mathematical model of influenza virus dynamics in a mammalian host. (a) Schematic of the model. Details of the model are given in both the text and the Methods section. Arrows connecting two entities indicate positive interactions between them, whereas blunt-ended lines indicate negative interactions. (b,c) The model provides a reasonable fit to experimental data. I used the model described in (a) to simulate the infection of a mouse by 1500 50% egg-infective dose per ml (EID50 ml−1) of an influenza virus. I plotted (on a log-scale) the resulting dynamics of (b) virus load found in the mouse's lungs, and (c) antibody concentration found in the mouse's blood sera (see solid lines). For comparison, I also plotted experimental data [29] describing virus and IgG antibody concentrations that were respectively measured in the lungs and sera of infected mice (see circles). Electronic supplementary material, table S1 lists parameter values used in the simulation. (Online version in colour.)
In contrast to B cells, I assume that the activation rate of Treg cells decreases at higher doses of cognate antigen [19,27,32,33]. In addition, activated Treg cells suppress antigen presentation by dendritic cells [20–22,34], which I model by assuming that the loaded antigen dose is negatively correlated with Treg cell frequency. See Methods for a more detailed description of the mathematical model.
I chose parameter values (electronic supplementary material, table S1) that allow the model to predict reasonably well the in vivo dynamics of both influenza virus (figure 1b) and antibodies (figure 1c), which were previously measured [29] in mice. I then investigated whether OAS occurs in the parametrized model, and whether it can be alleviated by activating dendritic cells.
2.2.2. Original antigenic sin occurs in the mathematical model
I investigated whether OAS occurs in the model by simulating the sequential infection of a mouse by one strain of an influenza virus (denoted V1) followed 28 days later by another, cross-reacting strain (denoted V2). I also simulated the infection of a different mouse (immune control) by V2 alone. I then challenged both mice with V2. For comparison, I also challenged a naive mouse (with no prior infection) with V2. I calculated the peak virus load produced in each mouse after the challenge infection. I expected the immune mouse to effectively suppress the challenge infection [5,6]. In contrast, I expected OAS to impair the ability of the sequentially infected mouse to suppress the challenge infection [5,6]. Consistent with these expectations, the model predicts that prior immunization with the challenge virus produces a sterilizing immunity to a subsequent infection (figure 2). In contrast, a significant amount of virus is produced in the sequentially infected mouse after the challenge infection (figure 2), which is characteristic of OAS. Indeed, using a cross-reactivity value of 10% between the sequentially infecting strains (i.e. assuming there is a 10% chance that lymphocytes activated by one strain will recognize the other strain), the model reproduces quantitative effects of OAS on influenza virus loads that were previously observed in mice (figure 2) [6]. In the model, OAS does not occur for both very low (less than approx. 1%) and relatively high (greater than approx. 15%) cross-reactivity values, and it peaks at an intermediate value (electronic supplementary material, figure S1).
Figure 2.
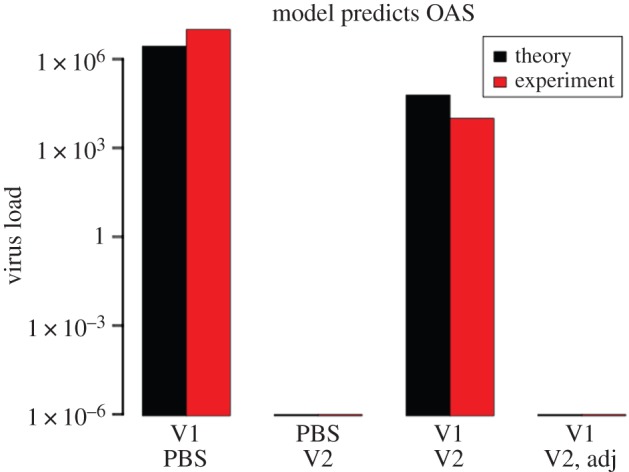
Original antigenic sin occurs in the mathematical model. I simulated the sequential infection of mice by 1500 EID50 ml−1 of strain V1 followed 28 days later by the same amount of strain V2, which cross-reacts with V1 (cross-reactivity σ = 10%). I then simulated a challenge infection by V2 occurring 28 days after the sequential V1–V2 infection, after infection by V2 alone (immune control), and after no prior infection (naive control). Furthermore, I simulated the injection of mice with dendritic cell-activating adjuvants during infection by V2 (denoted ‘Adj’ in the plot), by increasing the rate at which dendritic cells load antigens from an initial value of 10−3 ml/EID50/day to 10−1 ml/EID50/day. I plotted (on a log-scale) the peak amount of V2 that was produced in each challenged mouse (calculated as the peak virus load minus the challenge dose). For comparison, I also plotted the mean virus load (in plaque-forming units per ml) extracted from fig. 1b of reference [6]. As in reference [6], I use ‘PBS’ to denote the absence of a first (respectively second) infection. (Online version in colour.)
2.2.3. Model reproduces qualitative effects of original antigenic sin on antibodies
Next, I used the model to investigate the magnitude of the virus-specific antibody response found in both the immune and the sequentially infected mice. I calculated the probability that antibodies found in each mouse will neutralize a virus strain of interest. I expected the neutralization probability for V1 (respectively V2) to be higher (respectively lower) in the sequentially infected mouse than in immune mice [5,6]. As expected, the model predicts a much higher neutralization probability for V1 in the sequentially infected mouse versus the mouse previously infected by V1 alone (figure 3). This implies that V1-specific antibodies are boosted during the second infection by V2. In contrast, the neutralization probability for V2 is lower in the sequentially infected mouse versus the mouse infected with V2 alone (figure 3). Sequential infection decreases the neutralization probability for V2 because it lowers the antigen dose of V2 that dendritic cells load on their surface (figure 4) and thereby make available to activate specific B lymphocytes. These predicted effects of sequential infection on the magnitude of virus-specific antibody responses are in qualitative agreement with experience (e.g. see fig. 2b of reference [6]).
Figure 3.
OAS impairs antibody responses, which are restored by adjuvants. I simulated the infection of mice by 1500 EID50 ml−1 of strain V1 alone for a period of 28 days, a cross-reacting strain V2 alone for the same duration (cross-reactivity σ = 10%), or V1 followed 28 days later by V2. I simulated the injection of mice with dendritic cell-activating adjuvants during infection by V2 (denoted ‘Adj’ in the plot), by increasing the rate at which dendritic cells load antigens from an initial value of 10−3 ml/EID50/day to 10−1 ml/EID50/day. I then calculated and plotted the probability that a particular strain will be neutralized by antibodies found in each mouse 28 days after the last infection. For example, I defined the neutralization probability for V1 as f(A1 + σA2, λ, s), where the function f is given by equation (4.8), and A1 (A2) is the concentration of antibody induced by V1 (V2). λ and s are defined in Methods. As in reference [6], I use ‘PBS’ to denote the absence of a first (respectively second) infection. (Online version in colour.)
Figure 4.

Effects of varying adjuvant strength on antigen dose and B/Treg cell numbers. I simulated a sequential V1–V2 infection (cross-reactivity σ = 10%) as described in figure 2. I simulated the injection of mice with dendritic cell-activating adjuvants by increasing the rate at which these cells load antigens (denoted βD in the model) from 10−3 ml per EID50 per day to each value shown in the plot, during infection with either V1 (10) or V2 (20). I then plotted in a heatmap the integral of the calculated curves for antigen dose and B/Treg cell numbers. In the heatmap, Xa,b denotes the calculated value for entity X for strain a in the b’th infection. Values for each entity were measured while varying βD and then standardized (for improved visualization) before being plotted.
2.2.4. Model predicts that activating dendritic cells will alleviate original antigenic sin
A previous experimental study [6] reported that OAS resulting from a sequential infection by two cross-reacting strains can be alleviated by injecting mice with certain dendritic cell-activating adjuvants during either the first or the second infection. I investigated whether these puzzling observations also arise in the model by simulating a sequential V1–V2 infection followed by a challenge infection by V2, while activating dendritic cells during either the first or the second infection. The activation of dendritic cells increases the rate at which these cells load antigens on their surfaces [25,35]. In the model, this is equivalent to increasing the value of a single parameter, βD (Methods). Interestingly, I found that a 100-fold increase in the antigen-loading rate occurring during the second infection confers a sterilizing immunity to the challenge infection (figure 2). In contrast, a much larger increase in the rate of antigen-loading during the first infection is required to completely alleviate OAS (electronic supplementary material, figure S2).
2.2.5. Dendritic cell activation increases antigen dose and B cell numbers
The alleviation of OAS occurs through different mechanisms, depending on whether dendritic cells are activated during the first versus the second infection. On the one hand, activating dendritic cells during the first infection increases the antigen dose of V1 and boosts the activation of cross-reacting, V1-specific B cells (figure 4). These cross-reacting B cells can be quickly reactivated to produce antibodies that neutralize V2 during a challenge infection. The number of B cells induced by V2 during the second infection decreases, owing to an increase in the Treg cell frequency, but this is more than compensated for by the much higher number of previously activated cross-reacting V1-specific B cells (figure 4). On the other hand, activating dendritic cells during the second infection increases the antigen dose of V2 and boosts the (re)activation of both cross-reacting V1- and V2-specific B cells (figure 4), leading to a substantial increase in the amount of neutralizing antibodies (figure 3). Together, these results explain qualitatively the puzzling experimental data of Jacob and co-workers [6].
3. Discussion
For approximately 70 years, the phenomenon of OAS, whereby sequential exposure to two cross-reacting antigens leads to supra (sub)-optimal immunity to the first (second) antigen, has been documented in a large number of different biological systems [1–9]. However, its mechanistic basis remains to be fully elucidated [6]. In this study, focusing on humoral immunity, I explained OAS as a logical consequence of immune suppression mediated by Treg cells induced by the first antigen. These Treg cells decrease the dose of the second antigen that dendritic cells are able to load on their surface, thereby impeding the activation of naive B lymphocytes [26] and naive T helper cells [11] that have specificity for that antigen. In contrast, because previously activated lymphocytes with specificity for the first antigen are much more antigen-sensitive compared with naive lymphocytes [24], their reactivation by the second antigen is less affected by Treg cells. This leads to reinforcement of existing effector lymphocyte responses to the first antigen, but impaired generation of new responses to the second one. This provides an alternative biological explanation for the theoretical observation [13] that an inverse relationship exists between the number of effector memory B cells versus the number of naive B cells that are recruited into an immune response. I used numerical simulations of a simple mathematical model as well as experimental data to validate the logic underlying this new explanation of OAS (figure 2).
An interesting set of published experiments [6] showed that OAS can be alleviated in mice by administering certain dendritic cell-activating adjuvants during either the first or the second antigen exposure. The mathematical model illuminated these previous experimental observations. In particular, it predicted that, by increasing the antigen dose that is presented to naive lymphocytes (figure 4) [25,35], dendritic cell activation can indeed alleviate OAS (figures 2 and 3). This is because the increased antigen dose renders lymphocyte activation less sensitive to the presence of Treg cells. This prediction is consistent with in vitro experimental data showing that an increased antigen dose can attenuate Treg suppression of effector T cells [23]. In addition, the model predicted that a stronger degree of dendritic cell activation is required to alleviate OAS if administered during the first versus the second antigen exposure (electronic supplementary material, figure S2). Thus, the model can explain plausibly the experimental observations of Jacob and co-workers [6].
The results suggest that OAS can also be alleviated by other strategies that potentiate antigen presentation by dendritic cells. Such strategies include targeting specific antibody to the CD40 molecule expressed on the surface of dendritic cells [25]. In addition, because presentation of virus-derived antigens by HLA class II alleles with high expression levels is predicted to reduce effects of OAS, it might be beneficial to design vaccine immunogens so as to specifically target such alleles.
The model differs conceptually from a recently published model [36] that permits a deterministic analysis of a different mechanistic explanation for OAS, instances of which had previously been studied [12,13] using stochastic simulations. In particular, the earlier model [36] emphasizes the role of antibody affinity in explaining OAS, whereas the present model emphasizes the role of Treg suppression in explaining both OAS and its alleviation by adjuvants. Nevertheless, both the present model and the earlier one predict the same general relationship between OAS and the antigenic difference between virus strains (modelled here using the cross-reactivity parameter). Specifically, both models predict that OAS is negligible for both very low (resp. large) and relatively high (resp. small) values of cross-reactivity (resp. antigenic distance), but it peaks at an intermediate value (electronic supplementary material, figure S1).
The mathematical instantiation and analysis of the theory presented here focused on effects of OAS on humoral immunity [1–6] for improved expositional clarity and because this particular aspect of adaptive immunity has also received the most attention from previous authors. It is trivial to extend the mathematical model, so that effects of OAS on cellular immunity [7] can also be directly analysed.
It is very likely that multiple mechanisms underlie OAS and its alleviation by adjuvants. Here, I have illustrated one possible mechanism. Other mechanisms that might contribute to OAS include the competition for antigen between previously activated B cells with specificity for the first antigen and naive B cells with specificity for the second one [12], and localization of the B cell affinity maturation process in local minima induced by the mapping from individual BCRs to BCR-antigen affinities [13]. In addition, it is plausible that adjuvants might shift the population of antigen-presenting cells from mostly B cells to mostly dendritic cells [6], which are much more efficient at this task. The use of emerging technologies for high-throughput phenotyping of lymphocyte repertoires [37–39] will help to further refine our understanding of the molecular and cellular bases of immunological memory, and enable a more complete elucidation of the causal mechanisms of OAS.
4. Methods
4.1. The mathematical model
The model consists of the following system of ordinary differential equations:
| 4.1 |
| 4.2 |
| 4.3 |
| 4.4 |
| 4.5 |
| 4.6 |
| 4.7 |
where E− is the number of uninfected lung epithelial cells, whereas  is the rate at which it is changing. In the absence of virus (the total concentration of which is denoted V), E− is maintained at the steady-state value E0, with the rate parameter pE. Virus of strain i, i = 1, … ,n, infects uninfected epithelial cells at the rate βEVi, where Vi is the virus load. These infected cells (the number of which is denoted Ei) produce new virus of the same strain at the rate ɛV, and they die at the rate δE. Naive B and Treg cells of clonality i are activated at the rates bBf(Di,ηn,q) and bR[1 − f(Di, τn, q)]f(Di, τn, q)], respectively, where Di, 0 ≤ Di ≤ 1, is the fraction of sites on the surfaces of dendritic cells that are loaded with antigens derived from strain i (i.e. the antigen dose), and f is a saturation function given by
| 4.8 |
ηn is the effective antigen dose at which f is half-maximal, and q is the average number of antigens required to activate a lymphocyte.
Activated B and Treg cells of clonality i (the numbers of which are denoted Bi and Ri, respectively) proliferate upon encountering antigens derived from strain j at the rates pBf(σijDj, ηa, q) and pRf(σijDj, τa, q), respectively, where σij is the cross-reactivity between strains i and j. These cells die at the rates δB and δR, respectively. Activated B cells of clonality i produce IgG antibody of the same clonality (the concentration of which is denoted Ai) at the rate ɛA. This antibody neutralizes strain j at the rate cAf(σijAj, λ, s), where λ is the effective antibody concentration required for half-maximal neutralization, and s is the average number of antibodies required for neutralization. The function f is given by equation (4.8). This functional form of the neutralization rate is consistent with experimental data [40]. Antibody is cleared at the rate δA, whereas virus is cleared non-specifically (e.g. by cilia found on lung epithelial cells) at the rate cV. Furthermore, activated Treg cells decrease the loading of virus-derived antigens by dendritic cells [22]. Therefore, I assume that the antigen dose increases proportionally to the virus load, but decreases proportionally to the total number of Treg cells.
Supplementary Material
Acknowledgements
I thank Jonathan Dushoff and the three reviewers for their constructive comments on an earlier version of the paper.
Authors' contributions
W.N. conceived and performed the research, and wrote the paper.
Competing interests
I have no competing interest.
Funding
This work was supported by a grant from the International Development Research Centre (IDRC) to the African Institute for Mathematical Sciences Next Einstein Initiative (AIMS NEI).
References
- 1.Davenport F, Hennessy A, Francis T. 1953. Epidemiologic and immunologic significance of age distribution of antibody to antigenic variants of influenza virus. J. Exp. Med. 98, 641–656. ( 10.1084/jem.98.6.641) [DOI] [PMC free article] [PubMed] [Google Scholar]
- 2.Deutsch S, Bussard A. 1972. Original antigenic sin at the cellular level. I. Antibodies produced by individual cells against cross-reacting haptens. Eur. J. Immunol. 2, 374–378. ( 10.1002/eji.1830020416) [DOI] [PubMed] [Google Scholar]
- 3.De St. Groth F, Webster R. 1966. Disquisitions on original antigenic sin: I. Evidence in man. J. Exp. Med. 124, 347–361. (doi:10.1084/jem.124.3.331) [DOI] [PMC free article] [PubMed] [Google Scholar]
- 4.Francis T, Salk JE, Quilligan JJ. 1947. Experience with vaccination against influenza in the spring of 1947. Am. J. Public Health 37, 1013–1016. ( 10.2105/AJPH.37.8.1013) [DOI] [PMC free article] [PubMed] [Google Scholar]
- 5.Kim JH, Skountzou I, Compans R, Jacob J. 2009. Original antigenic sin responses to influenza viruses. J. Immunol. 183, 3294–3301. ( 10.4049/jimmunol.0900398) [DOI] [PMC free article] [PubMed] [Google Scholar]
- 6.Kim JH, Davis WG, Sambhara S, Jacob J. 2012. Strategies to alleviate original antigenic sin responses to influenza viruses. Proc. Natl Acad. Sci. USA 109, 13 751–13 756. ( 10.1073/pnas.0912458109) [DOI] [PMC free article] [PubMed] [Google Scholar]
- 7.Klenerman P, Zinkernagel RM. 1998. Original antigenic sin impairs cytotoxic T lymphocyte responses to viruses bearing variant epitopes. Nature 394, 482–485. ( 10.1038/28860) [DOI] [PubMed] [Google Scholar]
- 8.Nayak JL, Alam S, Sant AJ. 2013. Cutting edge: heterosubtypic influenza infection antagonizes elicitation of immunological reactivity to hemagglutinin. J. Immunol. 191, 1001–1005. ( 10.4049/jimmunol.1203520) [DOI] [PMC free article] [PubMed] [Google Scholar]
- 9.Webster R, Kasel J. 1976. Influenza virus subunit vaccines. II. Immunogenicity and original antigenic sin in humans. J. Infect. Dis. 134, 48–58. ( 10.1093/infdis/134.1.48) [DOI] [PubMed] [Google Scholar]
- 10.Francis T. 1960. On the doctrine of original antigenic sin. Proc. Am. Philos. Soc. 104, 572–578. [Google Scholar]
- 11.Murphy K, Travers P, Walport M. 2011. Janeway’s immunobiology. New York, NY: Garland Science. [Google Scholar]
- 12.Smith DJ, Forrest S, Ackley DH, Perelson A. 1999. Variable efficacy of repeated annual influenza vaccination. Proc. Natl Acad. Sci. USA 96, 14 001–14 006. ( 10.1073/pnas.96.24.14001) [DOI] [PMC free article] [PubMed] [Google Scholar]
- 13.Deem MW, Lee HY. 2003. Sequence space localization in the immune system response to vaccination and disease. Phys. Rev. Lett. 91, 068101 ( 10.1103/PhysRevLett.91.068101) [DOI] [PubMed] [Google Scholar]
- 14.Ndifon W, Dushoff J, Levin SA. 2009. On the use of hemagglutination-inhibition for influenza surveillance: surveillance data are predictive of influenza vaccine effectiveness. Vaccine 27, 2447–2452. ( 10.1016/j.vaccine.2009.02.047) [DOI] [PubMed] [Google Scholar]
- 15.McLean HQ, Thompson MG, Sundaram ME, Meece JK, McClure DL, Friedrich TC, Belongia EA. 2014. Impact of repeated vaccination on vaccine effectiveness against influenza A(H3N2) and B during 8 seasons. Clin. Infect. Dis. 59, 1375–1385. ( 10.1093/cid/ciu680) [DOI] [PMC free article] [PubMed] [Google Scholar]
- 16.Ohmit SE, et al. 2013. Influenza vaccine effectiveness in the 2011–2012 season: protection against each circulating virus and the effect of prior vaccination on estimates. Clin. Infect. Dis. 58, 319–327. ( 10.1093/cid/cit736) [DOI] [PMC free article] [PubMed] [Google Scholar]
- 17.Shedlock DJ, Shen H. 2003. Requirement for CD4T cell help in generating functional CD8T cell memory. Science 300, 337–339. ( 10.1126/science.1082305) [DOI] [PubMed] [Google Scholar]
- 18.Lanzavecchia A. 1985. Antigen-specific interaction between T and B cells. Nature 314, 537–539. ( 10.1038/314537a0) [DOI] [PubMed] [Google Scholar]
- 19.Takahashi T, Kuniyasu Y, Toda M, Sakaguchi N, Itoh M, Iwata M, Shimizu J, Sakaguchi S. 1998. Immunologic self-tolerance maintained by suppressive T cells: induction of autoimmune disease by breaking their anergic/suppressive state. Int. Immunol. 10, 1969–1980. ( 10.1093/intimm/10.12.1969) [DOI] [PubMed] [Google Scholar]
- 20.Haribhai D, Lin W, Relland LM, Truong N, Williams CB, Chatila TA. 2007. Regulatory T cells dynamically control the primary immune response to foreign antigen. J. Immunol. 178, 2961–2972. ( 10.4049/jimmunol.178.5.2961) [DOI] [PubMed] [Google Scholar]
- 21.Suvas S, Kumaraguru U, Pack CD, Lee S, Rouse BT. 2003. CD4+CD25+ T cells regulate virus-specific primary and memory CD8+ T cell responses. J. Exp. Med. 198, 889–901. ( 10.1084/jem.20030171) [DOI] [PMC free article] [PubMed] [Google Scholar]
- 22.Shevach EM. 2009. Mechanisms of Foxp3+ T regulatory cell-mediated suppression. Immunity 30, 636–645. ( 10.1016/j.immuni.2009.04.010) [DOI] [PubMed] [Google Scholar]
- 23.George TC, Bilsborough J, Viney JL, Norment AM. 2003. High antigen dose and activated dendritic cells enable Th cells to escape regulatory T cell-mediated suppression in vitro. Eur. J. Immunol. 33, 502–511. ( 10.1002/immu.200310026) [DOI] [PubMed] [Google Scholar]
- 24.Pihlgren M, Dubois PM, Tomkowiak M, Sjögren T, Marvel J. 1996. Resting memory CD8+T cells are hyperreactive to antigenic challenge in vitro. J. Exp. Med. 184, 2141–2151. ( 10.1084/jem.184.6.2141) [DOI] [PMC free article] [PubMed] [Google Scholar]
- 25.Obst R, van Santen H-M, Melamed R, Kamphorst AO, Benoist C, Mathis D. 2007. Sustained antigen presentation can promote an immunogenic T cell response, like dendritic cell activation. Proc. Natl Acad. Sci. USA 104, 15 460–15 465. ( 10.1073/pnas.0707331104) [DOI] [PMC free article] [PubMed] [Google Scholar]
- 26.Batista FD, Harwood NE. 2009. The who, how and where of antigen presentation to B cells. Nat. Rev. Immunol. 9, 15–27. ( 10.1038/nri2454) [DOI] [PubMed] [Google Scholar]
- 27.Billiard F, Litvinova E, Saadoun D, Djelti F, Klatzmann D, Cohen JL, Marodon G, Salomon BL. 2006. Regulatory and effector T cell activation levels are prime determinants of in vivo immune regulation. J. Immunol. 177, 2167–2174. ( 10.4049/jimmunol.177.4.2167) [DOI] [PubMed] [Google Scholar]
- 28.Viola A, Lanzavecchia A. 1996T. Cell activation determined by T cell receptor number and tunable thresholds. Nature 273, 104–106. ( 10.1126/science.273.5271.104) [DOI] [PubMed] [Google Scholar]
- 29.Miao H, Hollenbaugh JA, Zand MS, Holden-Wiltse J, Mosmann TR, Perelson AS, Wu H, Topham DJ. 2010. Quantifying the early immune response and adaptive immune response kinetics in mice infected with influenza A virus. J. Virol. 84, 6687–6698. ( 10.1128/JVI.00266-10) [DOI] [PMC free article] [PubMed] [Google Scholar]
- 30.Ibricevic A, Pekosz A, Walter MJ, Newby C, Battaile JT, Brown EG, Holtzman MJ, Brody SL. 2006. Influenza virus receptor specificity and cell tropism in mouse and human airway epithelial cells. J. Virol. 80, 7469–7480. ( 10.1128/JVI.02677-05) [DOI] [PMC free article] [PubMed] [Google Scholar]
- 31.Wilson N, El-Sukkari D, Villadangos J. 2004. Dendritic cells constitutively present self antigens in their immature state in vivo and regulate antigen presentation by controlling the rates of MHC class II synthesis. Blood 103, 2187–2195. ( 10.1182/blood-2003-08-2729.Supported) [DOI] [PubMed] [Google Scholar]
- 32.Turner MS, Kane LP, Morel PA. 2009. Dominant role of antigen dose in CD4+Foxp3+ regulatory T cell induction and expansion. J. Immunol. 183, 4895–4903. ( 10.4049/jimmunol.0901459) [DOI] [PMC free article] [PubMed] [Google Scholar]
- 33.Kretschmer K, Apostolou I, Hawiger D, Khazaie K, Nussenzweig MC, von Boehmer H. 2005. Inducing and expanding regulatory T cell populations by foreign antigen. Nat. Immunol. 6, 1219–1227. ( 10.1038/ni1265) [DOI] [PubMed] [Google Scholar]
- 34.Thornton AM, Shevach EM. 2000. Suppressor effector function of CD4+CD25+ immunoregulatory T cells is antigen nonspecific. J. Immunol. 164, 183–190. ( 10.4049/jimmunol.164.1.183) [DOI] [PubMed] [Google Scholar]
- 35.Cella M, Engering A, Pinet V, Pieters J, Lanzavecchia A. 1997. Inflammatory stimuli induce accumulation of MHC class II complexes on dendritic cells. Nature 388, 782–787. ( 10.1038/42030) [DOI] [PubMed] [Google Scholar]
- 36.Pan K. 2011. Understanding original antigenic sin in influenza with a dynamical system. PLoS ONE 6, e23910 ( 10.1371/journal.pone.0023910) [DOI] [PMC free article] [PubMed] [Google Scholar]
- 37.Robins HS, Campregher PV, Srivastava SK, Wacher A, Turtle CJ, Kahsai O, Riddell SR, Warren EH, Carlson CS. 2009. Comprehensive assessment of T-cell receptor β-chain diversity in αβ T cells. Blood 114, 4099–4107. ( 10.1182/blood-2009-04-217604) [DOI] [PMC free article] [PubMed] [Google Scholar]
- 38.Ndifon W, Gal H, Shifrut E, Aharoni R, Yissachar N, Waysbort N, Reich-Zeliger S, Arnon R, Friedman N. 2012. Chromatin conformation governs T-cell receptor Jβ gene segment usage. Proc. Natl Acad. Sci. USA 109, 15 865–15 870. ( 10.1073/pnas.1203916109) [DOI] [PMC free article] [PubMed] [Google Scholar]
- 39.Tan Y-C, Blum LK, Kongpachith S, Ju C-H, Cai X, Lindstrom TM, Sokolove J, Robinson WH. 2014. High-throughput sequencing of natively paired antibody chains provides evidence for original antigenic sin shaping the antibody response to influenza vaccination. Clin. Immunol. 151, 55–65. ( 10.1016/j.clim.2013.12.008) [DOI] [PMC free article] [PubMed] [Google Scholar]
- 40.Ndifon W, Wingreen NS, Levin SA. 2009. Differential neutralization efficiency of hemagglutinin epitopes, antibody interference, and the design of influenza vaccines. Proc. Natl Acad. Sci. USA 106, 8701–8706. ( 10.1073/pnas.0903427106) [DOI] [PMC free article] [PubMed] [Google Scholar]
Associated Data
This section collects any data citations, data availability statements, or supplementary materials included in this article.