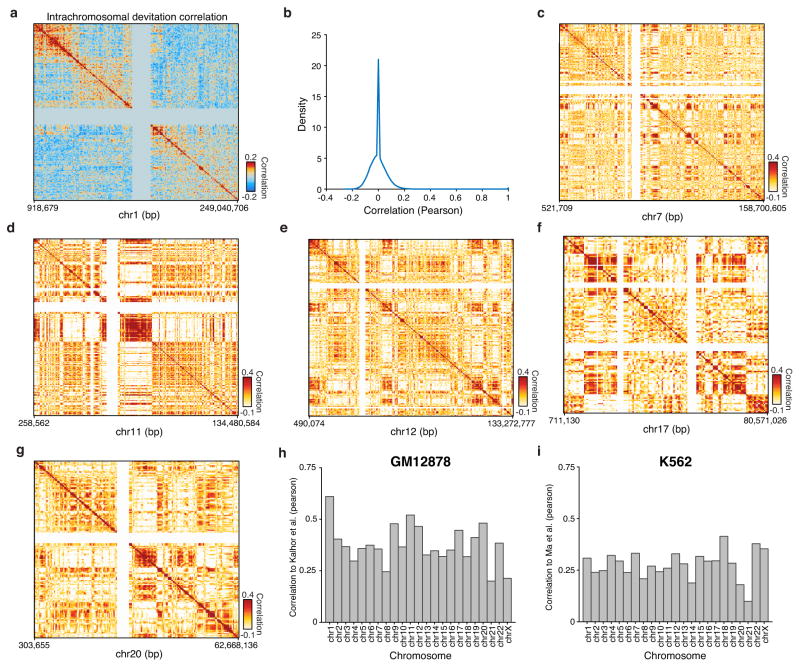
Extended Data Figure 9. Cis variability analysis within single-cells.
(a) Interchromosomal chromosome 1 co-correlations of deviation scores within single cells calculated for bins of 25 peaks within GM12878 cells. (b) Distribution, using density estimation, of correlation values shown in (a). (c–g) Analysis of cis-correlation (identical to Fig. 4) for representative chromosomes 7, 11, 12, 17, and 20. Correlation between scATAC-seq cis-correlation and chromosome conformation capture methods for each chromosome in (h) GM12878 and (i) K562 cells.

