Abstract
Purpose.
The purpose of our study is to develop and validate a model to predict visual field (VF) outcomes in patients with treated glaucoma.
Methods.
Data from 587 eyes with treated glaucoma evaluated in a cohort were used to develop two equations to predict VF outcomes, one estimating the risk of progression (%) and another estimating the global rate of VF sensitivity change (decibels [dB]/year). These equations, which included variables associated with VF progression in a multivariable model, then were tested in another cohort (n = 62 eyes) followed for at least 4 years. Agreement, discrimination, and calibration of the model in the validation sample were assessed as main outcome measures.
Results.
The mean difference between observed and predicted global rates of sensitivity change was 0.13 dB/year (95% confidence interval [CI] = 0.06 to 0.18 dB/year) and the mean difference between observed and predicted final VF mean deviation (MD) values was 0.37 dB (95% CI = 0.00 to 0.75 dB). The predictive model had moderate discriminative ability to estimate VF progression in the independent sample (c-index of 0.78, 95% CI = 0.59 to 0.97).
Conclusions.
To our knowledge, this is the first attempt to generate and validate a risk model for patients with treated glaucoma. The prediction model showed moderate accuracy in estimating future VF outcomes in an independent glaucoma population, and may be useful for the objective assessment of risk of progressive VF loss.
The prediction model showed moderate accuracy in estimating future VF outcomes in an independent glaucoma population and may be useful for assessment of risk of progressive VF loss.
Introduction
Not only is estimation of the risk and rate of structural and functional optic nerve damage critical to successful management of glaucoma, but validation of methods of estimation is equally important. Major National Institutes of Health (NIH) sponsored clinical trials have enhanced our understanding of factors associated with increased risk of developing glaucoma, and progression of damage in those with established disease.1–5 Nevertheless, risk assessment for eyes with established disc and field damage in clinical practice remains subjective and qualitative. Patients usually are classified as being at “high,” “moderate,” or “low” risk of glaucoma onset or progression on the basis of clinical features and risk factors. Such empirical approaches vary substantially among clinicians, and limit consistent and standardized case management, and the development of practice guidelines to enhance patient care.
There is an increasing need for an objective method to assess the risk of glaucoma onset and progression, particularly in relation to the rate of disease progression.6 This would allow clinicians to personalize individual treatment approaches, and to determine better the risk and benefit of treatment modifications. This challenge has been met partly for patients with ocular hypertension. The Ocular Hypertension Treatment Study (OHTS) Group,1 in collaboration with the European Glaucoma Prevention Study (EGPS)7 developed a 5-year risk calculator that permits objective estimation of the risk of conversion to glaucoma among patients with statistically elevated intraocular pressure (IOP) and normal visual field (VF) tests.8 This type of risk calculator improves clinician assessment regarding treatment versus observation.9–11
The use of the OHTS risk calculator, however, cannot be extrapolated to patients with established glaucoma. Moreover, the OHTS calculator was developed based on the natural history of ocular hypertension by evaluating the untreated arm of the cohort.8 This corresponds to a small proportion of patients in clinical practice, and none of those with established glaucomatous optic neuropathy and/or VF loss. Finally, the OHTS risk calculator uses baseline information to predict the future risk of progression over a 5-year period, but does not provide estimates of the rate of progression, and does not take into consideration the intercurrent variables that interact to increase the risk of progression, such as disc hemorrhage (DH),12 and IOP parameters, such as its peak, mean, and fluctuation.13–15
In a recent review on the importance of risk calculation in glaucoma, Mansberger et al. suggested that the development of a risk calculator for patients with established and treated disease would have profound impact on how clinicians manage their patients, similar to what has been observed with the OHTS calculator.11 Based on clinical information, such as disease severity and life expectancy, calculators for treated glaucoma also would likely increase agreement among clinicians with regard to future management of individual cases. One potential benefit of risk calculation in treated glaucoma is that it would allow clinicians to estimate objectively the risk of VF progression in the mid- and long-term before spending time and resources on numerous VF examinations or waiting until progression actually occurred.
We investigated the role of baseline and intercurrent clinical characteristics on the rate of VF progression in patients with established, treated glaucoma.15 A number of risk factors were associated significantly with progression in this population. Additionally, we used trend analysis to understand better the role of different risk factors on the rate of VF progression among patients treated with current modalities of therapy.
Our purpose in this study was 2-fold: (1) to develop a risk calculator for patients with established and treated glaucoma, and (2) to test the calculator in an independent population to determine its performance and clinical applicability.
Methods
We used data from two different studies at two different centers: a retrospective, observational study at the New York Eye and Ear Infirmary,15 and a prospective clinical trial at Bascom Palmer Eye Institute.16 Both studies followed the tenets of the Declaration of Helsinki, and were approved by the respective Institutional Review Board and Committee of Ethics. There were two parts to this study: 1) development of a calculator able to predict the risk (%) and rate (decibels [dB]/year) of glaucomatous VF progression based on data from a retrospective cohort (for didactic purposes this sample was named “reference” population), and 2) test the calculator in an independent cohort, and compare the predicted versus the observed outcomes (this cohort was termed the “validation” population).
The reference population consisted of 587 eyes from 587 patients from the New York Glaucoma Progression Study (GAPS) followed for a median of 6.7 years (interquartile range 5.3–8.0 years). Details of this population, methodology, and risk factor assessment have been described previously.15 All patients were experienced at perimetry, and had had at least 8 VF tests (24-2 SITA-Standard, Humphrey Field Analyzer II; Carl Zeiss Meditec, Inc., Dublin, CA) during a mean follow-up time of 6.4 ± 1.7 (range 2–10) years. Using trend analysis to evaluate VF progression, we reported a number of clinical variables significantly (P < 0.10) associated with rapid VF progression: age (years), central corneal thickness (CCT, microns), mean IOP (mm Hg), peak IOP (mm Hg), detection of disc hemorrhage, presence of beta-zone parapapillary atrophy (βPPA), presence of exfoliation syndrome (XFS), and follow-up time (years).
The validation population consisted of 62 eyes from 62 patients with perimetric glaucoma who were enrolled prospectively in the Advanced Imaging for Glaucoma Study (AIGS) at Bascom Palmer.16 The methods used to collect all variables were the same as the ones reported in GAPS.15 Inclusion criteria consisted of refractive error between −7.00 and +3.00 diopters (D), best corrected visual acuity ≥20/40, age range between 40 and 80 years, reliable standard automated perimetry (SAP, <33% rate of fixation losses, false positives, and false negatives) and no prior history of intraocular surgery except for uncomplicated cataract extraction. Subjects with ocular diseases other than glaucoma or cataract, best-corrected visual acuity <20/40, or unreliable SAP tests were excluded. All patients underwent a baseline examination consisting of a complete ophthalmic examination, including slit-lamp biomicroscopy, gonioscopy, Goldmann applanation tonometry, ultrasound pachymetry, dilated stereoscopic examination, and photography of the optic disc, and SAP testing. Follow-up SAP examinations were performed at 6-month intervals. All patients underwent a dilated eye examination with optic disc stereophotography at annual visits.
In the reference and validation populations, established glaucoma was defined as the presence of glaucomatous optic neuropathy associated with glaucomatous VF abnormalities. A glaucomatous VF was defined as the presence of a glaucoma hemifield test (GHT) outside normal limits and a pattern standard deviation (PSD) with P < 0.05 on at least two consecutive examinations.
Treatment modalities were chosen at the discretion of the attending glaucoma specialists in both cohorts. These could include topical medications (prostaglandin analogs, beta-blockers, carbonic anhydrase inhibitors, alpha-agonists, and cholinergic agents), laser therapy (selective laser trabeculoplasty, argon laser trabeculoplasty, peripheral iridotomy, and iridoplasty), and filtration surgery (trabeculectomy or shunt implants). This approach was chosen to resemble the current repertoire of glaucoma management, as opposed to standard protocols that may fail to consider individual patient needs.
Definition of Visual Field Progression
Both populations had their SAP sequences analyzed using trend analysis. Computerized point-wise linear regression (PLR) analysis was used to calculate global and localized rates of threshold sensitivity changes (PROGRESSOR software; Medisoft Ltd., Leeds, UK).17 We used the default definition of progressing VF locations provided by the manufacturer, that is a test point was deemed progressing if the rate of sensitivity decline was >1.0 dB/year at P < 0.01. For an eye to be considered progressing, at least two adjacent points in the same hemifield had to meet the above criteria. This definition likely improves specificity to define progression, as it takes into consideration the topographic orientation of the nerve fiber layer bundles that are damaged in glaucoma.
Development of the Model
Details on how the regression model was built have been described in detail previously.15 First, a logistic regression was used to evaluate the role of each IOP parameter on VF progression. All analyses were adjusted for the length of follow-up, which consisted of the time interval between the first and last VF tests entered in the analysis. Each variable was tested first in a univariable model. Those with P < 0.25 then were entered in the multivariable analysis. Since glaucoma filtering procedures lead to more substantial IOP lowering than medical therapy, which has been shown to slow the rates of VF progression,18,19 we included the occurrence of any type of incisional glaucoma surgery during follow-up in the multivariable model. Given that IOP variability during follow-up differs between filtered and non-filtered eyes,18,19 we also added the interaction term “glaucoma surgery*mean IOP” to the model. A backwards elimination procedure then was used to derive the final model (alpha-level = 0.05). The aforementioned variables were used to generate two equations: A) an equation in which the dependent variable is the risk of progression (%) in a given number of years based on the independent variables derived from our reference population, and B) an equation in which the dependent variable is the global rate of VF change, or rate of VF progression (dB/year).
-
A)
Risk equation:
 |
Where p is the probability of the outcome of interest, or dependent variable (VF progression); Logit(p) is the natural log of the odds ratio for progression; b0, b1, b2 … bk are the regression coefficients of the multivariable regression equation; and X1, X2, X3 … Xk are the independent variables (age, CCT, IOP, etc.).
Logit(p) can be back-transformed to p by the following formula:
 |
-
B)
Rate of progression equation:
 |
Where y is a dependent, continuous variable (global rate of VF change [dB/year]); β0, β1, β2 … βk are the regression coefficients of the multivariable regression equation; and X1, X2, X3 … Xk are the independent variables (age, CCT, IOP, etc.).
Following the selection of variables from the univariable models and generating the multivariable models, the following final equations were produced:
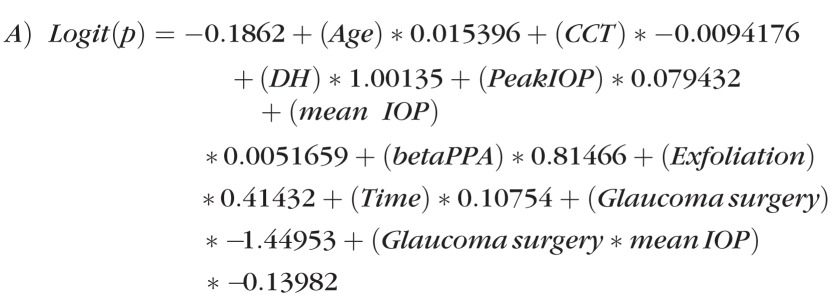 |
Where p can be obtained from the formula:
 |
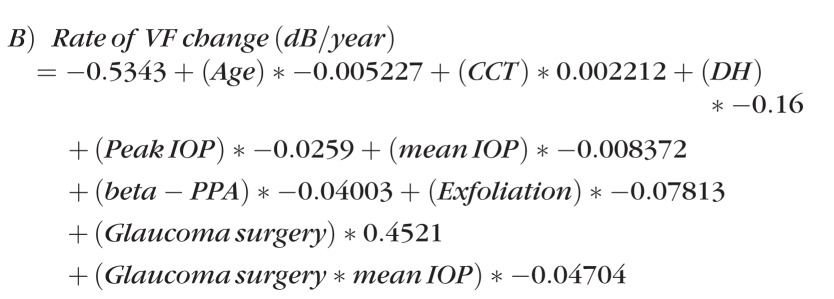 |
Assuming linearity of VF progression in glaucoma,20 one can estimate the final VF mean deviation (MD) after a given number of years applying the following equation:
 |
Where MDf is the final MD, MDb is the baseline MD, δ is the global rate of change (dB/year) obtained from equation B, and ΔT is the future time interval one wishes to predict the VF outcomes.
Main Outcome Measures
The equations for risk (%) and rate of progression (dB/year), which were developed based on the reference population, were tested in the validation population. We compared the performance of predicted and observed outcomes using the following methods:
Hosmer-Lemeshow test (test of goodness of the fit for the predictive model),
Bland-Altman plots comparing predicted versus observed rates of VF change as a continuous variable (dB/year),
Bland-Altman plots comparing predicted versus observed final VF MD values (dB),
Linear regression coefficients (R2) comparing predicted and observed final VF MD values,
Calibration of predicted and observed risks (%) of progression,
Calibration of global rates using categorical separation of subgroups based on quartiles of predicted rates of progression: very fast, fast, moderate, and slow progressors,
Performance of the model to discriminate risk (%) of progression and observed outcomes (c-statistic).
We used similar statistical approaches described in the reports validating the OHTS- and Diagnostics Innovation Glaucoma Study (DIGS)-derived risk models.8,21 Categorical variables were compared between the reference and validation samples using the chi-square test. Independent samples t-tests were used for comparisons of continuous variables. Discrimination was defined as the ability of a predictive model to separate glaucomatous eyes with and without progression. In other words, discrimination is an estimate of the probability that the model assigns a higher risk for those with progression compared with those who remained stable based on our predefined progression criteria.22 Discrimination was assessed by calculating the c-statistic as proposed by Harrell et al.,23 which is analogous to the area under the receiver operating characteristic curve. A c-index value of 0.5 indicates random predictions, whereas a value of 1.0 indicates perfect prediction.
Calibration measures how closely predicted outcomes agree with actual outcomes. To assess calibration, the predictive risks calculated for the validation population using the reference population-derived model were used to divide eyes into quartiles of predicted risk of progression.8,21 In each of the quartiles, the average predicted risk was compared with the average outcome during the follow-up time. Since a greater number of visual fields improves the performance of trend analysis to measure rates of progression minimizing the effect of VF variability,24 we tested the hypothesis that our model would predict the VF outcomes more accurately in eyes with longer sequences of tests. For that purpose, we performed a secondary analysis only on eyes with 10 or more VF tests. Computerized statistical analyses were performed using MedCalc (MedCalc software v.3.3; MedCalc, Inc., Mariakerke, Belgium) and SPSS version 16.0 (SPSS Inc., Chicago, IL).
Results
The equations describing the linear and logistic regression models were tested in the validation sample, and the results between predicted and observed outcomes were compared. The Hosmer-Lemeshow test showed that the final logistic model was able to fit the data correctly (P = 0.67). For the linear regression model, which used global rates of progression (dB/year) as a dependent variable, the coefficient of determination was R2 = 0.14, the adjusted-R2 was 0.13, and the multiple correlation coefficient was 0.37 at P < 0.001. The Table 1 compares clinical characteristics between the reference and validation populations. The reference population had worse mean baseline VF MD, higher peak and mean IOP, greater prevalence of exfoliation syndrome and βPPA, and were followed longer.
Table. 1.
Demographic and Ocular Characteristics of the Study Populations
|
BPEI (n
= 62) |
NY-GAPS (n
= 587) |
P Value |
|
| Age at baseline (years) | 67.4 ± 8.3 | 64.9 ± 13.0 | 0.03 |
| Baseline MD (dB) | −3.7 ± 4.4 | −7.1 ± 5.1 | < 0.01 |
| Vertical cup-disc ratio | 0.64 ± 0.1 | 0.72 ± 0.1 | < 0.01 |
| Mean CCT (μ) | 539.4 ± 38.4 | 540.9 ± 37.3 | 0.97 |
| Peak IOP (mm Hg) | 17.3 ± 4.5 | 19.9 ± 4.5 | < 0.01 |
| Mean IOP (mm Hg) | 13.4 ± 3.3 | 15.2 ± 3.1 | < 0.01 |
| N of eyes with DH (%) | 8 (13) | 53 (9) | 0.49 |
| N of eyes with βPPA (%) | 42 (67) | 370 (63) | 0.35 |
| Exfoliation syndrome (%) | 3 (4.8) | 84 (14) | 0.04 |
| N of eyes undergoing glaucoma surgery (%) | 6 (9.6) | 206 (35) | < 0.01 |
| Follow-up time (years) | 4.0 ± 0.9 | 6.4 ± 1.7 | < 0.01 |
Values are shown as mean ± SD. BPEI, Bascom Palmer Eyes Institute; NY-GAPS, New York Glaucoma Progression Study.
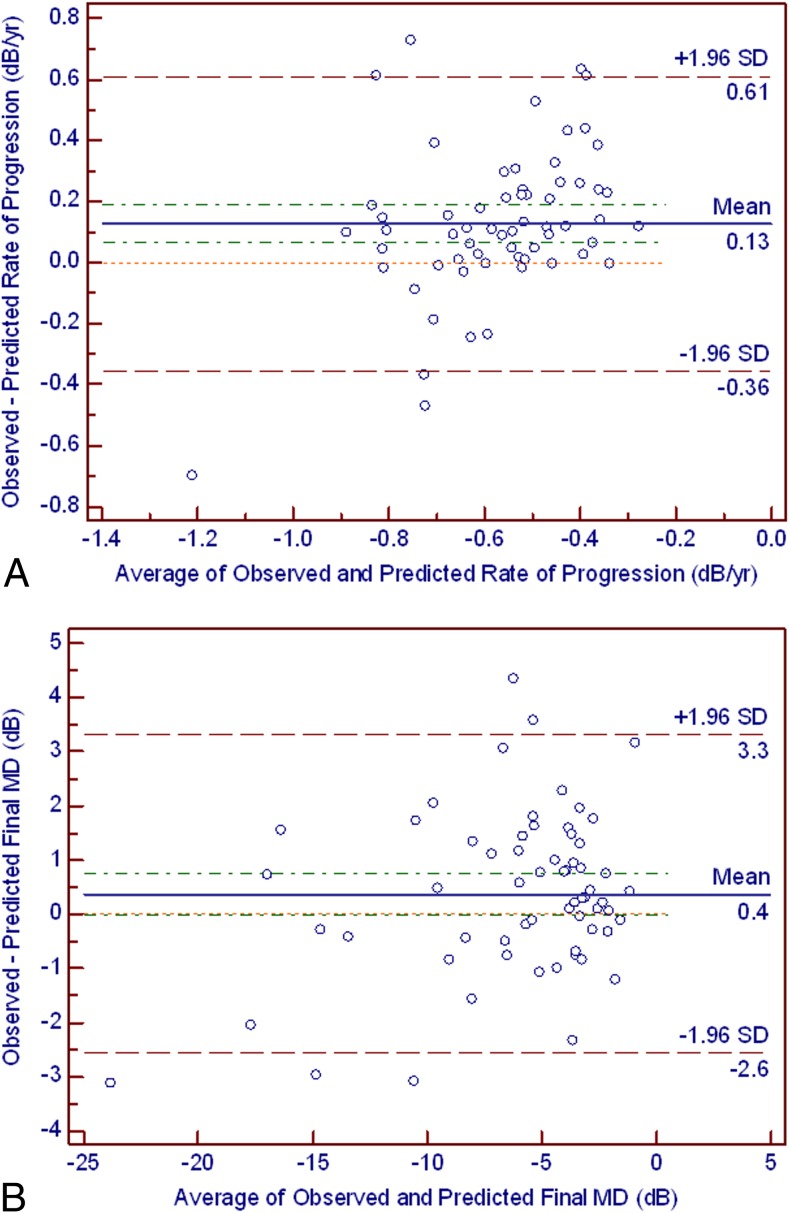
The mean difference between observed and predicted global rates of sensitivity change was 0.13 dB/year (95% CI = 0.06 to 0.18 dB/year). The distribution of individual values is shown in the Bland-Altman plots in Figure 1A. The mean difference between observed and predicted final VF MD values was 0.37 dB (95% CI = 0.00 to 0.75 dB, Fig. 1B). There also was a strong and significant correlation between predicted and observed final VF MD values (R2 = 0.90, P < 0.01).
Figure 1.
(A) The Bland-Altman plot illustrates the difference between the observed and predicted rates of visual field progression (y-axis) and their average (x-axis). The green dashed line corresponds to the 95% CI of the mean difference (0.06–0.18 dB). The red dashed line corresponds to the 95% limits of agreement (mean ± 1.96 SD, −0.35–0.61 dB). The orange dotted line in the middle represents the zero difference. (B) The Bland-Altman plot illustrates the difference between the observed and the predicted final MD values (y-axis) and their average (x-axis). The green dashed line corresponds to the 95% CI of the mean difference (0.00–0.75 dB). The red dashed line corresponds to the 95% limits of agreement (mean ± 1.96 SD, −2.56 to 3.31 dB). The orange dotted line in the middle represents the zero difference.
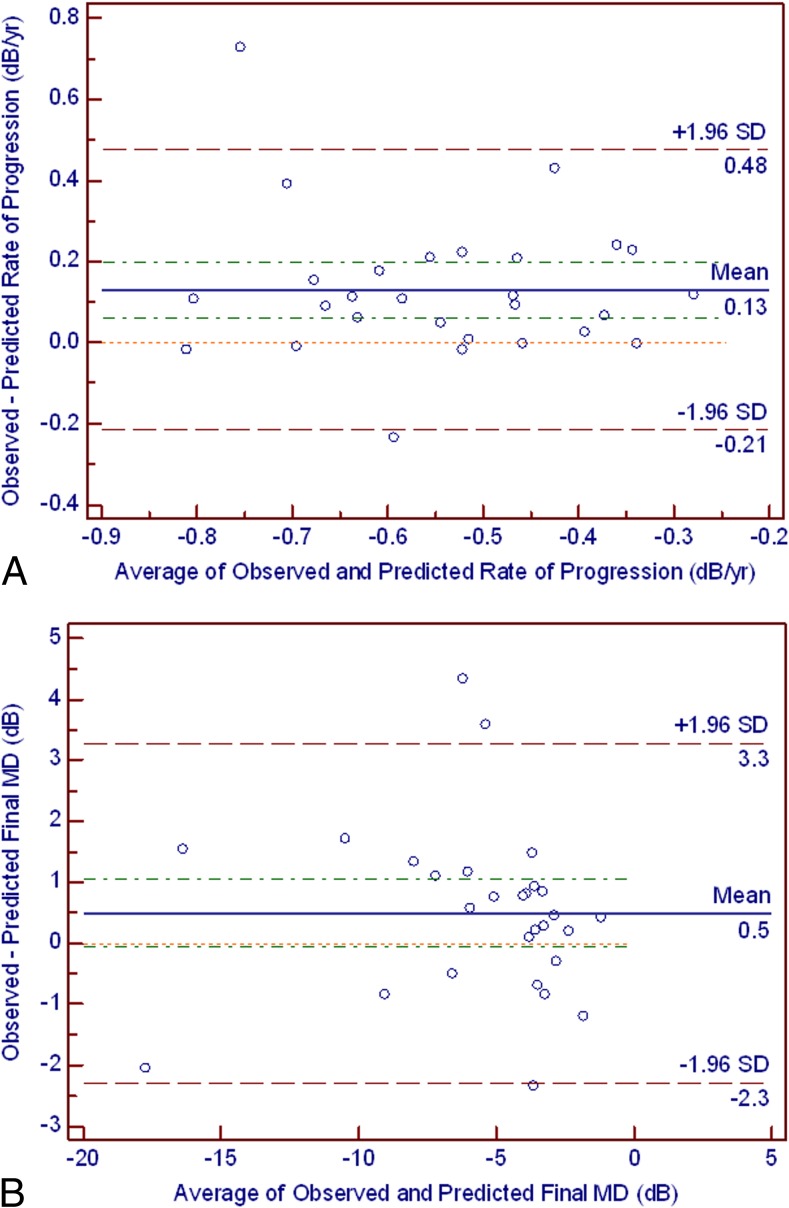
A secondary analysis was performed in a subgroup of eyes from the validation sample with 10 or more VF tests (n = 28 eyes). There was a discretely more uniform distribution of differences between predicted and observed values with more values ranging close to zero (Figs. 2A, 2B).
Figure 2.
(A) For the subset of eyes with 10 or more visual field tests, the Bland-Altman plot illustrates the difference between the observed and predicted rates of visual field progression (y-axis) and their average (x-axis). The green dashed line corresponds to the 95% CI of the mean difference (0.06–0.19 dB). The red dashed line corresponds to the 95% limits of agreement (mean ± 1.96 SD, −0.21–0.47 dB). The orange dotted line in the middle represents the zero difference. (B) For the subset of eyes with 10 or more visual field tests, the Bland-Altman plot illustrates the difference between the observed and predicted final MD values (y-axis) and their average (x-axis). The green dashed line corresponds to the 95% CI of the mean difference (−0.05–1.04 dB). The red dashed line corresponds to the 95% limits of agreement (mean ± 1.96 SD, −2.28–3.27 dB). The orange dotted line in the middle represents the zero difference.
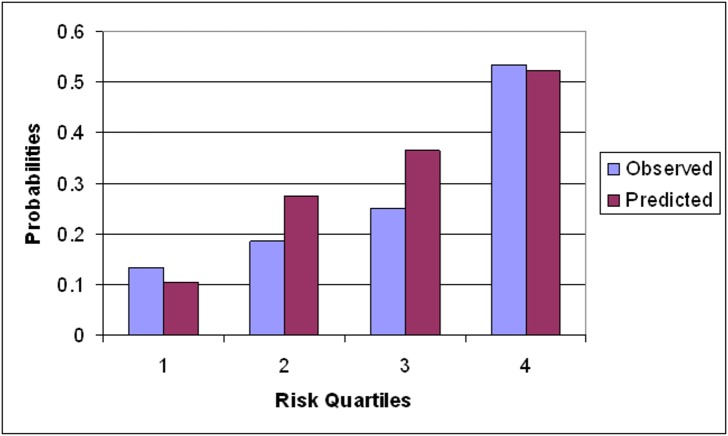
Figure 3 shows the calibration plots with predicted versus observed probabilities of glaucoma progression for the reference population-derived model when applied to the validation sample. Overall, there was good agreement between predicted and observed probabilities. The c-index for the entire sample was 0.78 (95% CI = 0.59 to 0.97). However, our model tended to overestimate progression, that is, tended to predict more progressing eyes than actually observed.
Figure 3.
Calibration plots of prediction of glaucoma progression based on our PLR criteria (two adjacent points in the same hemifield progressing faster than −1.0 dB/year at P < 0.01). The x-axis refers to the quartile of predicted risk based on our risk model. The y-axis refers to the observed frequency of eyes meeting PLR progression criteria within each quartile.
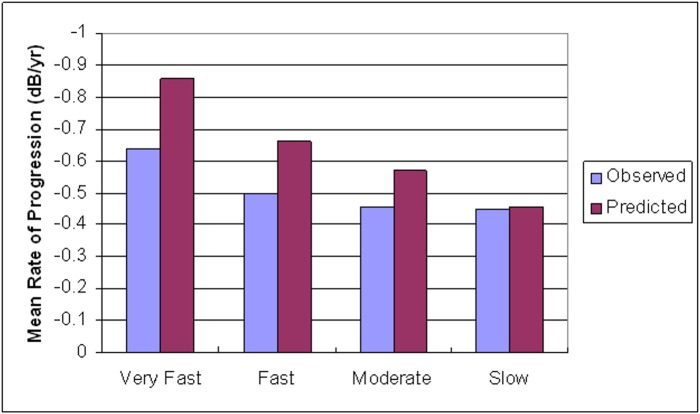
When comparing subgroups based on quartiles of predicted rates of progression (very fast, fast, moderate, and slow) the model tended to predict faster rates of progression in all groups. This overestimation was more pronounced among those with very fast rates of progression, and minimal among those with slow rates (Fig. 4).
Figure 4.
Comparison of the distribution of global rates of visual field sensitivity change (dB/year) between observed and predicted values in the validation sample. The x-axis corresponds to quartiles based on predicted global rates of progression (dB/year). The y-axis refers to the mean rate of progression within each quartile for observed and predicted values (very fast = −0.71 to −1.13, fast = −0.62 to −0.70, moderate = −0.51 to −0.61, slow = −0.33 to −0.50).
Discussion
We developed a risk model for patients with established and treated glaucoma based on risk factors identified previously in a population with similar characteristics.15 Two equations were generated: one that provides the risk of glaucoma progression (%) based on pre-defined PLR criteria in a given number of years, and another that estimates future rates of VF change based on clinical characteristics. Assuming linearity of glaucoma VF progression, the latter equation allowed estimating the VF MD value for an individual eye in a given number of years. Despite differences between the two populations and inherent challenges related to populations seen in clinical practice, our model revealed a moderate performance in prediction VF outcomes. Therefore, the calculator was robust despite the significant differences in the reference and validation populations illustrated in the Table. This observation supports the generalizability of our model to other populations, evidently taking into account a margin of error and the fact that the model tended to overestimate rates and risk of progression.
Risk models to predict future outcomes long have been used in medicine.25–29 Among the first and most important is the Framingham Risk Score, derived from the Framingham Heart Study to estimate the 10-year risk for coronary heart disease outcomes (myocardial infarction and coronary obstruction).28 This model has proven useful as a means of stratifying patients based on their risk profiles, which allows customized, individualized intervention. In ophthalmology, the OHTS and the DIGS developed risk models to assess the 5-year risk of conversion to primary open-angle glaucoma among patients with ocular hypertension,8,21 and have proven clinically useful by improving agreement rates among clinicians about the time to start treatment for ocular hypertensive patients.10,11 Boland et al. showed that using the OHTS risk calculator changed treatment recommendations by glaucoma specialists.10 They also noted that decisions became more consistent and more confident, and the average risk threshold for recommending treatment resembled those suggested by expert opinion and cost-benefit analysis.
Nevertheless, glaucoma is a complex, multifaceted disease and its long-term outcomes often are unpredictable. Both the OHTS8,21 and Framingham28,29 models revealed moderate performance when tested in different populations. In the OHTS and DIGS-derived models, the ability of the model to predict conversion to glaucoma based on probabilities and c-statistics revealed a moderate result (0.75 in both studies), which is similar to our finding in the much more complex scenario of established, treated disease. It is important to emphasize that the existing models provide risk estimates based on the natural history of the disease, and have been established based on the observation of prospective studies. Our model, on the other hand, included a heterogeneous population undergoing different modalities of treatment.15 The fact that treatment was not guided by standard protocols adds substantial source of variability to our model, even though its performance was comparable to what has been described for the other currently available models.
Our model is based on pooled data and, hence, should be interpreted with caution. For example, if one assumes a given average and peak follow-up IOP and optic disc characteristics (presence or absence of βPPA and optic disc hemorrhage), and that these variables will remain constant over a given number of years, one may estimate the risk and rate of progression given the current age, CCT, and visual field mean deviation. If the patient subsequently undergoes a filtering procedure that considerably lowers mean and peak IOP when a disc hemorrhage is first detected, a new calculation will be required to predict the new outcomes from that point on. Unlike the clinical trials in which patients are treated according to predefined treatment protocols, our patients (validation and reference groups) were treated according to clinicians' discretion.
Similar to the Framingham, OHTS, and DIGS risk models, the results of our risk calculator should be interpreted with caution. The basic assumptions in our model were a linear pattern of glaucomatous VF progression, a linear relationship between predictors, and no change in treatment during follow-up. The present model should not be used to determine changes in therapy. Rather, it may be useful in clinical practice to stratify objectively patients based on the risk and rate of VF progression, and numerically predict their future VF status. This combination of data may be useful when discussing with individual patients their risks and treatment options, as well as standardizing among clinicians the quantification of risk of progression in treated glaucoma patients.
One limitation of our model is that the adjusted R2 value of linear regression equation was low (0.13), which suggests that only 13% of the variance in the outcome variable (rates of progression) could be explained by the linear model. The causes of a small R2 in a linear regression are various, such as measurement error, biological variation, variables not entered in the model or sometimes entered as indirect estimates, and due to a non-linear relationship between outcome and predictor variables.30 These all are inherent limitations of using a mathematical model to explain a biological phenomenon that still is poorly understood, such as glaucoma progression. We are unable to compare our results directly with the OHTS/EGPS or DIGS calculators, since their publications do not report measures of goodness of the fit of their model, which was based on Cox proportional hazards modeling using an event-based approach. However, this observation underscores the importance of interpreting the results of the calculator with caution, not using its results to tailor glaucoma therapy, but rather providing an objective, numerical variable to measure risk and that could be added to the clinician repertoire of factors used to monitor glaucoma.
In conclusion, to our knowledge our report represents the first attempt to generate and validate a risk model for patients with treated glaucoma. Our prediction model demonstrated moderate accuracy in estimating future VF outcomes in an independent glaucoma population, and may be useful for assessment of risk and rate of progressive VF loss.
Footnotes
Supported by the Edith C. Blum Foundation and National Institute of Health Grant R01-EY013516, Bethesda, Maryland.
Presented in part at the 21st Meeting of the American Glaucoma Society, Dana Point, California, March 3–6, 2011.
Disclosure: C.G. De Moraes, None; M. Sehi, None; D.S. Greenfield, None; Y.S. Chung, None; R. Ritch, None; J.M. Liebmann, None
References
- 1. Gordon MO, Beiser JA, Brandt JD, et al. The Ocular Hypertension Treatment Study: baseline factors that predict the onset of primary open-angle glaucoma. Arch Ophthalmol. 2002;120:714–720. [DOI] [PubMed] [Google Scholar]
- 2. Leske MC, Heijl A, Hyman L, et al. Predictors of long-term progression in the early manifest glaucoma trial. Ophthalmology. 2007;114:1965–1972. [DOI] [PubMed] [Google Scholar]
- 3. Investigators. AGI. The Advanced Glaucoma Intervention Study (AGIS): 7. The relationship between control of intraocular pressure and visual field deterioration. Am J Ophthalmol. 2000;130:429–440. [DOI] [PubMed] [Google Scholar]
- 4. Musch DC, Gillespie BW, Lichter PR, Niziol LM, Janz NK. CIGTS Study Investigators. Visual field progression in the Collaborative Initial Glaucoma Treatment Study the impact of treatment and other baseline factors. Ophthalmology. 2009;116:200–207. [DOI] [PMC free article] [PubMed] [Google Scholar]
- 5. Medeiros FA, Sample PA, Zangwill LM, Bowd C, Aihara M, Weinreb RN. Corneal thickness as a risk factor for visual field loss in patients with preperimetric glaucomatous optic neuropathy. Am J Ophthalmol. 2003;136:805–813. [DOI] [PubMed] [Google Scholar]
- 6. Caprioli J. The importance of rates in glaucoma. Am J Ophthalmol. 2008;145:191–192. [DOI] [PubMed] [Google Scholar]
- 7. Miglior S, Torri V, Zeyen T, et al. Intercurrent factors associated with the development of open-angle glaucoma in the European glaucoma prevention study. Am J Ophthalmol. 2007;144:266–275. [DOI] [PubMed] [Google Scholar]
- 8. Ocular Hypertension Treatment Study Group, European Glaucoma Prevention Study Group, Gordon MO et al. Validated prediction model for the development of primary open-angle glaucoma in individuals with ocular hypertension. Ophthalmology. 2007;114:10–19. [DOI] [PMC free article] [PubMed] [Google Scholar]
- 9. Mansberger SL, Cioffi GA. The probability of glaucoma from ocular hypertension determined by ophthalmologists in comparison to a risk calculator. J Glaucoma. 2006;15:426–431. [DOI] [PubMed] [Google Scholar]
- 10. Boland MV, Quigley HA, Lehmann HP. The impact of risk calculation on treatment recommendations made by glaucoma specialists in cases of ocular hypertension. J Glaucoma. 2008;17:631–638. [DOI] [PubMed] [Google Scholar]
- 11. Mansberger SL, Medeiros FA, Gordon M. Diagnostic tools for calculation of glaucoma risk. Surv Ophthalmol. 2008;53:S11–S16. [DOI] [PMC free article] [PubMed] [Google Scholar]
- 12. Drance S, Anderson DR, Schulzer M. Collaborative Normal-Tension Glaucoma Study Group. Risk factors for progression of visual field abnormalities in normal-tension glaucoma. Am J Ophthalmol. 2001;131:699–708. [DOI] [PubMed] [Google Scholar]
- 13. Nouri-Mahdavi K, Hoffman D, Gaasterland D, Caprioli J. Prediction of visual field progression in glaucoma. Invest Ophthalmol Vis Sci. 2004;45:4346–4351. [DOI] [PubMed] [Google Scholar]
- 14. Asrani S, Zeimer R, Wilensky J, Gieser D, Vitale S, Lindenmuth K. Large diurnal fluctuations in intraocular pressure are an independent risk factor in patients with glaucoma. J Glaucoma. 2000;9:134–142. [DOI] [PubMed] [Google Scholar]
- 15. De Moraes CG, Juthani V, Liebmann JM, et al. Risk factors for visual field progression in treated glaucoma. Arch Ophthalmol. 2011;129:562–568. [DOI] [PubMed] [Google Scholar]
- 16. Grewal DS, Sehi M, Greenfield DS. Advanced Imaging in Glaucoma Study Group. Comparing rates of retinal nerve fibre layer loss with GDxECC using different methods of visual-field progression. Br J Ophthalmol. 2011;95:1122–1127. [DOI] [PMC free article] [PubMed] [Google Scholar]
- 17. Fitzke FW, Hitchings RA, Poinoosawmy D, McNaught AI, Crabb DP. Analysis of visual field progression in glaucoma. Br J Ophthalmol. 1996;80:40–48. [DOI] [PMC free article] [PubMed] [Google Scholar]
- 18. Medeiros FA, Pinheiro A, Moura FC, Leal BC, Susanna R., Jr. Intraocular pressure fluctuations in medical versus surgically treated glaucomatous patients. J Ocul Pharmacol Ther. 2002;18:489–498. [DOI] [PubMed] [Google Scholar]
- 19. Folgar FA, de Moraes CG, Prata TS, et al. Glaucoma surgery decreases the rates of localized and global visual field progression. Am J Ophthalmol. 2010;149:258–264. [DOI] [PubMed] [Google Scholar]
- 20. Bengtsson B, Patella VM, Heijl A. Prediction of glaucomatous visual field loss by extrapolation of linear trends. Arch Ophthalmol. 2009;127:1610–1615. [DOI] [PubMed] [Google Scholar]
- 21. Medeiros FA, Weinreb RN, Sample PA, et al. Validation of a predictive model to estimate the risk of conversion from ocular hypertension to glaucoma. Arch Ophthalmol. 2005;123:1351–1360. [DOI] [PubMed] [Google Scholar]
- 22. Pencina MJ, D'Agostino RB. Overall C as a measure of discrimination in survival analysis: model specific population value and confidence interval estimation. Stat Med. 2004;23:2109–2123. [DOI] [PubMed] [Google Scholar]
- 23. Harrell FE, Jr, , Lee KL, Mark DB. Multivariable prognostic models: issues in developing models, evaluating assumptions and adequacy, and measuring and reducing errors. Stat Med. 1996;15:361–387. [DOI] [PubMed] [Google Scholar]
- 24. Chauhan BC, Garway-Heath DF, Goñi FJ, et al. Practical recommendations for measuring rates of visual field change in glaucoma. Br J Ophthalmol. 2008;92:569–573. [DOI] [PMC free article] [PubMed] [Google Scholar]
- 25. Sheridan S, Pignone M, Mulrow C. Framingham-based tools to calculate the global risk of coronary heart disease: a systematic review of tools for clinicians. J Gen Intern Med. 2003;18:1039–1052. [DOI] [PMC free article] [PubMed] [Google Scholar]
- 26. Hong Kong Diabetes Registry, Yang X So WY et al. Development and validation of an all-cause mortality risk score in type 2 diabetes. Arch Intern Med. 2008;168:451–457. [DOI] [PubMed] [Google Scholar]
- 27. Dalton JE, Kurz A, Turan A, Mascha EJ, Sessler DI, Saager L. Development and validation of a risk quantification index for 30-day postoperative mortality and morbidity in noncardiac surgical patients. Anesthesiology. 2011;114:1336–1344. [DOI] [PubMed] [Google Scholar]
- 28. D'Agostino RB, Sr, , Grundy S, Sullivan LM., Wilson P. CHD Risk Prediction Group. Validation of the Framingham coronary heart disease prediction scores: results of a multiple ethnic groups investigation. JAMA. 2001;286:180–187. [DOI] [PubMed] [Google Scholar]
- 29. Hemann BA, Bimson WF, Taylor AJ. The Framingham Risk Score: an appraisal of its benefits and limitations. Am Heart Hosp J. 2007;5:91–96. [DOI] [PubMed] [Google Scholar]
- 30. Motulsky H. Intuitive Biostatistics. 2nd ed. New York, NY: Oxford; 2010;258–259. [Google Scholar]


