

Abstract
Down syndrome (DS) is the most common genetic cause of intellectual disability, due to partial or complete triplication of chromosome 21. DS subjects are characterized by a number of abnormalities including premature aging and development of Alzheimer’s disease (AD) neuropathology after approximately 40 years of age. Several studies show that oxidative stress plays a crucial role in the development of neurodegeneration in DS population. Increased lipid peroxidation is one of the main events causing redox imbalance within cells through the formation of toxic aldehydes that easily react with DNA, lipids and proteins. In this study we used a redox proteomics approach to identify specific targets of 4-hydroxynonenal modifications in the frontal cortex from DS cases, with and without AD pathology. We suggest that a group of identified proteins followed a specific pattern of oxidation in DS vs. young controls (CTRY), likely indicating characteristic features of DS phenotype; a second group of identified proteins showed increased oxidation in DS/AD vs. DS, thus possibly playing a role in the development of AD. The third group of comparison, DS/AD vs. old controls (CTRO), identified proteins that may be considered specific markers of AD pathology. All the identified proteins are involved in important biological functions including intracellular quality control systems, cytoskeleton network, energy metabolism and antioxidant response. Our results demonstrate that oxidative damage is an early event in DS, as well as dysfunctions of protein degradation systems and cellular protective pathways, suggesting that DS subjects are more vulnerable to oxidative damage accumulation that might contribute to AD development. Further, considering that the majority of proteins have been already demonstrated to be oxidized in AD brain, our results strongly support similarities with AD in DS.
Keywords: protein oxidation, Down syndrome, Alzheimer disease, redox proteomics, lipid peroxidation, HNE, trisomy 21
INTRODUCTION
Down syndrome (DS) is one of the most frequent chromosomal abnormalities, resulting from the triplication of the part of chromosome 21 [1–5], which causes intellectual disability. In addition to cognitive deficits, individuals with DS show signs of premature aging, immune disorders and other clinical pathologies [6]. By 35–40 years of age, a marked accumulation of senile plagues (SPs) and neurofibrillary tangles (NFTs), the common neuropathological features of Alzheimer’s Disease (AD), can be observed in DS brain [7, 8]. Interestingly, there are reports of diffuse SP in 8–12 year old persons with DS [9, 10], of the onset of dementia appears later after 50 years of age, suggesting a prodromal period where clinical signs are undetectable or minimal [11]. By studying autopsy samples from individuals with DS of various ages provides critical information regarding AD pathogenesis. Several studies showed that oxidative stress (OS) plays an important role in DS pathogenesis and in the development of AD pathology [12–15]. A recent study from our group reported increased OS conditions in brain of young DS people as indexed by increased carbonylation of specific proteins in the frontal cortex of DS subjects compared with non-DS cases [15]. Oxidative damage targets primarily proteasome and autophagy systems and may contribute to the disturbance of the proteostasis network in DS, thus potentially contributing to the development of AD [16]. Increased OS in DS most likely occurs as a consequence of overexpression of a subset of genes encoded by chromosome 21; among these, the most relevant as potent OS-inducers are APP (amyloid precursor protein) and SOD-1 (superoxide dismutase 1). APP is the protein from which Aβ (1–42) peptide, the major protein in SPs in both DS and AD is produced and Aβ (1–42) has been demonstrated to cause OS [17, 18]. SOD-1 has an important role in antioxidant defense catalyzing the dismutation of O2.− to molecular oxygen and H2O2, the latter decomposed in water by glutathione peroxide (GPX) and catalase (CAT). In DS the triplication of chromosome 21 leads to an increased production of H2O2, which is not followed by a similar increase of CAT and GPX, thus leading to an accumulation of H2O2 [19–21]. This compound, through the reaction with reduced form of redox-active transition metal ions, leads to the formation of the hydroxyl radicals that are able to react and damage biological macromolecules, such as DNA, lipids and proteins. In addition, superoxide can also react with nitric oxide, leading to the formation of peroxynitrite and other reactive nitrogen species (RNS).
In conditions of oxidative/nitrosative stress (OS/NS) proteins are highly vulnerable, and may be the target of a number of modifications that may affect their functions. Further, if the oxidized proteins are not properly repaired or removed, they may accumulate within cells and become toxic. Different types of oxidative modifications, including, among others, carbonylation, formation of mixed disulfides, nitration and formation of adducts with lipid peroxidation products can be detected as indexes of tissue specific damage.
Lipid peroxidation is one of the main events causing redox imbalance and subsequent build up of oxidative stress within the cell. Lipid peroxidation is able to directly damage membranes, but ROS can also interact with polyunsaturated fatty acids, leading to the formation of copious amounts of reactive electrophilic aldehydes that are able to covalent bind proteins by forming adducts with specific amino acids [22]. According to a series of factors, such as acyl chain length and degree of unsaturation, the lipid hydroperoxide that is formed by reaction of a carbon radical with oxygen, can decompose to produce reactive products such as MDA, HNE and acrolein. HNE is one of the most abundant and toxic aldehydes generated through ROS-mediated peroxidation of lipids and it is highly reactive electrophile [23]. HNE can accumulate in the cells and cause cell toxicity, membrane damage, disruption of Ca2+ homeostasis, cell death and with the other toxic aldehydes is elevated in several neurodegenerative disease [24]. This compound can covalently modify protein residues of cysteine, lysine and histidine by Michael addition altering protein structure and causing loss of function and activity [25, 26].
In the current study, we investigated the role of lipid peroxidation in DS in order to shed light on the molecular mechanisms that may trigger the development AD in DS subjects. Redox proteomics approaches [15] were used to analyze the frontal cortex of DS brain with and without AD pathology compared with age-matched control to identify HNE-modified brain proteins.
MATERIALS AND METHODS
Subjects
DS, DS with AD pathology (DS/AD) and age-matched young (CTRY) and old (CTRO) control cases (6 for each group) were obtained from the University of California-Irvine Alzheimer’s Disease Research Center Brain Tissue Repository. Table 1 shows the characteristics and demographic data of all included subjects in the study. All DS cases were under the age of 40, while all cases with both DS and AD were over the age of 40. Thus, for the current study, controls were split into two groups either less than or equal to 40 years or older than 40 years of age at death. The post mortem interval (PMI) was different across groups, 9.96±2.88 h for Young Control, 12.5±1.51 h for DS, 5.4±2.8 h for DS/AD and 8.9±6.2 h for Old Control. Subgroups used in this study were selected in order to maintain homogenous age and gender inside the groups and are part of the entire cohort used in a previous experiment to investigate insoluble Aβ and total oxidation as a function of age in DS [15].
Table 1.
Individuals demographic data, AA= African American, Ca= Caucasian, In = Indian
| Subjects | PMI | Age | Sex | Race | Cause of death |
|---|---|---|---|---|---|
| Control Y 1 | 5,8 | 39 | Female | Unknown | Unknown |
| Control Y 2 | 12 | 22.8 | Male | African American | Arrhythmia due to hypertrophy cardiomyopathy |
| Control Y 3 | 8 | 33.1 | Male | Caucasian | Cardiac Arrhythmia |
| Control Y 4 | 10 | 24.4 | Male | Caucasian | Multiple injuries |
| Control Y 5 | 10 | 10.8 | Female | Caucasian | Asthma |
| Control Y 6 | 14 | 19.8 | Male | Caucasian | Multiple injuries |
| CTR Y | 9.96±2.88 | 24.9±9.95 | 4M, 2F | 1AA, 4 Ca | |
| DS 1 | 12 | 1.9 | Male | Caucasian | Unknown |
| DS 2 | 14 | 15.5 | Male | Caucasian | Chromosome disorder, Trisomy 21 |
| DS 3 | 10 | 40.6 | Male | African American | HCVD (Hypertensive Cardiovascular Disease) |
| DS 4 | 12 | 39.2 | Female | Caucasian | Cancer |
| DS 5 | 13 | 44.5 | Female | Caucasian | Cardiac Arrhythmia |
| DS 6 | 14 | 19.9 | Male | Indian | Cardiopulmonary arrest: congenital heart disease |
| DS | 12.5±1.51 | 26.9±17.04 | 4M, 2F | 1AA, | |
| DS-AD 1 | 5.3 | 57 | Female | Unknown | Seizure Disorder |
| DS-AD 2 | 3 | 63 | Female | Unknown | Respiratory |
| DS-AD 3 | 6 | 63 | Female | Unknown | Unknown |
| DS-AD 4 | 4.5 | 55 | Male | Unknown | Pneumonia |
| DS-AD 5 | 10.5 | 61 | Male | Unknown | Unknown |
| DS-AD 6 | 3 | 57 | Female | Unknown | Pneumonia |
| DS AD | 5.4±2.8 | 59.3±3.44 | 2M, 4F | ||
| Control O 1 | 5 | 47.3 | Female | Caucasian | Pneumonia |
| Control O 2 | 8 | 64 | Female | Unknown | Myocardial infarction |
| Control O 3 | 17 | 56.8 | Male | Caucasian | HACVD (Hypertensive Arteriosclerotic Cardiovascular Disease) |
| Control O 4 | 16 | 55.3 | Male | Caucasian | Arteriosclerotic Cardiovascular Disease |
| Control O 5 | 4.5 | 65 | Male | Unknown | Cardiac Arrest |
| Control O 6 | 2.7 | 67 | Male | Unknown | Cardiomyopathy |
| Control O | 8.9±6.2 | 59.2±7.48 | 4M, 2F | 3Ca |
Sample preparation
Brain tissue (frontal cortex, around 20 mg per sample) from DS, DS/AD and controls (6 per group) were homogenized in Media 1 lysis buffer (pH 7.4) containing 320 mM Sucrose, 1% of 990 mM Tris-HCl (pH = 8.8), 0.098 mM MgCl2, 0.076 mM EDTA, the proteinase inhibitors leupeptin (0.5 mg/mL), pepstatin (0.7µg/mL), aprotinin (0.5mg/mL), and PMSF (40 µg/mL) and phosphatase inhibitor cocktail (Sigma-Aldrich, St Louis, MO, USA). Homogenates were centrifuged at 14,000×g for 10min to remove debris. Protein concentration in the supernatant was determined by the Bradford assay (Pierce, Rockford, IL, USA).
Measurement of total protein-bound 4-hydroxy-2-trans-nonenal (HNE-bound protein)
For the analysis of HNE-bound protein levels, 10 µl of frontal cortex homogenate were incubated with 10 µl of Laemmli buffer containing 0.125 M Tris base pH 6.8, 4% (v/v) SDS, and 20% (v/v) glycerol. The resulting samples (250 ng per well) were loaded onto a nitrocellulose membrane with a slot-blot apparatus under vacuum pressure. The membrane was blocked for 2 h with a solution of 3% (w/v) bovine serum albumin in PBS containing 0.01% (w/v) sodium azide and 0.2% (v/v) Tween 20 and incubated with a rabbit polyclonal anti-4-hydroxynonenal antibody (1:3000; HNE-13M, Alpha Diagnostics, San Antonio, TX) for 2 h at room temperature. This antibody specifically recognizes HNE-modified proteins. Membranes were washed and incubated with anti-rabbit IgG alkaline phosphatase secondary antibody (1:5000; Sigma-Aldrich) for 1 h at room temperature. Blots were dried and scanned by GS-800 Densitometer (BioRad) and analyzed by quantity One (4.6.9 version; Bio-Rad, Hercules, CA, USA).
2D electrophoresis
Brain samples proteins (200 µg) were precipitated in 15% final concentration of trichloroacetic acid for 10 min in ice. Subsequently each sample was centrifuged at 10 000 g for 5 min and precipitates were washed in ice-cold ethanol-ethyl acetate 1:1 solution three times. The final pellet was dissolved in 200µl rehydration buffer (8 M urea, 20 mM dithiothreitol (DTT), 2.0% (w/v) Chaps, 0.2% Bio-Lyte, 2M thiourea, and bromophenol blue). First-dimension electrophoresis (isoelectric focusing) was performed with ReadyStrip IPG Strips (11 cm, pH 3–10; Bio-Rad, Hercules, CA, USA) at 300V for 2h linearly, 500V for 2h linearly, 1000V for 2h linearly, 8000 V for 8 h linearly, and 8000 V for 10 h rapidly. All the above processes were carried out at room temperature. After the first-dimension run the strips were equilibrated two times, first for 10 min in 50 mM Tris–HCl (pH 6.8) containing 6 M urea, 1% (w/v) sodium dodecyl sulfate (SDS), 30% (v/v) glycerol, and 0.5% DTT and again for another 10 min in the same buffer containing 4.5% iodoacetamide in place of DTT. The second dimension was performed using 12% precast Criterion gels (Bio-Rad). The gels were incubated in fixing solution (7% acetic acid, 10% methanol) for 45 min and then stained for 1h in Bio-Safe Coomassie gel stain (Bio-Rad, Hercules, CA, USA) and destained overnight in deionized water. The Coomassie gels were scanned using a GS 800 densitometer (Bio-Rad, Hercules, CA, USA).
2D Western blot
For 2D Western blot, 2D gels (200 µg of proteins) were blotted onto nitrocellulose membranes (Bio-Rad, Hercules, CA, USA) and HNE-protein adducts were detected on the membranes. Briefly, membranes were blocked for 1 h with 3% albumin in T-TBS, incubated with the primary Mouse Monoclonal anti-HNE antibody (1:500; Alpha Diagnostic, San Antonio, TX, USA) for 2h at room temperature. After washing with T-TBS three times for 5 min, membranes were further incubated at room temperature for 1 h with the secondary antibody alkaline phosphatase-conjugated anti-mouse IgG (1:5000; Sigma-Aldrich, St Louis, MO, USA). Membranes were then washed with T-TBS three times and developed using 5-bromo-4-chloro-3-indolyl phosphate/nitroblue tetrazolium solution (BCIP/NBT).
Image analysis
2D gels and 2D blots (24 gels and 24 blots) were analyzed by PD-Quest 2D Analysis (7.2.0 version; Bio-Rad, Hercules, CA, USA). PD-Quest spot-detection software allows the comparison of 2D gels as well as 2D blots, from different groups. Powerful auto-matching algorithms quickly and accurately match gels or blots and sophisticated statistical analysis tools identify experimentally significant spots. The intensity value for each spot from an individual gel is normalized using the average mode of background subtraction. This intensity is afterward compared between groups using statistical analysis. Statistical significance was assessed using a two-tailed Student’s t-test. P values <0.05 were considered significant for comparison between control and experimental data (CTR vs. DS). PD-Quest software allows normalization of a carbonylated spot intensity on the blot for expression level of the same spot on the gel.
Trypsin digestion and protein identification by mass spectrometry
Protein spots identified statistically different from controls after PD-Quest analysis were digested in-gel by trypsin. Briefly, spots of interest were excised and then washed with 0.1 M ammonium bicarbonate (NH4HCO3) at room temperature for 15 min. Acetonitrile was added and incubated at room temperature for 15min. This solvent mixture was then removed and gel pieces were dried. The protein spots were then incubated with 20 ml of 20 mM DTT in 0.1 M NH4HCO3 at 56 °C for 45 min. The DTT solution was removed and replaced with 20 ml of 55 mM iodoacetamide in 0.1 M NH4HCO3. The solution was then incubated at room temperature for 30 min. The iodoacetamide was removed and replaced with 0.2 ml of 50 mM NH4HCO3 at room temperature for 15 min. Acetonitrile (200 ml) was added. After 15 min incubation, the solvent was removed, and the gel spots were dried for 30 min. The gel pieces were rehydrated with 20 ng/ml modified trypsin (Promega, Madison, WI, USA) in 50 mM 67 NH4HCO3 with the minimal volume necessary to cover the gel pieces. The gel pieces were incubated overnight at 37 °C in a shaking incubator. Protein spots of interest were excised and subjected to in-gel trypsin digestion, and the resulting tryptic peptides were analyzed with MALDI ToF. MALDI-ToF MS analyses were performed in a Voyager-DE STR instrument (Applied Biosystems, Framingham, MA, USA) equipped with a 337 nm nitrogen laser and operating in reflector mode. Mass data were obtained by accumulating several spectra from laser shots with an accelerating voltage of 20 kV. Two tryptic autolytic peptides were used for the internal calibration (m/z 842.5100 and 2807.3145).
Data were analysed by MoverZ program (http://bioinformatics.genomicsolutions.com), according to default parameters. Identification by peptide mass fingerprint (PMF), with the mono-isotopic mass list, after exclusion of expected contaminant mass values by Peak Erazor program (http://www.protein.sdu.dk/gpmaw/Help/PeakErazor/peakerazor.html), was performed using the Mascot search engine (v. 2.3) against human SwissProt database [(Swis- sProt 2011_08 (531473 sequences; 188463640 residues)]. Up to one missed cleavage, 50 ppm measurement tolerance, oxidation at methionine (variable modification) and carbamidomethylation at cysteine (fixed modification) were considered. Identifications were validated when the probability-based Mowse protein score was significant according to Mascot.
Western blot
For Western blot, 40 µg of proteins (CTR young, old and DS with and without AD) were separated by 12% SDS–PAGE and blotted onto a nitrocellulose membrane (Bio-Rad, Hercules, CA, USA). Membrane was blocked with 3% bovine serum albumin in T-TBS and incubated for 1 h and 30 min at room temperature with primary anti-SOD-1 (1:500; Santa Cruz Biotechnology, Dallas, TX, USA) and for 1 h at room temperature with secondary antibody horseradish peroxidase-conjugated anti-mouse IgG (1:5000; Sigma–Aldrich, St Louis, MO, USA). Membrane was developed with the Super Signal West Pico chemiluminescent substrate (Thermo Scientific, Waltham, MA, USA), acquired with Chemi-Doc MP (Bio-Rad) and analyzed using Image Lab software (Bio-Rad).
Immunoprecipitation of GRP78
To confirm the correct identification of the proteins determined by MS, the identification of GRP78 was validated using immunochemical methods. Samples (100 µg of proteins) were incubated overnight with I.P. buffer (500 µl) and the antibody anti-GRP78, followed by 2h of incubation with Protein G sepharose beats, and then washed three times with RIA buffer. Proteins were separated by SDS-PAGE followed by immunoblotting on a nitrocellulose membrane (Bio-Rad). Membrane were incubated with the antibody anti-HNE and then detected by the peroxidase-conjugated secondary antibody (1:5000; Sigma–Aldrich, St Louis, MO, USA) with Super Signal West Pico chemiluminescent substrate (Thermo Scientific, Waltham, MA, USA). Membranes were then acquired with Chemi-Doc MP (Bio-Rad) and analyzed using Image Lab software (Bio-Rad).
Native gel electrophoresis
SOD-1 aggregates was identified by non-denaturing polyacrylamide gel electrophoresis. Proteins (50µg) were separated by non-denaturing electrophoresis. Samples were diluted in a Sample Buffer 5X without SDS, and also the electrophoresis buffer is without SDS, and then blotted onto a nitrocellulose membrane. Membrane was blocked with 3% bovine serum albumin in T-TBS and incubated for 1 h and 30 min at room temperature with primary anti-SOD-1 (1:500; Santa Cruz Biotechnology, Dallas, TX, USA) and for 1 h at room temperature with secondary antibody horseradish peroxidase-conjugated anti-mouse IgG (1:5000; Sigma–Aldrich, St Louis, MO, USA). Membrane was developed with the Super Signal West Pico chemiluminescent substrate (Thermo Scientific, Waltham, MA, USA), acquired with Chemi-Doc MP (Bio-Rad) and analyzed using Image Lab software (Bio-Rad).
Statistical analysis
Statistical analyses of data obtained by PD-QUEST software were performed using Student’s t-test. Significance was accepted if the p value < 0.05. Since DS/AD PMI is significantly different in comparison to the other three groups we performed linear regression analyses between total protein-HNE modification and PMI in order to test if total oxidation was affected by PMI variable. Moreover, to investigate if our experimental data are influenced by genotype (DS), age group or both and the interaction of such factors we used a 2-way ANOVA analysis (Fig. 1 and table 3).. All statistical analyses were performed using GraphPad Prism 5.0 software.
Figure 1.
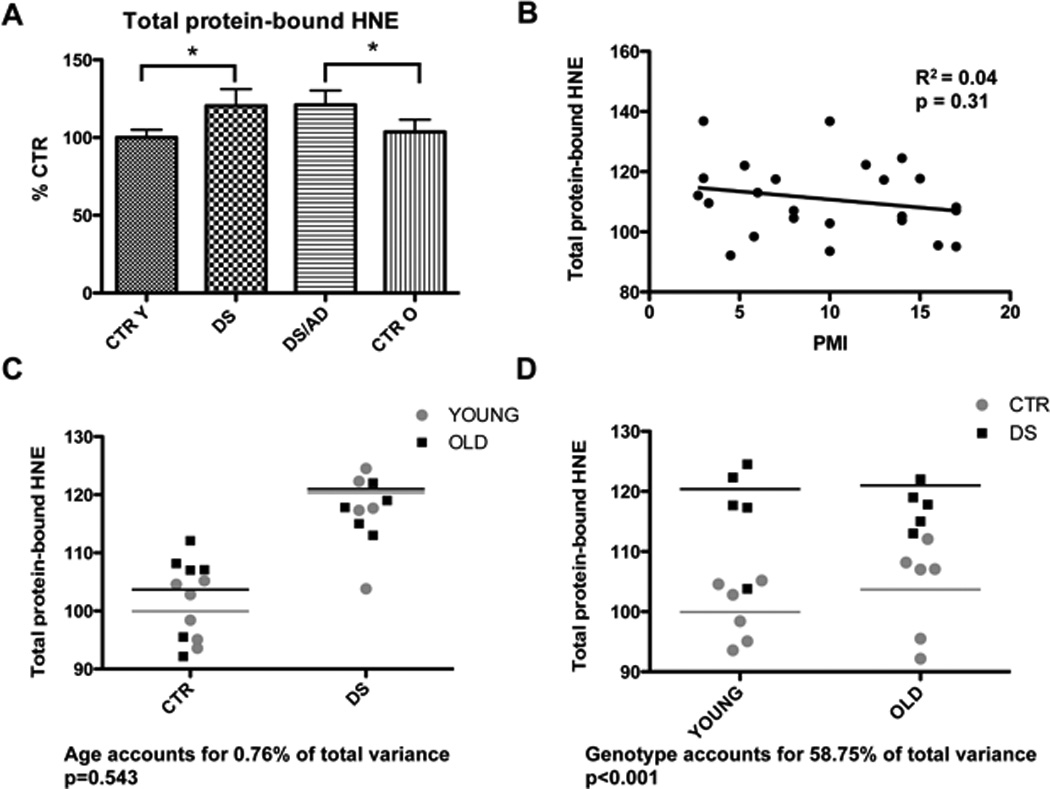
In panel A are shown the total protein-bound HNE levels of CTRY, DS, DS/AD and CTRO brain samples analyzed by slot blot assay. Error bars indicate SD for 6 samples per group. Densitometric values shown are given as percentage in respect to CTRY set as 100%. (* p<0.05). In panel B the linear regression analysis of total protein-bound HNE levels and PMI is shown. The graph demonstrate no relationship between protein oxidation and PMI (R2=0.04; p=0.31). Panel C and D show respectively the influence of age and genotype on protein-bound HNE experimental data.
Table 3.
2-way ANOVA analysis to investigate genotype and age effects on protein bound-HNE experimental data.
| TARGET | 2-way ANOVA | |||||
|---|---|---|---|---|---|---|
| Age (Young - Old) | Genotype (DS – DS/AD) | Interaction | ||||
| N # | PROTEIN | % of tot var. | p value | % of tot var. | p value | |
| 1 | Superoxide dismutase [Cu-Zn] | 2.41 | 0.42 | 16.49 | *0.047 | 0.156 |
| 2 | Peroxiredoxin-2 | 0.80 | 0.618 | 32.16 | *0.0038 | 0.143 |
| 3 | Myelin basic protein | 1.19 | 0.595 | 9.38 | 0.142 | 0.197 |
| 4 | Cytochrome b-c1 complex subunit Rieske, mitochondrial | 0.30 | 0.746 | 43.43 | *0.0008 | 0.569 |
| 5 | Ubiquitin carboxyl-terminal hydrolase isozyme L1 | 2.47 | 0.421 | 15.48 | 0.053 | 0.140 |
| 6 | Malate dehydrogenase, cytoplasmic | 6.71 | 0.216 | 2.75 | 0.421 | 0.207 |
| 7 | Glyceraldehyde-3-phosphate dehydrogenase | 0.27 | 0.791 | 22.96 | *0.023 | 0.768 |
| 8 | Fructose-bisphosphate aldolase A | 6.05 | 0.205 | 2.76 | 0.387 | *0.025 |
| 9 | Fructose-bisphosphate aldolase C | 2.71 | 0.373 | 10.29 | 0.091 | *0.018 |
| 10 | Alpha-enolase | 0.1 | 0.869 | 25.25 | *0.015 | 0.356 |
| 11 | Septin-11 | 1.57 | 0.550 | 3.55 | 0.372 | 0.143 |
| 12 | Glial fibrillary acidic protein | 6.65 | *0.048 | 79.42 | *0.0001 | 0.30 |
| 13 | Alpha-internexin | 0.88 | 0.654 | 5.57 | 0.266 | 0.181 |
| 14 | T-complex protein 1 subunit beta | 2.80 | 0.435 | 10.07 | 0.147 | 0.706 |
| 15 | Syntaxin-binding protein 1 | 14.44 | *0.038 | 11.09 | 0.066 | *0.033 |
| 16 | Glutamate dehydrogenase 1, mitochondrial | 32.90 | *0.0018 | 12.72 | *0.036 | 0.244 |
| 17 | Pyruvate kinase isozymes M1/M2 | 0.51 | 0.729 | 16.16 | 0.062 | 0.839 |
| 18 | Aconitate hydratase, mitochondrial | 29.35 | *0.0068 | 2.97 | 0.349 | 0.335 |
| 19 | Dihydropyrimidinase-related protein 1 | 3.30 | 0.35 | 12.98 | 0.076 | 0.124 |
| 20 | Dihydropyrimidinase-related protein 2 | 25.22 | *0.002 | 29.66 | *0.0001 | *0.001 |
| 21 | Heat shock cognate 71 kDa protein | 2.16 | 0.493 | 6.53 | 0.239 | 0.458 |
| 22 | 78 kDa glucose-regulated protein | 13.22 | *0.042 | 24.29 | *0.0082 | 0.151 |
| 23 | Endoplasmin | 29.02 | *0.0037 | 13.03 | *0.039 | 0.22 |
| 24 | Neurofilament medium polypeptide | 1.66 | 0.515 | 19.50 | *0.034 | 0.374 |
RESULTS
Protein-bound 4-hydroxy-2-trans-nonenal
The modification of proteins by LPO-derived products may play a critical role in the pathophysiology of DS. We first determined in our group of samples the variation in the total levels of HNE-bound proteins by slot blot. Considering that DS/AD samples have shorter PMIs, we analyzed whether PMI was a significant contributor to HNE-levels and we found that no significant correlation exists between HNE and PMI (Figure 1B). Our results indicated that oxidative damage, indexed by protein-bound HNE levels, was higher in DS cases overall relative to controls while no significant difference was detected between DS/AD and DS (Figure 1A). A 2-way ANOVA shows that protein-bound HNE levels are influenced by genotype (58.75% of total variance, p=0.001) but not age (0.76% of total variance, p=0.543) (Fig. 1C and D).
Based on these findings, we further analyzed our groups by a redox proteomics approach used to identify specific proteins showing increased levels of HNE-modification. Brain homogenates were separated on two-dimensional (2D) gels, 4-HNE modified-proteins were detected by immunoblotting (Fig. 2 and 3). The overall intensities of protein spots that immunoreacted with 4-HNE antibodies appeared higher in both DS/AD and DS compared with their respective controls.
Figure 2.
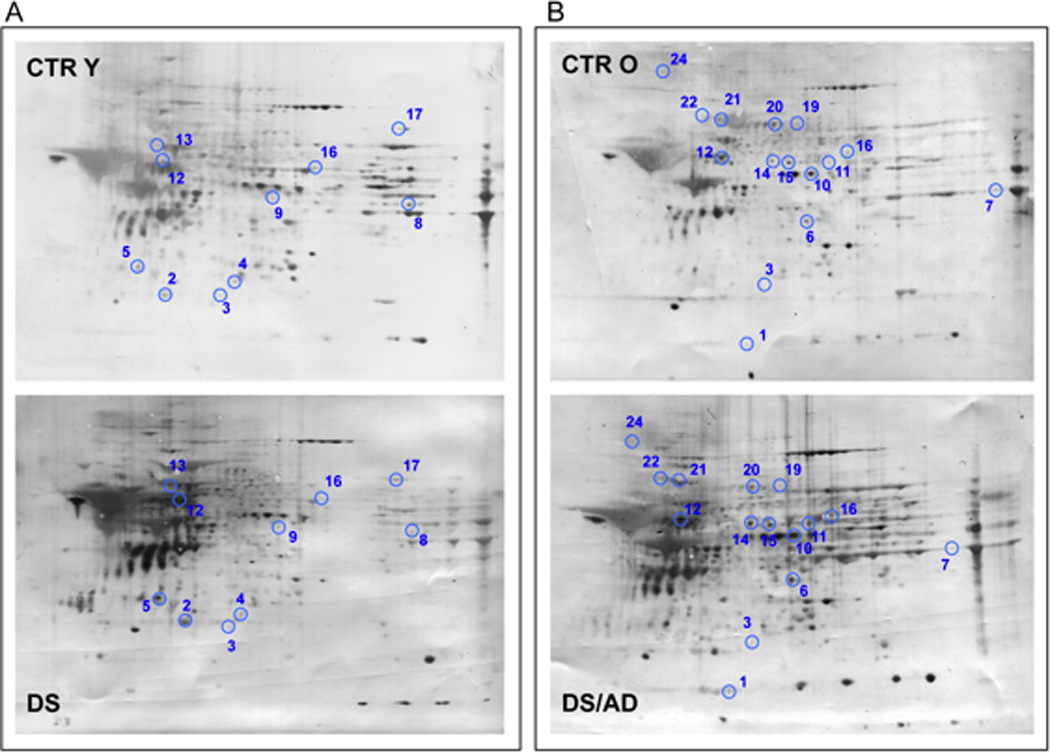
Proteomic profile of representative 2D-blot with proteins differentially oxidized in CTR cases vs. DS cases. In panel A is shown the comparison between CTRY and DS while in panel B is shown the comparison between CTRO and DS/AD. The spot numbers are reported in table 2.
The redox proteomics analyses identified a number of HNE-modified proteins (normalized to expression levels) in the frontal cortex of brain samples when comparing the 4 groups (Table 2). Further, a 2-way ANOVA was used to understand the effect of age and genotype for each protein of interest (table 3). By comparing the four groups of samples (CTRY, DS, DS/AD and CTRO) the following results were obtained:
Table 2.
Protein HNE-modified in CTRY vs. DS, DS vs. DS/AD, DS/AD vs. CTRO and CTRO vs. CTRY identified by redox proteomics analysis.
| Spot | Protein | Uniprot Number |
% Sequence Coverage |
Theoretical MW/PI |
DS/AD vs. CTRO |
DS/AD vs. DS |
DS vs. CTRY |
CTRO vs. CTRY |
|---|---|---|---|---|---|---|---|---|
| 1 | Superoxide dismutase [Cu-Zn] | Q6NR85 | 77 | 16154/5.70 | 3.9* | 1.2 | ||
| 2 | Peroxiredoxin-2 | P32119 | 44 | 22049/5.66 | 2.0 | 12.3* | ||
| 3 | Myelin basic protein | Q6F104 | 33 | 33097/9.79 | 1.9 | 5.9* | 11.5* | |
| 4 | Cytochrome b-c1 complex subunit Rieske, mitochondrial | P47985 | 21 | 29934/8.55 | 2.9* | 11.3* | ||
| 5 | Ubiquitin carboxyl-terminal hydrolase isozyme L1 | P09936 | 46 | 25151/5.33 | 1.27 | 36* | ||
| 7 | Malate dehydrogenase, cytoplasmic | 36631 | 25 | 366631/6.91 | 2.4* | |||
| 9 | Glyceraldehyde-3-phosphate dehydrogenase | P04406 | 42 | 36201/8.57 | 15.2* | 2.9 | ||
| 10 | Fructose-bisphosphate aldolase A | P04075 | 41 | 39851/8.30 | 2.2 | 3.3* | ||
| 11 | Fructose-bisphosphate aldolase C | P09972 | 51 | 39830/6.41 | 5.2* | |||
| 13 | Alpha-enolase | Q6GMP2 | 42 | 47481/7.01 | 7.2* | 2.4 | ||
| 15 | Glial fibrillary acidic protein DnaJ homolog subfamily B member 12 |
Q96KS4 Q9NXW2 |
57 23 |
49907/5.42 42021/8.67 |
3.3* | 3.7* | ||
| 16 | Alpha-internexin | Q16352 | 69 | 55528/5.34 | 1.24 | 3.2* | ||
| 17 | Dihydropyrimidinase-related protein 2 | Q16555 | 31 | 62771/5.95 | 20.3* | 1.3 | 2.5* | |
| 18 | T-complex protein 1 subunit beta | P78371 | 25 | 57794/6.01 | 13.6* | 2.5 | ||
| 19 | Syntaxin-binding protein 1 | P61764 | 29 | 67925/6.49 | 3.8* | 4.8* | ||
| 20 | Glutamate dehydrogenase 1, mitochondrial | P00367 | 37 | 61701/7.66 | 2.4* | 3.6* | 1.4* | |
| 21 | Pyruvate kinase isozymes M1/M2 | Q96E76 | 32 | 58470/7.96 | 1.25 | 2.2* | ||
| 22 | Aconitate hydratase, mitochondrial | Q99798 | 20 | 86113/7.36 | 11.8* | |||
| 25 | Dihydropyrimidinase-related protein 1 | Q14194 | 15 | 62487/6.55 | 9.72* | 4.2* | ||
| 26 | Dihydropyrimidinase-related protein 2 | Q16555 | 47 | 62771/5.95 | 3.7* | 3.4* | 1.2 | |
| 27 | Heat shock cognate 71 kDa protein | P11142 | 38 | 71082/5.37 | 4.3* | 1.3 | ||
| 28 | 78 kDa glucose-regulated protein | P11021 | 35 | 72402/5.07 | 35.4* | 8.3* | 4.1 | |
| 29 | Endoplasmin | P14625 | 30 | 92696/4.76 | 9.5* | |||
| 30 | Neurofilament medium polypeptide | P07197 | 35 | 102468/4.90 | 19.1* | 3.2 |
The numbers in bold indicate that the values are statistically significant * p<0.05;
The values in italic indicate a consistent but not significant trend of alteration.
DS vs. CTRY
In this group of comparison proteins found to have elevated HNE-modification in DS compared to CTRY and identified by MS/MS analysis were: cytochrome b-c1 complex Rieske subunit mitochondrial (CYT b-c1) with 11.3-fold increase, glial fibrillary acidic protein (GFAP) with 3.7-fold increase, glutamate dehydrogenase 1 mitochondrial (GDH-1) with 1.4-fold increase, peroxiredoxin-2 (Prx2) with 12.3-fold increase, myelin basic protein (MBP) with 11.5-fold increase, ubiquitin carboxyl-terminal hydrolase isozyme L1 (UCH-L1) with 36-fold increase, fructose-bisphosphate aldolase A (FBA-A) with 3.3-fold increase, fructose-bisphosphate aldolase C (FBA-C) with 5.2-fold increase, α-internexin with 3.2-fold increase, pyruvate kinase (PK) isozymes M1/M2 with 2.2-fold increase. As expected, the increased oxidation of the majority of the proteins belonging to this group of comparisons is more highly influenced by genotype (presence of DS) rather than age group (e.g. GFAP, CYT b-c1) (Fig. 2 and Table 3) since our old CTR group are around 60 year-old.
DS/AD vs. DS
In this group of comparison proteins showing increased levels of HNE-modifications and identified by MS/MS analysis were: dihydropyrimidinase-related protein 2 (DRP-2 also called CRMP-2) with 3.4-fold increase, syntaxin-binding protein 1 (SBP1) with 4.8-fold increase, dihydropyrimidinase-related protein 1 (DRP-1 also called CRMP-1) with 4.2-fold increase, 78 kDa glucose-regulated protein (GRP78) with 8.3-fold increase, GDH-1 with 3.6-fold increase, MBP with 5.9-fold increase, aconitate hydratase mitochondrial with 11.8-fold increase, endoplasmin with 9.5-fold increase. Considering the age difference between DS/AD and DS individuals it is reasonable to expect a contribution of age to the increased oxidative damage observed. Indeed, a 2-way ANOVA analysis shows that most of the protein identified as oxidatively modified in this group of comparisons are significantly influenced by age (Fig. 3 and Table 3).
Figure 3.
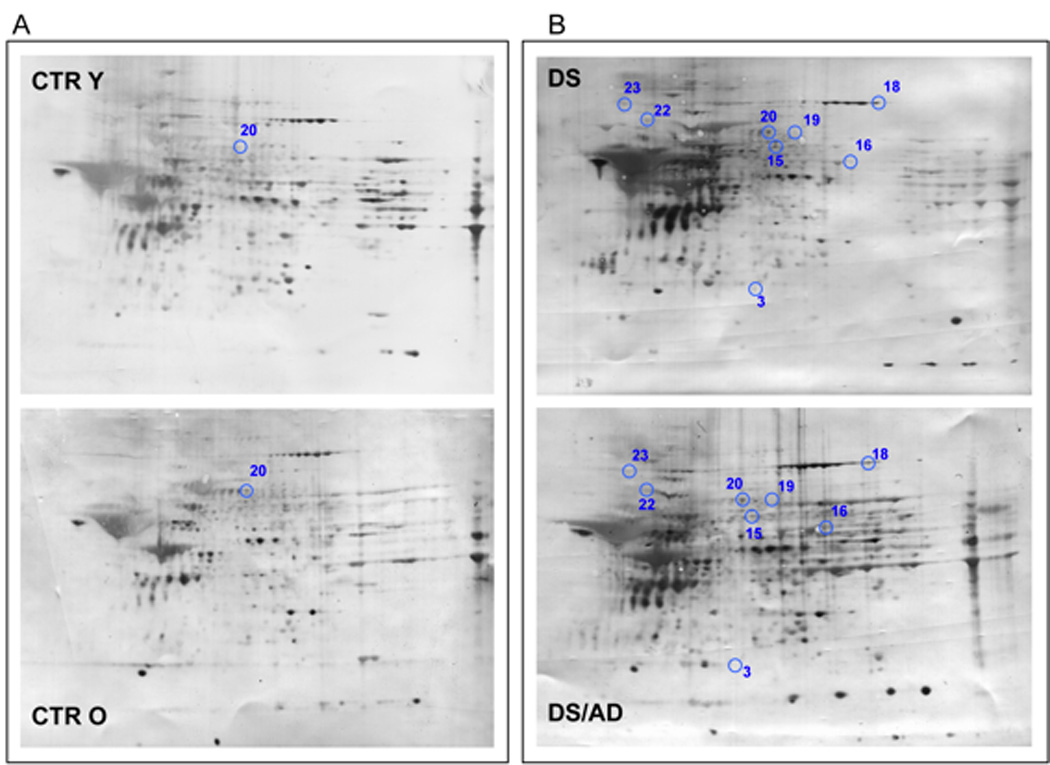
Proteomic profile of representative 2D-blot with proteins differentially oxidized in young cases vs. old cases. In panel A is shown the comparison between CTRY and CTRO while in panel B is shown the comparison between DS and DS/AD. The spot numbers are reported in table 2.
DS/AD vs. CTRO
In this group proteins differently HNE-modified identified by MS/MS analysis were: superoxide dismutase [Cu-Zn] (SOD-1) with 3.9-fold increase, CYT b-c1 with 2.9-fold increase, malate dehydrogenase, cytoplasmic (MDH) with 2.4-fold increase, alpha-enolase with 7.2-fold increase, septin-11 with 10-fold increase, glyceraldehyde-3-phosphate dehydrogenase (GAPDH) with 15.2-fold increase, DRP-2, with 3.7-fold increase, T-complex protein 1 subunit beta with 13.6-fold increase, SBP1 with 3.8-fold increase, DRP-1 with 9.72-fold increase, heat shock cognate 71 kDa protein (HSC71) with 4.3-fold increase, GRP78 with 35.4-fold increase, neurofilament medium polypeptide (NMP) with 19.1-fold increase, GFAP with 3.3-fold increase, GDH-1 with 2.4-fold increase. In the analysis of the influence of age and genotype, we can identify two major subgroups composed of proteins that are oxidatively modified in DS/AD vs. CTR O comparison only or in both DS/AD vs. CTR O and DS/AD vs. DS comparisons. The proteins identified in the first subgroup being differently oxidized in individuals comparable for age do not show any age-dependency and a 2-way ANOVA show that these are mainly influenced by genotype. In contrast, the proteins identified in the second subgroup show the contribution of both genotype and age to the observed increased HNE-modification, as reported by a 2-way ANOVA analysis (Fig. 3 and Table 3).
CTRO vs. CTRY
The comparison of CTR Y vs. CTR O was taken in consideration to account for any age effects in the absence of DS. However, only one protein, DRP2, showed a 2.5-fold increase in aged individuals. Interestingly, DRP-2 was found to be increasingly oxidized across the controls and DS groups and across the comparison of elderly groups (DS/AD and CTRO) thus showing both age and genotype dependence. Indeed, age accounts for 25.2% of the variance (p=0.002) and genotype accounts for 29.7% of the variance (p=0.001). (Fig. 2 and Table 3).
Immunoprecipitation of GRP78
Data from the validation analysis on GRP78 confirm the increased levels of HNE-bound protein in DSAD compared to CTRO (2.15- fold), while no significant difference was found between DS and CTRY (Fig. 4).
Figure 4.
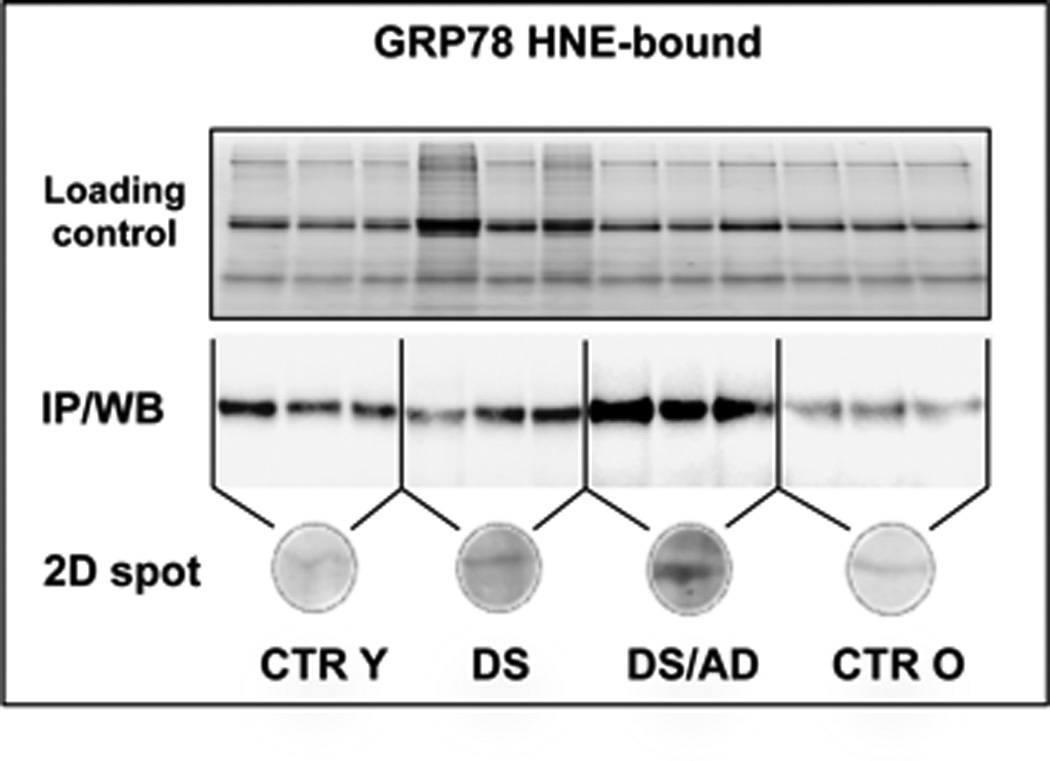
Protein-bound HNE levels of GRP-78 analyzed by immunoprecipitation and western blot (above) and by 2-DE western blot (below).
SOD-1 levels and aggregates
The analysis of SOD1 expression levels show an increase in DS (1.5-fold) and DSAD (1.7-fold) compared to age-matched controls (Fig. 5A). Since SOD1 is encoded on Chr21, our data are consistent with previous results on DS brain [27, 28] and DS animal models [29].
Figure 5.
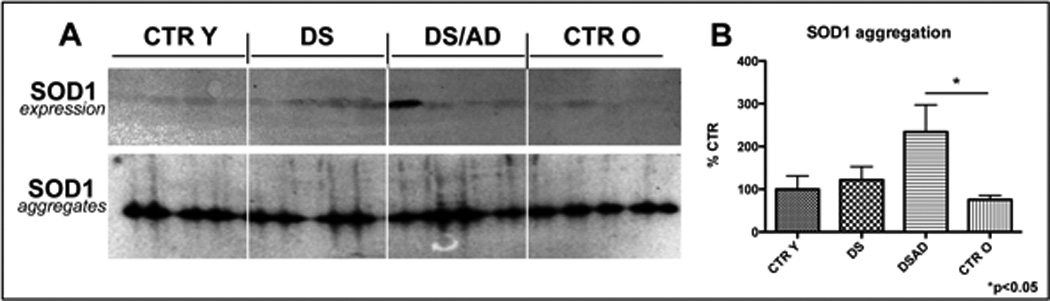
In panel A SOD1 expression levels analyzed by Western blot (above) and SOD1 aggregates analyzed by native gel electrophoresis (below) are showed. In panel B is showed the bar graph of SOD1 aggregated in each experimental group. Error bars indicate SD for 6 samples per group. Densitometric values shown are given as percentage in respect to CTRY set as 100% (* p<0.05).
In order to test the hypothesis that SOD1 overexpression and oxidative modification may bring about the formation of protein aggregates, we performed native gel electrophoresis. As shown in Fig. 5A and B, SOD1 immunoreactivity in non-reducing conditions corresponds to a band around 90 kDa, thus indicating the formation of protein aggregates. This phenomenon is consistently increased (about 2.3-fold) in DS/AD vs. CTRO and correlates with SOD1 oxidation data.
DISCUSSION
The analysis of DS subjects with and without AD pathology, compared with their age-matched controls, offers a unique opportunity to discriminate brain dysfunctions, associated with oxidative damage, before and after neuropathological manifestations of AD. Results from our group and from others demonstrated that OS is an early event in DS phenotype as indexed by increased OS markers in transgenic animal model of the disease [34], in the amniotic fluid from women carrying DS pregnancy [35], in fetal brain of DS [36] and also from young and adult DS subjects [15, 16]. Thus, we analyzed HNE-modified proteins in order to identify specific targets of lipid peroxidation, occurring in the frontal cortex as a function of Chr21 trisomy, age and AD pathology. Since protein oxidation alters protein function [37, 38, 40], our results suggest molecular mechanisms that are progressively impaired in DS and may drive neurodegenerative phenomena. We compared DS vs. CTRY, to characterize the oxidative damage during the pre-AD neuropathology phase in DS phenotype, DS/AD vs. DS, to understand oxidized proteins potentially involved in AD progression, DS/AD vs. CTRO, to verify the presence of characteristic oxidative features of AD in DS cases, and finally CTRO vs. CTRY to consider changes that are exclusively age-dependent.
The majority of neurodegenerative disorders are characterized by defects in the cytoskeletal architecture that regulate neuronal shape and trafficking [22]. We identified increased levels of protein-bound HNE of MBP, α-internexin and GFAP in DS compared to CTR Y individuals. This is the first report showing the oxidation of MBP, the major structural protein component of myelin that plays a functional role in the formation and maintenance of the myelin sheath. Recently, it was demonstrated that MBP binds Aβ and inhibits Aβ fibril formation breakdown in white matter [44–46], which may have relevance to DS. Another member of the cytoskeleton network is α-internexin, a 66-kDa neurofilament protein, involved in the morphogenesis of neurons. Our data may suggest that the increased oxidation of α-internexin, whose expression is already altered in the fetal brain, contributes to the slow and chronic degenerative process of neuronal cells in DS brain. Moreover, α-internexin was found HNE-bound in studies on Ts1Cje transgenic mouse for DS [47].
We here demonstrate that UCH-L1, in addition to being increasingly carbonylated [34], is also HNE-modified. UCH-L1 oxidative modification leads to protein decreased functionality [16] and to the dysfunction of protein ubiquitination/de-ubiquitination machinery, which in turn impair neuronal function and survival, as already demonstrated in AD brain [16]., Growing evidences indicate that the dysfunction of the protein quality control (PQC) system is a key event in triggering neuronal death by favouring the accumulation of oxidized/misfolded proteins. The PQC through degradation of oxidized/misfolded proteins provides a critical protective role. If this process is defective damaged/dysfunctional proteins are not efficiently removed and may accumulate. Indeed, deposits of aggregated, misfolded, and oxidized proteins are key hallmarks of neurodegeneration. Intriguingly, our findings suggest that, in DS brain, the impairment of PQC may be caused by the increased oxidation of selected components of the proteasome, autophagy and UPS..
Similarly, GFAP was found to be modified either by increased carbonylation or HNE-modification, thus suggesting that this protein is a selective target of oxidative damage. Interestingly, GFAP oxidation result to be influenced by genotype (Table 3) thus suggesting that the its oxidative modifications is associated with trisomy of Chr21.
Intellectual disability in DS has often been associated with increased neuronal sensitivity to physiological oxidative radicals and increased susceptibility to undergo apoptotic death [52]. We found that Prx2 is oxidized in DS brain, which further supports the relationship between a decrease in the antioxidant defense mechanisms and neurodegeneration. Interestingly, previous studies demonstrated that Prx2 was under-expressed in DS fetal brains with respect to controls [53, 54]. Furthermore, Hishihara et al. found that another member of this family, Prx6 is HNE modified in Ts1Cje transgenic mice [55]. In addition, hyperoxidation of Prx2 is found also in DSAD vs CTRold. Considering that DS brain is under a condition of chronic oxidative stress, resulting from genetic deregulation of Chr21, alteration of oxidative defense systems exacerbates the intracellular oxidative burden, thereby favoring the accumulation of oxidized/dysfunctional proteins.
Additional targets of HNE-modifications, in DS vs CTRY, are enzymes involved in energy metabolism, including PK M1/M2, FBA and CYT b-c1 (complex III subunit 5). Previous findings demonstrate deficient functionality of mitochondrial enzymes [34] and a metabolic deficiency where an adaptive down regulation of mitochondria functions occurs [56].
In order to understand if such deregulation translates into a chronic decrease of the above-mentioned proteins and their associated functions the comparison of DS/AD and CTRO was undertaken to account for any specific AD differences. Within this context, CYT b-c1 and GFAP were oxidized also in DS/AD suggesting that the modification of these proteins starts early in DS population and is still present in DS with AD pathology.
Conversely, SOD1, MDH, GAPDH, septin-11, α-enolase, Hsc71 and NMP showed higher levels of oxidation in DS/AD vs. CTRO only. Triplication of SOD1 is considered the main factor responsible of increased OS conditions in DS. A recent study by Murakami et al. [62] showed that the SOD1 deficiency in an APP-overexpressing mouse model (Tg2576) accelerates Aβ oligomerization and memory impairment as a consequence of increased oxidative damage. However, the Ts1Cje mice, with a subset of triplicated human Chr21 gene orthologs that exclude APP and SOD, show decreases of mitochondrial membrane potential and ATP production, increase of ROS, hyperphosphorylation of tau, increase of GSK3beta activity and unaltered APP metabolism. These findings suggest that genes on the trisomic Ts1Cje segment other than APP and SOD1 can cause oxidative stress, mitochondrial dysfunction and hyperphosphorylation of tau.
Previous studies from our laboratory [60] demonstrated for the first time that SOD1 is HNE-modified in the inferior parietal lobule of late stage AD. Protein oxidation often results in the formation of protease-resistant protein aggregates, which are considered highly toxic and can mediate cell death [63]. Considering that SOD1 is overexpressed in DS and also oxidatively modified, we tested the hypothesis that SOD1 aggregates might form and may contribute to neurotoxicity, as well as Aβ fibrils. Moreover, this phenomenon has already been described in an animal model of ALS [64–67], where mutant SOD1 is overexpressed, oxidatively modified and aggregate in motor neurons [68]. Intriguingly, our results support the idea that SOD1, similar to what occurs in ALS [69] and also in PD and AD brain [70, 71] may bring about the formation of protein aggregates (Fig. 5).
MDH, GAPDH and α-enolase oxidative modifications are consistent with the chronic dysfunction of energy metabolism that starts early in the young DS population and progress with aging to DS/AD. Indeed, these proteins have been already identified as oxidatively modified in brain of subjects with AD and MCI [64].
GRP78, DRP-1 and DRP-2, SBP and GDH-1 were identified as excessively HNE-modified in brain in DS/AD vs. CTRO and also DS/AD vs. DS, thereby opening an interesting discussion to consider the specific variation caused by aging and those mainly related to genotype. The comparison between DS/AD and DS group showed that the majority of the proteins are increasingly oxidized as a function of aging. However, the effect of age is evident only in the DS population, with subtle increase in CTRO vs. CTRY group (Table 3).. These proteins include components of metabolic pathways, antioxidant defense and axonal guidance that were already discussed elsewhere in the context of AD onset and progression [15]. Further, GRP78, in addition to other mentioned proteins, is a selective target of oxidative damage, since we also identified these proteins to be carbonylated in DS vs. CTRY [16]. These data, together with the oxidation of GFAP and UCH-L1, suggest that the impairment of the proteostasis network is an early and characteristic feature of DS neurodegeneration.
If we combine the deregulation of the cytoskeleton network (SBP, NMP, DRP-1 and DRP-2) with energy failure, it is reasonable to hypothesize a stress condition where mechanisms of neuronal growth, axonal transport and also neurotransmitter signaling is impaired.
Endoplasmin and aconitate hydratase are increasingly HNE-modified only in the DS/AD group when compared with DS alone and 2-way ANOVA analysis supports the notion that age is the major contributor to their oxidative-dependent impairment. Moreover, the effect of normal aging, as indicated by comparing CTRO and CTRY, should be considered to set the boundary line between normal and pathological aging. Intriguingly, the only protein found to be significantly more oxidized in CTRO and CTRY is DRP2, the same protein discussed already to be modulated by an aging effect in DS/AD vs. DS comparison that overall result to be influenced by age effect as reported by 2-way ANOVA analysis. However, although our results strongly support the age-dependent susceptibility of DRP-2 to undergo HNE-modification, it is not possible to discriminate between the age- and genotype-dependent effects.
CONCLUSIONS
In conclusion, our study demonstrates that accumulation of oxidatively-damaged proteins in the frontal cortex occurs in younger individuals with DS and is higher than similarly aged non-DS control cases. Accumulation of oxidative damage within neurons likely is responsible for damaging crucial proteins that regulate several processes including, neuronal integrity, axonal transport, synapse connections, degradative systems, energy production and antioxidant defense. These oxidative stress-related alterations, as demonstrated by us and by a number of other studies, are intrinsically, but not exclusively, dependent of triplication of Chr21 genes. We suggest that additional events associated with energy failure and mitochondrial deficits, increase as a function of age in DS driving the neurodegenerative process, which culminate in AD pathology. We speculate that these findings are not only consistent with previous studies in AD, but also may be potential markers of disease progression. However, further molecular studies are needed to further demonstrate the specific role of selected proteins in neurodegeneration.
The comprehension of early events that contribute to and/or regulate the expression of Chr21 gene products is a priority to better understand the mechanisms promoting the development of AD in the DS population, as well as in the general population. Therapeutic strategies based on early pharmacological interventions that modify oxidative stress may be a promising approach to slowing or preventing AD in DS.
Table 4.
Summary table showing proteins identified in one or more groups of comparison
| DS PHENOTYPE PROTEINS (DS Y vs. CTR Y) |
AD PROGRESSION PROTEINS (DS/AD vs. DS Y) |
SPECIFIC AD PROTEINS (DS/AD vs. CTR O) |
|---|---|---|
| Glutamate dehydrogenase 1, mitochondrial | ||
| Alpha-internexin | Syntaxin-binding protein 1 | |
| Ubiquitin carboxyl-terminal hydrolase isozyme L1 | Dihydropyrimidinase-related protein 2 | |
| Fructose-bisphosphate aldolase A | Dihydropyrimidinase-related protein 1 | |
| Fructose-bisphosphate aldolase C | 78 kDa glucose-regulated protein | |
| Myelin basic protein | Superoxide dismutase [Cu-Zn] | |
| Glial fibrillary acidic protein DnaJ homolog subfamily B member 12 | Endoplasmin | Glial fibrillary acidic protein DnaJ homolog subfamily B member 12 |
| Cytochrome b-c1 complex subunit Rieske, mitochondrial | Aconitate hydratase, mitochondrial | Cytochrome b-c1 complex subunit Rieske, mitochondrial |
| Peroxiredoxin-2 | T-complex protein 1 subunit beta | |
| Pyruvate kinase isozymes M1/M2 | ||
| Heat shock cognate 71 kDa protein | ||
| Neurofilament medium polypeptide | ||
| Glyceraldehyde-3-phosphate dehydrogenase | ||
| Alpha-enolase | ||
| Malate dehydrogenase, cytoplasmic | ||
| Septin 11 | ||
HIGHLIGHTS.
Lipid peroxidation occurs early in Down Syndrome brain
Lipid peroxidation contribute to development of AD in DS
Redox proteomics approach allowed the identification of HNE-modified proteins
HNE-modified proteins are involved in quality control, cytoskeleton network and energy metabolism
A number of oxidized proteins in DS/AD are in common with AD
ACKNOWLEDGMENT
This work was partially supported by PRIN2009 to C.C. and a NIH grant to D.A.B. [A6-05119]. Brain tissue was acquired by EH under funding from the Eunice Kennedy Shriver National Institute of Child Health and Human Development, National Institute on Aging Grant #NIH 1RO1HD064993-01. Additional autopsy tissue was obtained from the UCI-ADRC (P50AG16573), from the UK ADC (P30AG28383) and from the NICHD Brain and Tissue Bank for Developmental Disorders of the University of Maryland, Baltimore, MD, contract HHSN275200900011C (N01HD90011). The content is solely the responsibility of the authors and does not necessarily represent the official views of the National Institutes of Health.
Footnotes
All authors state that they have no conflicts of interest.
REFERENCES
- 1.Perluigi M, Butterfield DA. Oxidative Stress and Down Syndrome: A Route toward Alzheimer-Like Dementia. Curr Gerontol Geriatr Res. 2012;2012:724904. doi: 10.1155/2012/724904. [DOI] [PMC free article] [PubMed] [Google Scholar]
- 2.Lejeune J, Gautier M, Turpin R. Study of somatic chromosomes from 9 mongoloid children. Comptes rendus hebdomadaires des seances de l'Academie des sciences. 1959;248:1721–1722. [PubMed] [Google Scholar]
- 3.Hassold T, Hunt P. To err (meiotically) is human: the genesis of human aneuploidy. Nat Rev Genet. 2001;2:280–291. doi: 10.1038/35066065. [DOI] [PubMed] [Google Scholar]
- 4.Dierssen M, Herault Y, Estivill X. Aneuploidy: from a physiological mechanism of variance to Down syndrome. Physiol Rev. 2009;89:887–920. doi: 10.1152/physrev.00032.2007. [DOI] [PubMed] [Google Scholar]
- 5.Wiseman FK, Alford KA, Tybulewicz VL, Fisher EM. Down syndrome--recent progress and future prospects. Hum Mol Genet. 2009;18:R75–R83. doi: 10.1093/hmg/ddp010. [DOI] [PMC free article] [PubMed] [Google Scholar]
- 6.Lott IT. Neurological phenotypes for Down syndrome across the life span. Progress in brain research. 2012;197:101–121. doi: 10.1016/B978-0-444-54299-1.00006-6. [DOI] [PMC free article] [PubMed] [Google Scholar]
- 7.Mann DM, Yates PO, Marcyniuk B, Ravindra CR. The topography of plaques and tangles in Down's syndrome patients of different ages. Neuropathol Appl Neurobiol. 1986;12:447–457. doi: 10.1111/j.1365-2990.1986.tb00053.x. [DOI] [PubMed] [Google Scholar]
- 8.Wisniewski KE, Dalton AJ, McLachlan C, Wen GY, Wisniewski HM. Alzheimer's disease in Down's syndrome: clinicopathologic studies. Neurology. 1985;35:957–961. doi: 10.1212/wnl.35.7.957. [DOI] [PubMed] [Google Scholar]
- 9.Leverenz JB, Raskind MA. Early amyloid deposition in the medial temporal lobe of young Down syndrome patients: a regional quantitative analysis. Exp Neurol. 1998;150:296–304. doi: 10.1006/exnr.1997.6777. [DOI] [PubMed] [Google Scholar]
- 10.Lemere CA, Blusztajn JK, Yamaguchi H, Wisniewski T, Saido TC, Selkoe DJ. Sequence of deposition of heterogeneous amyloid beta-peptides and APO E in Down syndrome: implications for initial events in amyloid plaque formation. Neurobiology of disease. 1996;3:16–32. doi: 10.1006/nbdi.1996.0003. [DOI] [PubMed] [Google Scholar]
- 11.Schupf N, Sergievsky GH. Genetic and host factors for dementia in Down's syndrome. Br J Psychiatry. 2002;180:405–410. doi: 10.1192/bjp.180.5.405. [DOI] [PubMed] [Google Scholar]
- 12.Lott IT, Head E, Doran E, Busciglio J. Beta-amyloid, oxidative stress and down syndrome. Curr Alzheimer Res. 2006;3:521–528. doi: 10.2174/156720506779025305. [DOI] [PubMed] [Google Scholar]
- 13.Zana M, Janka Z, Kalman J. Oxidative stress: a bridge between Down's syndrome and Alzheimer's disease. Neurobiol Aging. 2007;28:648–676. doi: 10.1016/j.neurobiolaging.2006.03.008. [DOI] [PubMed] [Google Scholar]
- 14.Coskun PE, Busciglio J. Oxidative Stress and Mitochondrial Dysfunction in Down's Syndrome: Relevance to Aging and Dementia. Curr Gerontol Geriatr Res. 2012;2012:38–3170. doi: 10.1155/2012/383170. [DOI] [PMC free article] [PubMed] [Google Scholar]
- 15.Cenini G, Dowling AL, Beckett TL, Barone E, Mancuso C, Murphy MP, Levine H, 3rd, Lott IT, Schmitt FA, Butterfield DA, Head E. Association between frontal cortex oxidative damage and beta-amyloid as a function of age in Down syndrome. Biochim Biophys Acta. 2012;1822:130–138. doi: 10.1016/j.bbadis.2011.10.001. [DOI] [PMC free article] [PubMed] [Google Scholar]
- 16.Di Domenico F, Coccia R, Cocciolo A, Murphy MP, Cenini G, Head E, Butterfield DA, Giorgi A, Schinina ME, Mancuso C, Cini C, Perluigi M. Impairment of proteostasis network in Down syndrome prior to the development of Alzheimer's disease neuropathology: redox proteomics analysis of human brain. Biochim Biophys Acta. 2013;1832:1249–1259. doi: 10.1016/j.bbadis.2013.04.013. [DOI] [PMC free article] [PubMed] [Google Scholar]
- 17.Butterfield DA, Boyd-Kimball D. Amyloid beta-peptide(1–42) contributes to the oxidative stress and neurodegeneration found in Alzheimer disease brain. Brain Pathol. 2004;14:426–432. doi: 10.1111/j.1750-3639.2004.tb00087.x. [DOI] [PMC free article] [PubMed] [Google Scholar]
- 18.Butterfield DA, Drake J, Pocernich C, Castegna A. Evidence of oxidative damage in Alzheimer's disease brain: central role for amyloid beta-peptide. Trends Mol Med. 2001;7:548–554. doi: 10.1016/s1471-4914(01)02173-6. [DOI] [PubMed] [Google Scholar]
- 19.de Haan JB, Cristiano F, Iannello RC, Kola I. Cu/Zn-superoxide dismutase and glutathione peroxidase during aging. Biochemistry and molecular biology international. 1995;35:1281–1297. [PubMed] [Google Scholar]
- 20.Percy ME, Dalton AJ, Markovic VD, McLachlan DR, Hummel JT, Rusk AC, Andrews DF. Red cell superoxide dismutase, glutathione peroxidase and catalase in Down syndrome patients with and without manifestations of Alzheimer disease. American journal of medical genetics. 1990;35:459–467. doi: 10.1002/ajmg.1320350403. [DOI] [PubMed] [Google Scholar]
- 21.Brugge K, Nichols S, Saitoh T, Trauner D. Correlations of glutathione peroxidase activity with memory impairment in adults with Down syndrome. Biological psychiatry. 1999;46:1682–1689. doi: 10.1016/s0006-3223(99)00026-8. [DOI] [PubMed] [Google Scholar]
- 22.Butterfield DA, Stadtman ER. Protein Oxidation processes in aging brain. Adv Cell Aging Gerontol. 1997;2:161–191. [Google Scholar]
- 23.Landar A, Darley-Usmar VM. Nitric oxide and cell signaling: modulation of redox tone and protein modification. Amino acids. 2003;25:313–321. doi: 10.1007/s00726-003-0019-7. [DOI] [PubMed] [Google Scholar]
- 24.Reed TT. Lipid peroxidation and neurodegenerative disease. Free Radic Biol Med. 2011;51:1302–1319. doi: 10.1016/j.freeradbiomed.2011.06.027. [DOI] [PubMed] [Google Scholar]
- 25.Subramaniam R, Roediger F, Jordan B, Mattson MP, Keller JN, Waeg G, Butterfield DA. The lipid peroxidation product, 4-hydroxy-2-trans-nonenal, alters the conformation of cortical synaptosomal membrane proteins. J Neurochem. 1997;69:1161–1169. doi: 10.1046/j.1471-4159.1997.69031161.x. [DOI] [PubMed] [Google Scholar]
- 26.Pedersen WA, Fu W, Keller JN, Markesbery WR, Appel S, Smith RG, Kasarskis E, Mattson MP. Protein modification by the lipid peroxidation product 4-hydroxynonenal in the spinal cords of amyotrophic lateral sclerosis patients. Ann Neurol. 1998;44:819–824. doi: 10.1002/ana.410440518. [DOI] [PubMed] [Google Scholar]
- 27.Cheon MS, Fountoulakis M, Dierssen M, Ferreres JC, Lubec G. Expression profiles of proteins in fetal brain with Down syndrome. J Neural Transm Suppl. 2001:311–319. doi: 10.1007/978-3-7091-6262-0_26. [DOI] [PubMed] [Google Scholar]
- 28.Gulesserian T, Seidl R, Hardmeier R, Cairns N, Lubec G. Superoxide dismutase SOD1, encoded on chromosome 21, but not SOD2 is overexpressed in brains of patients with Down syndrome. J Investig Med. 2001;49:41–46. doi: 10.2310/6650.2001.34089. [DOI] [PubMed] [Google Scholar]
- 29.Amano K, Sago H, Uchikawa C, Suzuki T, Kotliarova SE, Nukina N, Epstein CJ, Yamakawa K. Dosage-dependent over-expression of genes in the trisomic region of Ts1Cje mouse model for Down syndrome. Hum Mol Genet. 2004;13:1333–1340. doi: 10.1093/hmg/ddh154. [DOI] [PubMed] [Google Scholar]
- 30.Perluigi M, Di Domenico F, Buttterfield DA. Unraveling the complexity of neurodegeneration in brain of subjects with down syndrome: insights from proteomics. Proteomics Clin Appl. 2013 doi: 10.1002/prca.201300066. [DOI] [PMC free article] [PubMed] [Google Scholar]
- 31.Gimeno A, Garcia-Gimenez JL, Audi L, Toran N, Andaluz P, Dasi F, Vina J, Pallardo FV. Decreased cell proliferation and higher oxidative stress in fibroblasts from Down Syndrome fetuses. Preliminary study. Biochim Biophys Acta. 2014;1842:116–125. doi: 10.1016/j.bbadis.2013.10.014. [DOI] [PubMed] [Google Scholar]
- 32.Pagano G, Castello G. Oxidative stress and mitochondrial dysfunction in Down syndrome. Adv Exp Med Biol. 2012;724:291–299. doi: 10.1007/978-1-4614-0653-2_22. [DOI] [PubMed] [Google Scholar]
- 33.Pallardo FV, Lloret A, Lebel M, d'Ischia M, Cogger VC, Le Couteur DG, Gadaleta MN, Castello G, Pagano G. Mitochondrial dysfunction in some oxidative stress-related genetic diseases: Ataxia-Telangiectasia, Down Syndrome, Fanconi Anaemia and Werner Syndrome. Biogerontology. 2010;11:401–419. doi: 10.1007/s10522-010-9269-4. [DOI] [PubMed] [Google Scholar]
- 34.Ishihara K, Amano K, Takaki E, Ebrahim AS, Shimohata A, Shibazaki N, Inoue I, Takaki M, Ueda Y, Sago H, Epstein CJ, Yamakawa K. Increased lipid peroxidation in Down's syndrome mouse models. J Neurochem. 2009;110:1965–1976. doi: 10.1111/j.1471-4159.2009.06294.x. [DOI] [PubMed] [Google Scholar]
- 35.Perluigi M, di Domenico F, Fiorini A, Cocciolo A, Giorgi A, Foppoli C, Butterfield DA, Giorlandino M, Giorlandino C, Schinina ME, Coccia R. Oxidative stress occurs early in Down syndrome pregnancy: A redox proteomics analysis of amniotic fluid. Proteomics Clin Appl. 2011;5:167–178. doi: 10.1002/prca.201000121. [DOI] [PubMed] [Google Scholar]
- 36.Odetti P, Angelini G, Dapino D, Zaccheo D, Garibaldi S, Dagna-Bricarelli F, Piombo G, Perry G, Smith M, Traverso N, Tabaton M. Early glycoxidation damage in brains from Down's syndrome. Biochem Biophys Res Commun. 1998;243:849–851. doi: 10.1006/bbrc.1998.8186. [DOI] [PubMed] [Google Scholar]
- 37.Williams TI, Lynn BC, Markesbery WR, Lovell MA. Increased levels of 4-hydroxynonenal and acrolein, neurotoxic markers of lipid peroxidation, in the brain in Mild Cognitive Impairment and early Alzheimer's disease. Neurobiol Aging. 2006;27:1094–1099. doi: 10.1016/j.neurobiolaging.2005.06.004. [DOI] [PubMed] [Google Scholar]
- 38.Reed T, Perluigi M, Sultana R, Pierce WM, Klein JB, Turner DM, Coccia R, Markesbery WR, Butterfield DA. Redox proteomic identification of 4-hydroxy-2-nonenal-modified brain proteins in amnestic mild cognitive impairment: insight into the role of lipid peroxidation in the progression and pathogenesis of Alzheimer's disease. Neurobiology of disease. 2008;30:107–120. doi: 10.1016/j.nbd.2007.12.007. [DOI] [PubMed] [Google Scholar]
- 39.Reed TT, Pierce WM, Markesbery WR, Butterfield DA. Proteomic identification of HNE-bound proteins in early Alzheimer disease: Insights into the role of lipid peroxidation in the progression of AD. Brain research. 2009;1274:66–76. doi: 10.1016/j.brainres.2009.04.009. [DOI] [PubMed] [Google Scholar]
- 40.Butterfield DA, Reed T, Perluigi M, De Marco C, Coccia R, Cini C, Sultana R. Elevated protein-bound levels of the lipid peroxidation product, 4-hydroxy-2-nonenal, in brain from persons with mild cognitive impairment. Neuroscience letters. 2006;397:170–173. doi: 10.1016/j.neulet.2005.12.017. [DOI] [PubMed] [Google Scholar]
- 41.Roy S, Zhang B, Lee VM, Trojanowski JQ. Axonal transport defects: a common theme in neurodegenerative diseases. Acta Neuropathol. 2005;109:5–13. doi: 10.1007/s00401-004-0952-x. [DOI] [PubMed] [Google Scholar]
- 42.Bamburg JR, Bloom GS. Cytoskeletal pathologies of Alzheimer disease. Cell Motil Cytoskeleton. 2009;66:635–649. doi: 10.1002/cm.20388. [DOI] [PMC free article] [PubMed] [Google Scholar]
- 43.Brion JP. The pathology of the neuronal cytoskeleton in Alzheimer's disease. Biochim Biophys Acta. 1992;1160:134–142. doi: 10.1016/0167-4838(92)90047-h. [DOI] [PubMed] [Google Scholar]
- 44.Epstein CJ. Epilogue: toward the twenty-first century with Down syndrome--a personal view of how far we have come and of how far we can reasonably expect to go. Prog Clin Biol Res. 1995;393:241–246. [PubMed] [Google Scholar]
- 45.Holtzman DM, Kilbridge J, Chen KS, Rabin J, Luche R, Carlson E, Epstein CJ, Mobley WC. Preliminary characterization of the central nervous system in partial trisomy 16 mice. Prog Clin Biol Res. 1995;393:227–240. [PubMed] [Google Scholar]
- 46.Capone GT. Down syndrome: advances in molecular biology and the neurosciences. J Dev Behav Pediatr. 2001;22:40–59. doi: 10.1097/00004703-200102000-00007. [DOI] [PubMed] [Google Scholar]
- 47.Sun Y, Dierssen M, Toran N, Pollak DD, Chen WQ, Lubec G. A gel-based proteomic method reveals several protein pathway abnormalities in fetal Down syndrome brain. J Proteomics. 2011;74:547–557. doi: 10.1016/j.jprot.2011.01.009. [DOI] [PubMed] [Google Scholar]
- 48.Riederer BM, Leuba G, Vernay A, Riederer IM. The role of the ubiquitin proteasome system in Alzheimer's disease. Exp Biol Med (Maywood) 2011;236:268–276. doi: 10.1258/ebm.2010.010327. [DOI] [PubMed] [Google Scholar]
- 49.de Vrij FM, Fischer DF, van Leeuwen FW, Hol EM. Protein quality control in Alzheimer's disease by the ubiquitin proteasome system. Prog Neurobiol. 2004;74:249–270. doi: 10.1016/j.pneurobio.2004.10.001. [DOI] [PubMed] [Google Scholar]
- 50.Dalle-Donne I, Rossi R, Giustarini D, Gagliano N, Lusini L, Milzani A, Di Simplicio P, Colombo R. Actin carbonylation: from a simple marker of protein oxidation to relevant signs of severe functional impairment. Free Radic Biol Med. 2001;31:1075–1083. doi: 10.1016/s0891-5849(01)00690-6. [DOI] [PubMed] [Google Scholar]
- 51.England K, O'Driscoll C, Cotter TG. Carbonylation of glycolytic proteins is a key response to drug-induced oxidative stress and apoptosis. Cell Death Differ. 2004;11:252–260. doi: 10.1038/sj.cdd.4401338. [DOI] [PubMed] [Google Scholar]
- 52.Becker L, Mito T, Takashima S, Onodera K. Growth and development of the brain in Down syndrome. Prog Clin Biol Res. 1991;373:133–152. [PubMed] [Google Scholar]
- 53.Helguera P, Pelsman A, Pigino G, Wolvetang E, Head E, Busciglio J. ets-2 promotes the activation of a mitochondrial death pathway in Down's syndrome neurons. J Neurosci. 2005;25:2295–2303. doi: 10.1523/JNEUROSCI.5107-04.2005. [DOI] [PMC free article] [PubMed] [Google Scholar]
- 54.Sawa A. Neuronal cell death in Down's syndrome. J Neural Transm Suppl. 1999;57:87–97. doi: 10.1007/978-3-7091-6380-1_6. [DOI] [PubMed] [Google Scholar]
- 55.Sanchez-Font MF, Sebastia J, Sanfeliu C, Cristofol R, Marfany G, Gonzalez-Duarte R. Peroxiredoxin 2 (PRDX2), an antioxidant enzyme, is under-expressed in Down syndrome fetal brains. Cell Mol Life Sci. 2003;60:1513–1523. doi: 10.1007/s00018-003-3048-1. [DOI] [PMC free article] [PubMed] [Google Scholar]
- 56.Prince J, Jia S, Bave U, Anneren G, Oreland L. Mitochondrial enzyme deficiencies in Down's syndrome. J Neural Transm Park Dis Dement Sect. 1994;8:171–181. doi: 10.1007/BF02260938. [DOI] [PubMed] [Google Scholar]
- 57.Helguera P, Seiglie J, Rodriguez J, Hanna M, Helguera G, Busciglio J. Adaptive downregulation of mitochondrial function in down syndrome. Cell Metab. 2013;17:132–140. doi: 10.1016/j.cmet.2012.12.005. [DOI] [PMC free article] [PubMed] [Google Scholar]
- 58.Richardson JS. Free radicals in the genesis of Alzheimer's disease. Ann N Y Acad Sci. 1993;695:73–76. doi: 10.1111/j.1749-6632.1993.tb23031.x. [DOI] [PubMed] [Google Scholar]
- 59.Marklund SL, Adolfsson R, Gottfries CG, Winblad B. Superoxide dismutase isoenzymes in normal brains and in brains from patients with dementia of Alzheimer type. J Neurol Sci. 1985;67:319–325. doi: 10.1016/0022-510x(85)90156-x. [DOI] [PubMed] [Google Scholar]
- 60.Murakami K, Murata N, Noda Y, Tahara S, Kaneko T, Kinoshita N, Hatsuta H, Murayama S, Barnham KJ, Irie K, Shirasawa T, Shimizu T. SOD1 (copper/zinc superoxide dismutase) deficiency drives amyloid beta protein oligomerization and memory loss in mouse model of Alzheimer disease. J Biol Chem. 2011;286:44557–44568. doi: 10.1074/jbc.M111.279208. [DOI] [PMC free article] [PubMed] [Google Scholar]
- 61.Dumont M, Wille E, Stack C, Calingasan NY, Beal MF, Lin MT. Reduction of oxidative stress, amyloid deposition, and memory deficit by manganese superoxide dismutase overexpression in a transgenic mouse model of Alzheimer's disease. FASEB J. 2009;23:2459–2466. doi: 10.1096/fj.09-132928. [DOI] [PMC free article] [PubMed] [Google Scholar]
- 62.Ansari MA, Scheff SW. Oxidative stress in the progression of Alzheimer disease in the frontal cortex. J Neuropathol Exp Neurol. 2010;69:155–167. doi: 10.1097/NEN.0b013e3181cb5af4. [DOI] [PMC free article] [PubMed] [Google Scholar]
- 63.Perluigi M, Sultana R, Cenini G, Di Domenico F, Memo M, Pierce WM, Coccia R, Butterfield DA. Redox proteomics identification of 4-hydroxynonenal-modified brain proteins in Alzheimer's disease: Role of lipid peroxidation in Alzheimer's disease pathogenesis. Proteomics Clin Appl. 2009;3:682–693. doi: 10.1002/prca.200800161. [DOI] [PMC free article] [PubMed] [Google Scholar]
- 64.Nystrom T. Role of oxidative carbonylation in protein quality control and senescence. EMBO J. 2005;24:1311–1317. doi: 10.1038/sj.emboj.7600599. [DOI] [PMC free article] [PubMed] [Google Scholar]
- 65.Chondrogianni N, Petropoulos I, Grimm S, Georgila K, Catalgol B, Friguet B, Grune T, Gonos ES. Protein damage, repair and proteolysis. Mol Aspects Med. 2012 doi: 10.1016/j.mam.2012.09.001. [DOI] [PubMed] [Google Scholar]
- 66.Grune T, Jung T, Merker K, Davies KJ. Decreased proteolysis caused by protein aggregates, inclusion bodies, plaques, lipofuscin, ceroid, and 'aggresomes' during oxidative stress, aging, and disease. Int J Biochem Cell Biol. 2004;36:2519–2530. doi: 10.1016/j.biocel.2004.04.020. [DOI] [PubMed] [Google Scholar]
- 67.Le Pecheur M, Bourdon E, Paly E, Farout L, Friguet B, London J. Oxidized SOD1 alters proteasome activities in vitro and in the cortex of SOD1 overexpressing mice. FEBS letters. 2005;579:3613–3618. doi: 10.1016/j.febslet.2005.05.048. [DOI] [PubMed] [Google Scholar]
- 68.Furukawa Y, Kaneko K, Yamanaka K, O'Halloran TV, Nukina N. Complete loss of post-translational modifications triggers fibrillar aggregation of SOD1 in the familial form of amyotrophic lateral sclerosis. J Biol Chem. 2008;283:24167–24176. doi: 10.1074/jbc.M802083200. [DOI] [PMC free article] [PubMed] [Google Scholar]
- 69.Poon HF, Hensley K, Thongboonkerd V, Merchant ML, Lynn BC, Pierce WM, Klein JB, Calabrese V, Butterfield DA. Redox proteomics analysis of oxidatively modified proteins in G93A-SOD1 transgenic mice--a model of familial amyotrophic lateral sclerosis. Free Radic Biol Med. 2005;39:453–462. doi: 10.1016/j.freeradbiomed.2005.03.030. [DOI] [PubMed] [Google Scholar]
- 70.Bruijn LI, Houseweart MK, Kato S, Anderson KL, Anderson SD, Ohama E, Reaume AG, Scott RW, Cleveland DW. Aggregation and motor neuron toxicity of an ALS-linked SOD1 mutant independent from wild-type SOD1. Science. 1998;281:1851–1854. doi: 10.1126/science.281.5384.1851. [DOI] [PubMed] [Google Scholar]
- 71.Karch CM, Prudencio M, Winkler DD, Hart PJ, Borchelt DR. Role of mutant SOD1 disulfide oxidation and aggregation in the pathogenesis of familial ALS. Proc Natl Acad Sci U S A. 2009;106:7774–7779. doi: 10.1073/pnas.0902505106. [DOI] [PMC free article] [PubMed] [Google Scholar]
- 72.Choi J, Rees HD, Weintraub ST, Levey AI, Chin LS, Li L. Oxidative modifications and aggregation of Cu,Zn-superoxide dismutase associated with Alzheimer and Parkinson diseases. J Biol Chem. 2005;280:11648–11655. doi: 10.1074/jbc.M414327200. [DOI] [PubMed] [Google Scholar]
- 73.Butterfield DA, Swomley AM, Sultana R. Amyloid beta-peptide (1–42)-induced oxidative stress in Alzheimer disease: importance in disease pathogenesis and progression. Antioxid Redox Signal. 2013;19:823–835. doi: 10.1089/ars.2012.5027. [DOI] [PMC free article] [PubMed] [Google Scholar]