Abstract
BACKGROUND
24,25-dihydroxyvitamin D (24,25(OH)2D) is a metabolite of 25-hydroxyvitamin D (25D). Blacks frequently have low total 25D without manifestations of vitamin D deficiency, suggesting that total serum 25D may incorrectly reflect vitamin D status in different racial groups. The ratio of serum 24,25(OH)2D to 25D (Vitamin D Metabolite Ratio [VMR]) represents a new candidate biomarker for vitamin D status.
METHODS
We measured 24,25(OH)2D3 and 25D3 by mass spectrometry in a random community cohort of black (n=212) and white (n=164) Americans to evaluate VMR as a marker for vitamin D status. We measured parathyroid hormone concentrations by immunoassay to compare VMR and 25D3 against a physiological indicator of vitamin D deficiency.
RESULTS
Serum 24,25(OH)2D3 strongly correlated with 25D3 in both black and white subjects (r = 0.90, p<0.001 and r = 0.86, p<0.001 respectively). Blacks had lower mean 25D3 than whites (17.0±7.8 vs. 27.5±11.3 ng/mL (42.4±19.5 vs. 68.6±28.2 nmol/L), p<0.001) and lower mean 24,25(OH)2D3 (2.1±1.3 vs. 3.6±2.0 ng/mL (5.1±3.1 vs. 8.7±4.8 nmol/L)), p<0.001). In contrast to total 25D3 concentrations, mean VMR values were similar in blacks and whites (11.9±4.0 vs. 12.5±3.4, p=0.16, respectively) and were negatively correlated with parathyroid hormone concentrations in both races (rs= −0.26, p<0.001 and rs= −0.25, p<0.001, respectively).
CONCLUSIONS
Our results provide further evidence that measurement of total 25D for assessment of vitamin D status in patients of African descent deserves reevaluation, and suggests that alternative measures such as VMR should be considered.
Keywords: Vitamin D; 24, 25-dihydroxyvitamin D; parathyroid hormone; racial disparities; ethnic background; mass spectrometry
INTRODUCTION
Vitamin D insufficiency has been widely associated with negative health outcomes including higher mortality (1–5), although cause and effect have yet to be firmly established (6). Among the possible consequences of vitamin D insufficiency, the strongest evidence is for a negative effect on skeletal health (7–9). Clinical investigations of vitamin D supplementation to decrease fracture risk, however, have been inconclusive (2, 10–12). The implications of having low serum concentrations of total 25-hydroxyvitamin D (25D) in black Americans are particularly uncertain. Blacks consistently have lower total 25D than whites and often meet standard criteria for diagnosis of vitamin D insufficiency (i.e., 25D <20 ng/mL (<48.4 nmol/L)) (3, 13, 14), however blacks also have paradoxically higher bone mineral density and a lower risk of osteoporosis and fragility fractures compared to whites (15–18).
This paradox was partially reconciled by recent findings from the Healthy Aging in Neighborhoods of Diversity Across the Lifespan (HANDLS) study (19). Although black Americans have significantly lower mean total 25D concentrations compared to whites, their concentrations of bioavailable 25D may be equivalent (19). These findings have raised important questions as to whether measurement of serum total 25D provides a reliable indicator of vitamin D sufficiency for people of all races and genetic backgrounds (20).
Recent evidence suggests that adequacy of vitamin D may be reflected by concentrations of serum 24,25(OH)2D (21, 22). 24,25(OH)2D is the major product of catabolism of 25D, and because enzymatic synthesis of 24,25(OH)2D is directly proportional to concentrations of 25D substrate, concentrations of both metabolites in circulation are strongly correlated (23). Furthermore, expression of the 24-hydroxylase enzyme (CYP24A1) that converts 25D to 24,25(OH)2D is regulated in part by vitamin D receptor activity (24, 25). Because production of 24,25(OH)2D depends upon both concentrations of 25D and on vitamin D-regulated expression of CYP24A1, concentrations of 24,25(OH)2D may be an even better indicator of vitamin D sufficiency than 25D itself.
Recent findings also suggest that adequacy of vitamin D may be reflected by the ratio of 24,25(OH)2D and 25D serum concentrations (hereinafter referred to as the Vitamin D Metabolite Ratio, or VMR) (21, 22). This ratio should depend primarily upon CYP24A1 expression, which is downregulated in vitamin D deficiency, and thus the VMR would be predicted to decrease in vitamin deficient states. Multiple studies have shown that VMR tends to be disproportionately decreased in patients with low 25D concentrations and in patients who have functional vitamin D deficiency because of chronic kidney disease (CKD) (21–23, 26, 27). Low VMR also may be predictive of responsiveness to vitamin D supplementation (21, 27), and it has been demonstrated that patients with CKD do not increase VMR concentrations in response to vitamin D supplementation as much as control subjects, consistent with the model that defective kidney production of 1,25(OH2)D results in a persistent decrease in 24,25(OH)2D catabolism (22).
Measurement of VMR may also be an indicator of vitamin D sufficiency in African Americans who have low 25D concentrations but are not functionally deficient. African Americans expressing the Gc1F variant of vitamin D binding protein (DBP) have significantly lower concentrations of 25D compared to whites but show no signs of vitamin D deficiency (19, 28–31). We hypothesized that lower serum total 25D concentrations may be related to reduced binding by serum DBP, but that these patients may have sufficient vitamin concentrations due to increased 25D bioavailability. DBP is also the major protein carrier for circulating 24,25(OH)2D (32, 33), and we would predict that effects of DBP binding on vitamin metabolites would affect 25D and 24,25(OH)2D equally, and thus both 25D and 24,25(OH)2D may be lower in African Americans compared to whites, but their VMR values may be equivalent.
The significance of the differences in 25D concentrations between black and white Americans is still a matter of investigation. In the present study, we tested whether there are also differences in concentrations of 24,25(OH)2D and VMR values between racial groups.
MATERIALS AND METHODS
Study Population
HANDLS is a population-based cohort study supported by the Intramural Research Program of the National Institute on Aging (N=3720) (34). Study participants were 30 to 64 years of age, living in Baltimore, Maryland, recruited from 13 contiguous U.S. Census tracts. Participants from the original HANDLS cohort were randomly sampled from within age, race, gender, and socioeconomic status strata, excluding those who did not self-identify as black or white. Participants selected for this ancillary study included all subjects for which there was sufficient serum available for analysis. The Medstar Research Institute’s Institutional Review Board approved the protocol. The Partners Committee on Human Research exempted the present study from review.
Data Collection
We used cross-sectional data from HANDLS collected between 2004 and 2008. After a home-based interview, participants underwent an examination on a mobile research vehicle where blood was sampled, height and weight measured, and bone densitometry performed. Blood samples were typically drawn between 9:15AM – 10:30AM. Only subjects who completed the examination were included in the study.
Laboratory Analysis
Blood samples were drawn at the examination into serum separator tubes without anticoagulant, centrifuged at 1430 × g for 15 minutes, and 1.8 milliliters of serum transferred to Nunc Cryotubes and stored at −80C for future analysis. 100 μL of serum was mixed with 25D3–[2H6] and 24R,25-(OH)2D3–[2H6] isotopic internal standards dissolved in 5% bovine serum albumin (IsoSciences, Inc., King of Prussia, PA). Total 25D3 and 24,25D3 were extracted away from DBP and other serum binding factors by protein precipitation with 250 μL methanol and cleared by centrifugation. Vitamin D metabolites were isolated from extracted supernatants by solid phase extraction chromatography (Strata C-18E 96-well SPE plates, Phenomenex, Inc., Torrences, CA), and eluted with 1 mL ethyl acetate containing 0.1 mg/mL 4-Phenyl-1,2,4-triazole-3,5-dione (PTAD). PTAD-derivatized samples were dried under vacuum and redissolved with 100 μL of 50% ethanol. Samples were then analyzed for vitamin D metabolites using reverse phase chromatography coupled to tandem mass spectrometry in multiple reaction monitoring mode (intra-assay CV 1.1% and 3.5% for 25D3 and 24,25(OH)2D3,respectively). Assays were calibrated using 25D3 and 24R,25-(OH)2D3 commercial standards (Cerilliant, Inc., Round Rock, TX). Intact PTH levels were measured using the Cobas electrochemiluminescense immunoassay on the Modular Analytics E170 automated analyzer (Roche Diagnostics, Indianapolis, IN, USA; inter-assay CV 2.5%). Additional method details are described in the online Supplementary Materials file.
Statistical Analysis
The characteristics of the study participants are presented as means ± standard deviations or numbers and percentages and were compared according to race with the use of t-tests or chi-square tests. As PTH was non-normally distributed, it is presented as a median (quartile 1, quartile 3) and compared with a Mann-Whitney U test between races. The relationship between 25D3 and 24,25D3 was summarized with the use of Pearson product-moment correlation while Spearman’s rank correlation coefficient was used to summarize the relationship between 24,25D3 and PTH by race. All participants were divided into tertiles of PTH and general linear models (GLM) were used to examine interactions between PTH and race in predicting 25D3, 24,25(OH)2D3, or the ratio of 24,25(OH)2D3 to 25D3. Additionally, the association between the ratio of 24,25(OH)2D3 : 25D3 and 25D3 was examined with the use of GLM, including an interaction term between race and 25D3. Due to a possible inflection point, associations between 25D3 and 24,25(OH)2D3 were examined after stratifying by 25D3 concentrations less then and greater than 12 ng/mL within each race. Results of GLM models are presented as means ± 95% confidence intervals. Statistical analyses were conducted with the use of SAS software, version 9.4 (SAS Institute). Two-tailed P values of less than 0.05 were considered to indicate statistical significance.
RESULTS
Assay Validation
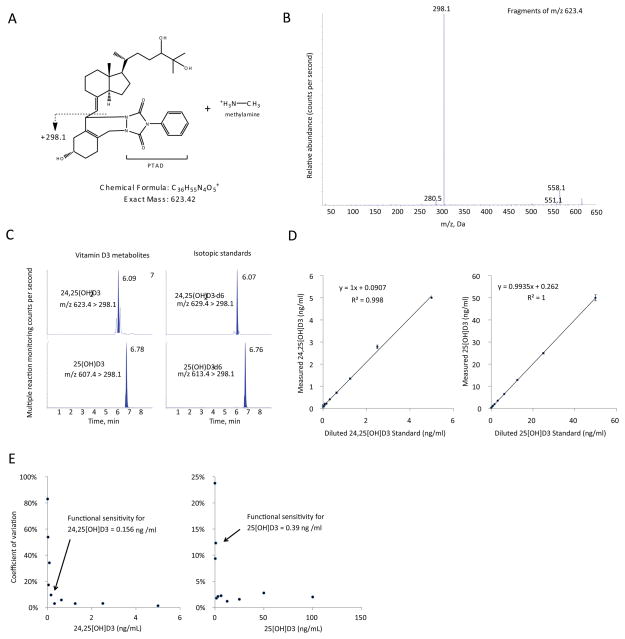
To sensitively measure both 25D3 and 24,25(OH)2D3 we developed an isotope-dilutional tandem mass spectrometric assay adapted from recently described methods (23). The assay uses derivatization with 4-Phenyl-1,2,4-triazole-3,5-dione (PTAD) to increase ionization and sensitivity, and methylamine to improve chromatographic separation of vitamin D metabolites (23). The assay demonstrated adequate linearity and functional sensitivity, reaching sub-nanomolar concentrations (Figure 1).
Figure 1. Assay validation experiments.
(A) Chemical structure and predicted molecular weight of methylamine adduct of PTAD-derivatized 24,25(OH)2D3. (B) MS/MS fragmentation spectra of methylamine adduct of PTAD-derivatized 24,25(OH)2D3. (C) LC-MRM elution peaks of 24,25(OH)2D3 and 25D3 metabolites and their respective isotopic standards from a representative patient sample run. Mass transitions are shown. (D) Assay linearity of serially diluted samples, n=4 replicates per dilution, standard error bars shown. (E) Coefficients of variance of sample assay measurements plotted against analyte concentration; n=4 replicate measurements per data point.
Subject characteristics
Our recently reported study of DBP and vitamin D in HANDLS subjects included 1181 black and 904 white participants (19). In the present study, we analyzed samples from 376 randomly selected subjects from this cohort who had sufficient remaining serum for analysis, including 212 blacks and 164 whites. Baseline characteristics of included black and white subjects were similar in age, sex, body mass index, menopausal status, and renal function (Table 1). There were no statistically significant differences in baseline characteristics of the included subjects compared to non-included HANDLS subjects (data not shown). Significantly more blacks had household incomes <125% of the poverty line than whites (49.5% vs. 32.9%, p=0.001). Blacks were less likely to have a diagnosis of osteoporosis than whites (1.4% vs. 5.5%, p=0.04) and had higher femoral neck bone mineral density (1.04 g/cm2 vs.. 0.95 g/cm2), despite comparable dietary intake of vitamin D and calcium.
Table 1.
Characteristics of Subset of HANDLS Participants Overall and by Race.
| Characteristic | Overall (N=376) | Whites1 (N=164) | Blacks1 (N=212) | P-value |
|---|---|---|---|---|
| Age (y) | 48.6 ± 9.2 | 49.3 ± 9.3 | 48.1 ± 9.1 | 0.18 |
| Male sex (%) | 166 (44.2) | 72 (43.9) | 94 (44.3) | 0.93 |
| Body Mass Index (kg/m2) | 29.6 ± 7.6 | 30.1 ± 7.4 | 29.3 ± 7.8 | 0.31 |
| Household income < 25% poverty line (%) | 159 (42.3) | 54 (32.9) | 105 (49.5) | 0.001 |
| Current smoker (%) | 176 (46.8) | 74 (45.1) | 102 (48.1) | 0.45 |
| Osteoporosis diagnosis (%) | 12 (3.2) | 9 (5.5) | 3 (1.4) | 0.04 |
| Prescribed osteoporosis therapy (%) | 10 (2.7) | 6 (3.7) | 4 (1.9) | 0.29 |
| Postmenopausal (% of women) | 108 (51.4) | 52 (56.5) | 56 (47.5) | 0.21 |
| Prescribed HRT (% of women) | 5 (2.4) | 2 (2.2) | 3 (2.5) | 0.81 |
| Microalbuminuria (%) | 4 (1.1) | 2 (1.2) | 2 (0.9) | 0.99 |
| eGFR <60 ml/min/m2 (%) | 26 (6.9) | 9 (5.5) | 17 (8.0) | 0.35 |
| Prescribed antiepileptic agents (%) | 3 (0.8) | 2 (1.2) | 1 (0.5) | 0.42 |
| Prescribed glucocorticoids (%) | 5 (1.3) | 1 (0.6) | 4 (1.9) | 0.28 |
| Dietary vitamin D intake (IU/day) | 154 ± 181 | 164 ± 223 | 146 ± 141 | 0.37 |
| Dietary calcium intake (mg/day) | 745 ± 568 | 761 ± 601 | 732 ± 542 | 0.62 |
| Femoral neck bone mineral density (g/cm2) | 1.00 ± 0.19 | 0.95 ± 0.16 | 1.04 ± 0.19 | <0.001 |
| Serum calcium (mg/dL) | 9.3 ± 0.4 | 9.3 ± 0.4 | 9.3 ± 0.4 | 0.63 |
| Parathyroid hormone (pg/mL)† | 36 (29, 47) | 34 (27, 45) | 38 (30, 48) | 0.01 |
| 25D3 (ng/mL) | 21.6 ± 10.8 | 27.5 ± 11.3 | 17.0 ± 7.8 | <0.001 |
| 24,25D3 (ng/mL) | 2.7 ± 1.8 | 3.6 ± 2.0 | 2.1 ± 1.3 | <0.001 |
| VMR (24,25(OH)2D3/25D3 ratio) × 100 | 12.1 ± 3.7 | 12.5 ± 3.4 | 11.9 ± 4.0 | 0.16 |
There were no statistically significant differences between any of the characteristics of white HANDLS subjects included in this study compared to non-included whites, and no differences between included and non-included black HANDLS subjects.
HRT = hormone replacement therapy
Table shows means ± standard deviations,
median (quartile 1, quartile 3), or number (percentage).
Vitamin D concentrations
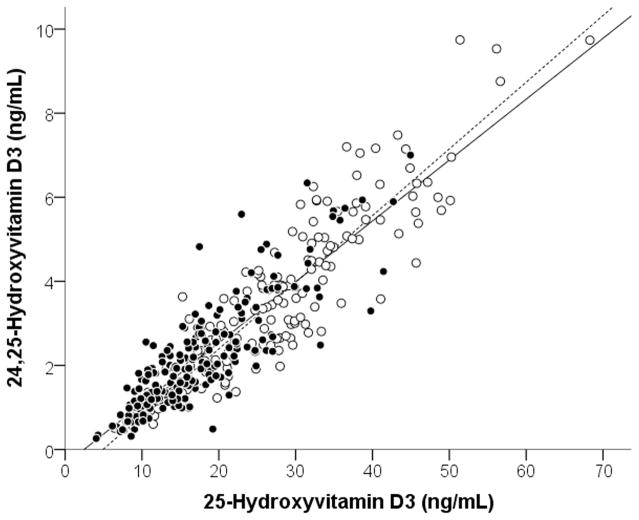
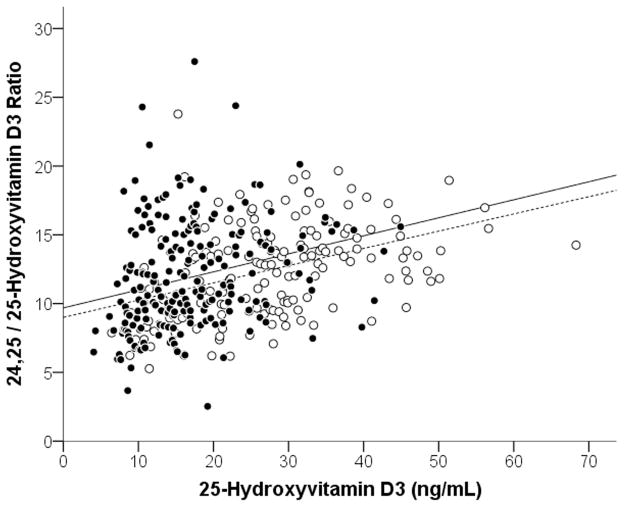
Serum concentrations of 25D3 were significantly lower in blacks than whites (17.0±7.8 vs. 27.5±11.3 ng/mL (42.4±19.5 vs. 68.6±28.2 nmol/L), p<0.001), as were the mean 24,25(OH)2D3 concentrations (2.1±1.3 vs. 3.6±2.0 ng/mL (5.1±3.1 vs. 8.7±4.8 nmol/L)), p<0.001) (Table 1). Concentrations of 25D3 highly correlated with 24,25(OH)2D3 (Figure 2), both in the overall population (r=0.91, P<0.001) and when examined by race (in blacks, r=0.86, p<0.001; in whites, r=0.90, p<0.001). The ratio of 24,25(OH)2D3 to 25D3 (i.e., the VMR) in blacks and whites was similar (11.9±4.0 vs. 12.5±3.4, p=0.16). Although VMR values were similar between blacks and whites, when subjects’ VMR values were plotted against 25D3 concentrations (Figure 3), there was a linear association between VMR and 25D3 concentrations in both blacks and whites (β (95% CI) for 25D in Blacks was 0.14 (0.09, 0.19) and for whites was 0.11 (0.08, 0.15). Interestingly, the interaction term in the linear regression model for 25D3*race was p<0.001, indicating that the difference between the two linear models for blacks and whites was statistically significant, and that at any given concentration of 25D3 blacks had higher average VMR values.
Figure 2. Association between 25D3 and 24,25(OH)2D3.
In the overall population, 25D3 and 24,25(OH)2D3 were strongly associated (r = 0.91, p<0.001). In blacks (closed circles, solid line) and whites (open circles, dashed line), this association remained highly significant when examined separately by race (blacks: r = 0.86, P<0.001; whites: r = 0.90, P<0.001).
Figure 3. Association between VMR (24,25(OH)2D3/25D3 ratio) and 25D3.
Associations between 24,25D3:25D3 ratio values vs 25D3 for blacks (solid circles) and whites (open circles). For blacks, rs= 0.26, P<0.001. For whites, rs= 0.41, P<0.001).
Associations between Vitamin D parameters and PTH
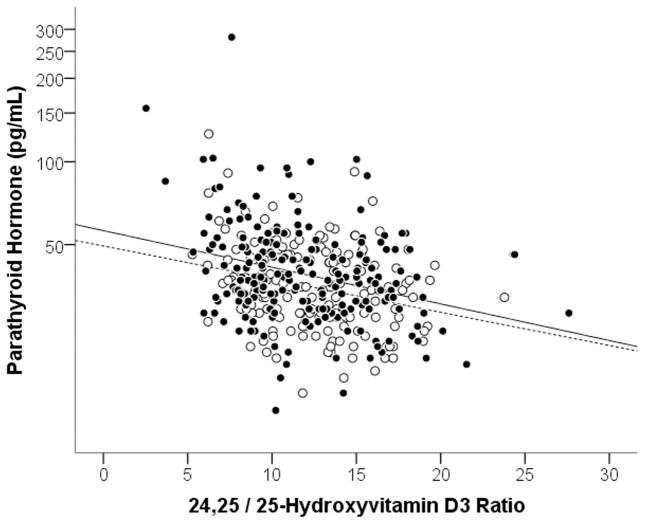
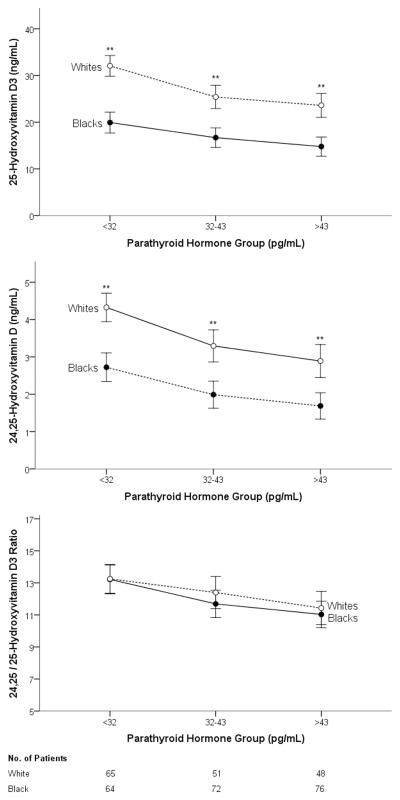
Median PTH concentrations were slightly higher in blacks than in whites (38 pg/mL vs. 34 pg/mL, p=0.01). The VMR was negatively associated with PTH to a similar degree in both blacks (rs=−0.26, p=0.01) and whites (rs=−0.25, p<0.01) (Figure 4). The overall correlation between VMR and PTH amongst all subjects was rs=−0.26, p=0.01; in comparison, the correlation between was rs=XXX, p=. Grouping subjects by PTH levels divided into tertiles (i.e., Tertile 1 [low] <32 pg/mL, Tertile 2 [mid] ≤32 pg/mL ≤43 pg/mL, Tertile 3 [high] >43 pg/mL), we observed the expected inverse relationship between PTH and all vitamin D parameters (Figure 5). Both 25D3 and 24,25(OH)2D3 concentrations were significantly lower in blacks than in whites within each PTH tertile (p<0.001 for all comparisons), but VMRs were nearly indistinguishable by race (p=0.96 for Tertile 1; p=0.29 for Tertile 2; p=0.56 for Tertile 3).
Figure 4. Association between VMR (24,25(OH)2D3/25D3 ratio) and parathyroid hormone (PTH) concentrations.
Associations between VMR values and PTH for Blacks (closed circles, solid line) and whites (open circles, dashed line). For blacks, rs= −0.26, p<0.001. For whites, rs= −0.25, P=0.001). The VMR values are multipled by 100.
Figure 5. Vitamin D measures by race among similar parathyroid hormone concentrations.
Blacks (closed circles, solid line) and whites (open circles, dashed line) for each tertile of PTH concentration. The VMR (24,25(OH)2D3/25D3 ratio) did not differ between races. **Significant at p<0.01.
DISCUSSION
In this study we calculated VMR values from measured concentrations of 25D3 and 24,25D3 in a randomly selected subset of black and white Americans in order to assess how this new indicator reflects vitamin D status, and whether it this marker can be informative independent of race. We observed that although concentrations of 25D3 and 24,25D3 strongly correlated with each other and were both lower in black Americans compared to whites, blacks and whites had equivalent median VMR values. Although there were no differences in serum calcium concentrations and no differences in calcium and vitamin D intake between blacks and whites, black Americans in this cohort had significantly higher median bone mineral density compared to whites, despite their lower concentrations of 25D3 and 24,25D3. When blacks and whites were analyzed separately and stratified according to their PTH concentrations, there was a significant association between high PTH and lower median VMR values, as well as lower 25D3 and 24,25D3 concentrations, corroborating the independent associations of each of these measures of vitamin D sufficiency with calcium homeostasis. Perhaps even more relevant, however, was the observation that blacks with similar PTH concentrations as whites had lower median 25D3 and 24,25D3 concentrations but equivalent VMR values. Lastly, there were statistically significant correlations between VMR values and serum PTH concentrations in both blacks and whites; furthermore, these scatterplots appeared largely overlapping, suggesting that the association between low VMR and rising PTH concentrations may be equivalent between races. Thus it may be possible to interpret VMR values using universal clinical thresholds for all patients if future studies confirm VMR to be an accurate indicator of vitamin D sufficiency.
Because both 25D3 and 24,25(OH)2D3 are bound by serum DBP, differences in concentrations of DBP may influence concentrations of total 24,25(OH)2D in the same way as they do 25D3, independent of vitamin D sufficiency (19, 31). As a result, measurements of 24,25(OH)2D3 would be predicted to be lower in blacks (as observed in this study), and interpretation of 24,25(OH)2D3 concentrations in the evaluation of vitamin D status in African Americans will be subject to the same caveats as 25D3. In contrast, VMR values should be less influenced by racial differences in DBP concentrations and vitamin D binding affinity characteristics since these differences will influence both the numerator and denominator of the VMR ratio similarly and should cancel each other out. Importantly, the organic extraction methods used in this study to measure VMR extract 24,25(OH)2D3 and 25D3 away from DBP, and thus VMR measurements will not be influenced by DBP concentrations, as has been observed in immunoassay methods of 25D3 measurements (35).
There are currently no automated immunoassays available for measurement of 24,25(OH)2D, and thus measurement of 24,25(OH) 2D and VMR values for now will only be available to clinical laboratories with LC-MS capabilities. Synthesis of 1,25(OH)2D by the kidneys is induced by vitamin D deficiency (36), and thus it is possible that the ratio of 1,25(OH)2D : 25D may be altered in patients with vitamin deficiencies in the same manner as 24,25(OH)2D VMR values are. We believe that a sensitive and robust multiplex LC-MS/MS assay for simultaneous measurement of 1,25(OH)2D, 24,25(OH)2D, and 25D will enhance future investigations regarding the optimal combination of analytes for the assessment of vitamin D sufficiency.
Supplementary Material
Acknowledgments
This work was supported in part by the National Institute on Aging Intramural Research Program at NIH, project #ZIA AG000513. We recognize the excellent participant evaluation and management skills of Dr. Ngozi Ejiogu, the HANDLS clinical staff, and study manager Jennifer Norbeck. We thank Health Disparities Research Section staff Nicole Noren Hooten, Kim Jacobs, Megan Fitzpatrick, Althaf Lohani and Janice Barnes for excellent handling and processing of all HANDLS biomaterials. Portions of this study utilized the high-performance computational capabilities of the Biowulf Linux cluster at the National Institutes of Health, Bethesda, Maryland. A. Berg is supported by K08 HL121801 from the National Institutes of Health. A. Karumanchi is supported by Howard Hughes Medical Institute. R. Thadhani is supported by K24 DK094872 and R01 DK094486 from the National Institutes of Health.
LIST OF ABBREVIATIONS
- 24,25(OH)2D
24,25-dihydroxyvitamin D
- 25D
25-hydroxyvitamin D3 and 25-hydroxyvitamin D2 combined
- 25D3
25-hydroxyvitamin D3
- VMR
Vitamin D Metabolite Ratio
- HANDLS
Healthy Aging in Neighborhoods of Diversity Across the Lifespan study
- DBP
Vitamin D binding protein
- CYP24A1
24-hydroxylase enzyme
- PTAD
4-Phenyl-1,2,4-triazole-3,5-dione
References
- 1.Melamed ML, Michos ED, Post W, Astor B. 25-hydroxyvitamin D levels and the risk of mortality in the general population. Arch Intern Med. 2008;168:1629–37. doi: 10.1001/archinte.168.15.1629. [DOI] [PMC free article] [PubMed] [Google Scholar]
- 2.Cauley JA, Lacroix AZ, Wu L, Horwitz M, Danielson ME, Bauer DC, et al. Serum 25-hydroxyvitamin D concentrations and risk for hip fractures. Ann Intern Med. 2008;149:242–50. doi: 10.7326/0003-4819-149-4-200808190-00005. [DOI] [PMC free article] [PubMed] [Google Scholar]
- 3.Ginde AA, Liu MC, Camargo CA., Jr Demographic differences and trends of vitamin D insufficiency in the US population, 1988–2004. Arch Intern Med. 2009;169:626–32. doi: 10.1001/archinternmed.2008.604. [DOI] [PMC free article] [PubMed] [Google Scholar]
- 4.Wactawski-Wende J, Kotchen JM, Anderson GL, Assaf AR, Brunner RL, O’Sullivan MJ, et al. Calcium plus vitamin D supplementation and the risk of colorectal cancer. The New England journal of medicine. 2006;354:684–96. doi: 10.1056/NEJMoa055222. [DOI] [PubMed] [Google Scholar]
- 5.Wang TJ, Pencina MJ, Booth SL, Jacques PF, Ingelsson E, Lanier K, et al. Vitamin D deficiency and risk of cardiovascular disease. Circulation. 2008;117:503–11. doi: 10.1161/CIRCULATIONAHA.107.706127. [DOI] [PMC free article] [PubMed] [Google Scholar]
- 6.Trummer O, Pilz S, Hoffmann MM, Winkelmann BR, Boehm BO, Marz W, et al. Vitamin D and mortality: a Mendelian randomization study. Clinical chemistry. 2013;59:793–7. doi: 10.1373/clinchem.2012.193185. [DOI] [PubMed] [Google Scholar]
- 7.Thomas MK, Lloyd-Jones DM, Thadhani RI, Shaw AC, Deraska DJ, Kitch BT, et al. Hypovitaminosis D in medical inpatients. The New England journal of medicine. 1998;338:777–83. doi: 10.1056/NEJM199803193381201. [DOI] [PubMed] [Google Scholar]
- 8.Heaney RP, Weaver CM. Calcium and vitamin D. Endocrinol Metab Clin North Am. 2003;32:181–94. vii–viii. doi: 10.1016/s0889-8529(02)00063-4. [DOI] [PubMed] [Google Scholar]
- 9.Villareal DT, Civitelli R, Chines A, Avioli LV. Subclinical vitamin D deficiency in postmenopausal women with low vertebral bone mass. The Journal of clinical endocrinology and metabolism. 1991;72:628–34. doi: 10.1210/jcem-72-3-628. [DOI] [PubMed] [Google Scholar]
- 10.Chapuy MC, Arlot ME, Duboeuf F, Brun J, Crouzet B, Arnaud S, et al. Vitamin D3 and calcium to prevent hip fractures in the elderly women. The New England journal of medicine. 1992;327:1637–42. doi: 10.1056/NEJM199212033272305. [DOI] [PubMed] [Google Scholar]
- 11.Jackson RD, LaCroix AZ, Gass M, Wallace RB, Robbins J, Lewis CE, et al. Calcium plus vitamin D supplementation and the risk of fractures. The New England journal of medicine. 2006;354:669–83. doi: 10.1056/NEJMoa055218. [DOI] [PubMed] [Google Scholar]
- 12.Ooms ME, Roos JC, Bezemer PD, van der Vijgh WJ, Bouter LM, Lips P. Prevention of bone loss by vitamin D supplementation in elderly women: a randomized double-blind trial. The Journal of clinical endocrinology and metabolism. 1995;80:1052–8. doi: 10.1210/jcem.80.4.7714065. [DOI] [PubMed] [Google Scholar]
- 13.Mitchell DM, Henao MP, Finkelstein JS, Burnett-Bowie SA. Prevalence and predictors of vitamin D deficiency in healthy adults. Endocr Pract. 2012;18:914–23. doi: 10.4158/EP12072.OR. [DOI] [PMC free article] [PubMed] [Google Scholar]
- 14.Gutierrez OM, Farwell WR, Kermah D, Taylor EN. Racial differences in the relationship between vitamin D, bone mineral density, and parathyroid hormone in the National Health and Nutrition Examination Survey. Osteoporosis international : a journal established as result of cooperation between the European Foundation for Osteoporosis and the National Osteoporosis Foundation of the USA. 2010;22:1745–53. doi: 10.1007/s00198-010-1383-2. [DOI] [PMC free article] [PubMed] [Google Scholar]
- 15.Hannan MT, Litman HJ, Araujo AB, McLennan CE, McLean RR, McKinlay JB, et al. Serum 25-hydroxyvitamin D and bone mineral density in a racially and ethnically diverse group of men. The Journal of clinical endocrinology and metabolism. 2008;93:40–6. doi: 10.1210/jc.2007-1217. [DOI] [PMC free article] [PubMed] [Google Scholar]
- 16.Bischoff-Ferrari HA, Dietrich T, Orav EJ, Dawson-Hughes B. Positive association between 25-hydroxy vitamin D levels and bone mineral density: a population-based study of younger and older adults. Am J Med. 2004;116:634–9. doi: 10.1016/j.amjmed.2003.12.029. [DOI] [PubMed] [Google Scholar]
- 17.Cauley JA, Lui LY, Ensrud KE, Zmuda JM, Stone KL, Hochberg MC, Cummings SR. Bone mineral density and the risk of incident nonspinal fractures in black and white women. JAMA. 2005;293:2102–8. doi: 10.1001/jama.293.17.2102. [DOI] [PubMed] [Google Scholar]
- 18.Cauley JA, Danielson ME, Boudreau R, Barbour KE, Horwitz MJ, Bauer DC, et al. Serum 25-hydroxyvitamin D and clinical fracture risk in a multiethnic cohort of women: the Women’s Health Initiative (WHI) J Bone Miner Res. 2011;26:2378–88. doi: 10.1002/jbmr.449. [DOI] [PMC free article] [PubMed] [Google Scholar]
- 19.Powe CE, Evans MK, Wenger J, Zonderman AB, Berg AH, Nalls M, et al. Vitamin D-binding protein and vitamin D status of black Americans and white Americans. The New England journal of medicine. 2013;369:1991–2000. doi: 10.1056/NEJMoa1306357. [DOI] [PMC free article] [PubMed] [Google Scholar]
- 20.Carter GD, Phinney KW. Assessing Vitamin D Status: Time For a Rethink? Clinical chemistry. 2014 doi: 10.1373/clinchem.2013.219386. [DOI] [PubMed] [Google Scholar]
- 21.Wagner D, Hanwell HE, Schnabl K, Yazdanpanah M, Kimball S, Fu L, et al. The ratio of serum 24,25-dihydroxyvitamin D(3) to 25-hydroxyvitamin D(3) is predictive of 25-hydroxyvitamin D(3) response to vitamin D(3) supplementation. The Journal of steroid biochemistry and molecular biology. 2011;126:72–7. doi: 10.1016/j.jsbmb.2011.05.003. [DOI] [PubMed] [Google Scholar]
- 22.Bosworth CR, Levin G, Robinson-Cohen C, Hoofnagle AN, Ruzinski J, Young B, et al. The serum 24,25-dihydroxyvitamin D concentration, a marker of vitamin D catabolism, is reduced in chronic kidney disease. Kidney international. 2012;82:693–700. doi: 10.1038/ki.2012.193. [DOI] [PMC free article] [PubMed] [Google Scholar]
- 23.de Boer IH, Sachs MC, Chonchol M, Himmelfarb J, Hoofnagle AN, Ix JH, et al. Estimated GFR and circulating 24,25-dihydroxyvitamin D3 concentration: a participant-level analysis of 5 cohort studies and clinical trials. Am J Kidney Dis. 2014;64:187–97. doi: 10.1053/j.ajkd.2014.02.015. [DOI] [PMC free article] [PubMed] [Google Scholar]
- 24.Jones G, Prosser DE, Kaufmann M. Cytochrome P450-mediated metabolism of vitamin D. J Lipid Res. 2013;55:13–31. doi: 10.1194/jlr.R031534. [DOI] [PMC free article] [PubMed] [Google Scholar]
- 25.Pike JW, Meyer MB. Regulation of mouse Cyp24a1 expression via promoter-proximal and downstream-distal enhancers highlights new concepts of 1,25-dihydroxyvitamin D(3) action. Arch Biochem Biophys. 2011;523:2–8. doi: 10.1016/j.abb.2011.12.003. [DOI] [PMC free article] [PubMed] [Google Scholar]
- 26.Kaufmann M, Gallagher JC, Peacock M, Schlingmann KP, Konrad M, DeLuca HF, et al. Clinical utility of simultaneous quantitation of 25-hydroxyvitamin D and 24,25-dihydroxyvitamin D by LC-MS/MS involving derivatization with DMEQ-TAD. The Journal of clinical endocrinology and metabolism. 2014;99:2567–74. doi: 10.1210/jc.2013-4388. [DOI] [PMC free article] [PubMed] [Google Scholar]
- 27.Stubbs JR, Zhang S, Friedman PA, Nolin TD. Decreased Conversion of 25-hydroxyvitamin D3 to 24,25-dihydroxyvitamin D3 Following Cholecalciferol Therapy in Patients with CKD. Clinical journal of the American Society of Nephrology : CJASN. 2014;9:1965–73. doi: 10.2215/CJN.03130314. [DOI] [PMC free article] [PubMed] [Google Scholar]
- 28.Powe CE, Ricciardi C, Berg AH, Erdenesanaa D, Collerone G, Ankers E, et al. Vitamin D-binding protein modifies the vitamin D-bone mineral density relationship. J Bone Miner Res. 2011;26:1609–16. doi: 10.1002/jbmr.387. [DOI] [PMC free article] [PubMed] [Google Scholar]
- 29.Bhan I, Powe CE, Berg AH, Ankers E, Wenger JB, Karumanchi SA, Thadhani RI. Bioavailable vitamin D is more tightly linked to mineral metabolism than total vitamin D in incident hemodialysis patients. Kidney international. 2012;82:84–9. doi: 10.1038/ki.2012.19. [DOI] [PMC free article] [PubMed] [Google Scholar]
- 30.Wilson RT, Bortner JD, Jr, Roff A, Das A, Battaglioli EJ, Richie JP, Jr, et al. Genetic and environmental influences on plasma vitamin D binding protein concentrations. Translational research : the journal of laboratory and clinical medicine. 2014 doi: 10.1016/j.trsl.2014.08.003. [DOI] [PubMed] [Google Scholar]
- 31.Johnsen MS, Grimnes G, Figenschau Y, Torjesen PA, Almas B, Jorde R. Serum free and bio-available 25-hydroxyvitamin D correlate better with bone density than serum total 25-hydroxyvitamin D. Scandinavian journal of clinical and laboratory investigation. 2014;74:177–83. doi: 10.3109/00365513.2013.869701. [DOI] [PubMed] [Google Scholar]
- 32.Kawakami M, Imawari M, Goodman DS. Quantitative studies of the interaction of cholecalciferol ((vitamin D3) and its metabolites with different genetic variants of the serum binding protein for these sterols. The Biochemical journal. 1979;179:413–23. doi: 10.1042/bj1790413. [DOI] [PMC free article] [PubMed] [Google Scholar]
- 33.Haddad JG., Jr Transport of vitamin D metabolites. Clinical orthopaedics and related research. 1979:249–61. [PubMed] [Google Scholar]
- 34.Evans MK, Lepkowski JM, Powe NR, LaVeist T, Kuczmarski MF, Zonderman AB. Healthy aging in neighborhoods of diversity across the life span (HANDLS): overcoming barriers to implementing a longitudinal, epidemiologic, urban study of health, race, and socioeconomic status. Ethn Dis. 2010;20:267–75. [PMC free article] [PubMed] [Google Scholar]
- 35.Heijboer AC, Blankenstein MA, Kema IP, Buijs MM. Accuracy of 6 routine 25-hydroxyvitamin D assays: influence of vitamin D binding protein concentration. Clinical chemistry. 2012;58:543–8. doi: 10.1373/clinchem.2011.176545. [DOI] [PubMed] [Google Scholar]
- 36.Jones G. Expanding role for vitamin D in chronic kidney disease: importance of blood 25-OH-D levels and extra-renal 1alpha-hydroxylase in the classical and nonclassical actions of 1alpha,25-dihydroxyvitamin D(3) Seminars in dialysis. 2007;20:316–24. doi: 10.1111/j.1525-139X.2007.00302.x. [DOI] [PubMed] [Google Scholar]
Associated Data
This section collects any data citations, data availability statements, or supplementary materials included in this article.


