Abstract
Background
Stationary sawing machinery is often a basic tool in the wood product manufacturing industry and was the source for over 2,500 injury/illness events that resulted in days away from work in 2010.
Methods
We examined 9 years of workers’ compensation claims for the state of Ohio in wood product manufacturing with specific attention to saw-related claims. For the study period, 8,547 claims were evaluated; from this group, 716 saw-related cases were examined.
Results
The sawmills and wood preservation sub-sector experienced a 71% reduction in average incidence rate and an 87% reduction in average lost-time incidence rate from 2001 to 2009. The top three injury category descriptions for lost-time incidents within saw-related claims were fracture (35.8%), open wounds (29.6%), and amputation (14.8%).
Conclusions
For saw-related injuries, preventing blade contact remains important but securing the work piece to prevent kickback is also important.
Keywords: saws, machine safety, blade, kickback, wood
INTRODUCTION
According to the Bureau of Labor Statistics (BLS) estimates, nearly 3.0 million nonfatal occupational injuries/illnesses were reported among private industries in 2011 [U.S. Bureau of Labor Statistics, 2012]. The total incidence rate for injuries/illnesses in all U.S. private industries was unchanged in 2011 compared to the previous year (3.5 per 100 equivalent full-time workers). This is the first time the total incidence rate did not decrease in a decade. Among the major private industry sectors, manufacturing had the second highest total recordable incidence rate in 2011(4.4 per 100). Within the manufacturing sector, employees in wood product manufacturing had the second highest incidence of total recordable cases in 2011 (6.5 per 100).
Previous research in wood product manufacturing identified several potential risk factors for occupational injuries: lack of equipment safety devices (e.g., machine guarding, poorly designed tool handles, and machine guard openings); equipment reach requirements; weight and location of manually handled loads; shift work; overtime; rapid work pace; repetitive work; and machine-pacing [Holcroft and Punnett, 2009]. Other factors that are associated with occupational injuries in wood product manufacturing involve workers’ demographics and lifestyle behaviors, work experience, ergonomic hazards (e.g., worksite design), poor working conditions, employer size, and industry type [Cheng, 1997; Champoux and Brun, 2003].
Lost work time indicates the severity of injuries/illnesses. In 2011, the total incidence rate resulting in days away from work of all injuries involving contact with objects (including saws) was 98.3 injuries per 10,000 full-time employees among all U.S. private industries in wood product manufacturing (North American Industry Classification System [NAICS] code 321 [U.S. Census Bureau, 2011]). Other commonly reported occupational injuries include musculoskeletal disorders (MSDs); slips, trips, and falls (STFs); lacerations; and amputations [Harner, 1988; McCall and Horwitz, 2006; Anderson et al., 2010; Frank et al., 2010]. In comparison to the contact with objects rate of 98.3 per 10,000 full-time employees, STF incidence rates resulting in days away from work averaged 14.5 (fall on same level), 7.8 (fall to lower level), and 2.2 (slips or trips without fall) injuries per 10,000 full-time employees in wood product manufacturing. The incidence rate of total MSDs was also less than contact with objects with 47.7 injuries per 10,000 full-time employees in wood product manufacturing [U.S. Bureau of Labor Statistics, 2013].
Some of the risk in wood product manufacturing comes from the machinery that is necessary for processing and production. The sub-group of metal, woodworking, and special material machinery (Occupational Injury and Illness Classification System [OIICS] source code 35) was the leading machinery source of contact with object events with 8,280 events involving days away from work in 2010 [U.S. Bureau of Labor Statistics, 2011]. More specifically, sawing machinery-stationary (OIICS source code 357) was the leading source of days (one or more) away from work with 2,560 events in 2010 [U.S. Bureau of Labor Statistics, 2011]. Past research among furniture manufacturers suggests occupational injuries are commonly caused by the following machines: saws, such as circular, band, multiple edging, dimensional circular, and cross-cutting saws; boring and milling machines; grinders; machine lines and combination machines; planes; gluing; and composition machines [Aaltonen, 1996]. Specifically, studies which analyzed injuries related to power saws estimated 64,100 power saw-related injuries (occupational and general population) for 2001 [Marcy et al., 2003]. German researchers have identified circular saws and panel saws as among the most hazardous machines [Reinert et al., 2009].
Injuries/illnesses in wood product manufacturing can be characterized by examining workers’ compensation claims. The Ohio Bureau of Workers’ Compensation (OBWC) is the largest of four, exclusive, state-run workers’ compensation (WC) systems in the U.S. All employers with 1 to 499 employees must be insured by OBWC; however, employers with greater than 500 employees have the option to be self-insured. Sole proprietors and partners are not required to have workers’ compensation coverage in Ohio, but may choose voluntarily to be insured by OBWC. OBWC maintains a database that includes workplace injury/illness workers’ compensation claims for Ohio employers. The purpose of this report is to describe the magnitude and distribution of occupational injuries/illnesses among single-location, OBWC-insured wood product manufacturers in Ohio, and to assess saw-related injuries. Our investigation examines several descriptive elements for characterizing wood product manufacturing workers’ compensation claims in Ohio including: frequency and distribution of claims; cause of claims; total claims incidence rates among four-digit NAICS sub-groups and employer size; and claim severity examined by medical only and lost-time cases.
METHODS
To prevent occupational injuries/illnesses to workers employed by wood product manufacturers in Ohio, the National Institute for Occupational Safety and Health (NIOSH) and OBWC collaborated to investigate occupational injuries/illnesses reported to OBWC among single-location wood product manufacturers with less than 500 employees. To accomplish this, sub-sectors with NAICS codes beginning with “321” were selected from the OBWC database with inclusion of sub-sectors with NAICS codes, 321113–321999 (details in Appendix A). This dataset included workers’ compensation claims for 2001–2009 from all single-location, OBWC-insured wood product manufacturing employers. To ensure that all claims were associated with wood product manufacturing only, claims from multi-location employers were not included because OBWC claims cannot be linked to a particular business site if the employer operates more than one location and NAICS codes can vary by location. Of all claims submitted to the OBWC, 20% are from multi-location employers. Disallowed and dismissed claims were excluded from all analyses.
Incidence rates were generated from OBWC data using employee counts for denominator data that originate from quarterly census of employment and wages reports submitted to the state of Ohio. Information on employee counts is reported for each OBWC policy and for each NAICS group. Additionally, the OBWC database includes: narrative event descriptions; an optimal return to work (RTW) International Classification of Disease, Ninth Revision, Clinical Modification (ICD-9-CM), diagnosis code for the claim; claim severity information defined as medical only or lost-time (eight days or more); and occupation. Reported workers’ compensation data were provided in a spreadsheet format (Microsoft Excel 2010, Microsoft Corp., Redmond, WA). All injury/illness claims were defined by a RTWICD-9-CM code. The optimal RTWICD-9-CM code is the one that most likely will keep the injured worker off of work for the longest period of disability and is assigned by the OBWC. The algorithm employed by OBWC follows four steps: (i) if there is only one ICD, that one is listed as the optimal RTWICD; (ii) if there are multiple ICDs and only one of them has a well-managed benchmark (expected duration based on OBWC experience), the one with the benchmark is listed as the optimal RTWICD; (iii) if there are multiple ICDs that have well-managed benchmarks, the one with the highest value (i.e., longest expected duration of disability) is listed as the optimal RTW ICD; and (iv) If there are multiple ICDs that have well-managed benchmarks and there is a tie at the highest value, the ICD code itself is the tiebreaker (i.e., highest numerical value of the ICD).
Claims Definitions
Three primary coding categories were established based on the narrative event descriptions in the workers’ compensation claims and RTW ICD-9-CM code: musculoskeletal disorders (MSDs); slips, trips, and falls (STFs); and other (OTH). With few exceptions, MSDs were defined according to the BLS case definition (used prior to 2011).1 Coded injury/illness diagnosis data and narrative text on causation were used to identify MSD claims. A Bayesian auto-coding technique used both data elements to identify MSDs by using a “training” and “testing” set of manually coded claims [Bertke et al., 2012]. Bertke et al. demonstrated a sensitivity of 90.3% and specificity of 97.6% for identifying MSD claims using this auto-coding technique.
The criterion to define a claim as a STF varies slightly from the BLS definition.2 Coded RTWICD-9-CM claim data and narrative event descriptions were used to identify STF claims using the previously described Bayesian auto-coding technique. Bertke et al. demonstrated a sensitivity of 90.5% and a specificity of 93.0% for identifying STF claims using the auto-coding technique. The auto-coding technique identified 1,683 MSD claims, 1,356 STF claims, and 5,508 OTH claims. The three categories were mutually exclusive.
To find OTH claims specifically related to stationary saw injuries, a keyword search was performed and additional coding was implemented. Any claim within the OBWC database that included the word “saw” in the injury/illness narrative description field was defined as a saw-related case. A total of 810 saw-related cases were identified as a subset classification among cases described as OTH. An additional search within the injury narrative description field of the OBWC database facilitated development of causes of saw-related claims into six categories:
unexpected or inadvertent saw action,
kickback or unexpected movement of wood or piece being cut,
pulled into blade by gloves or clothing,
body part caught in, or struck by, machine/blade,
sawdust or small debris entering eye,
not a stationary saw (i.e., chain saw, portable circular saw, etc.).
Total claim incidence rates and lost-time claim incidence rates were calculated among each wood product manufacturing sub-sector, categorized by employer size and the industries’ four-digit NAICS code: sawmills and wood preservation (3211); veneer, plywood, and engineered wood product manufacturing (3212); and other wood product manufacturing (3219) (see Appendix A for detailed descriptions). Claim incidence rates were obtained from all claims (lost-time and medical only) per 100 reported number of employees (full-time and part-time). To avoid identifying individual employers, rates based on five or fewer employers were not included in the analysis. Due to the low number of single-location, wood product manufacturing employers with 250 or more employees, rates for these employers were not reported.
Analysis of Trends
For each NAICS four-digit category within the wood product manufacturing industry, the incidence rate for all claims and lost-time claims was calculated annually. An annual average of all employers within each NAICS four-digit category was calculated for each year from 2001 to 2009. The annual lost-time incidence rate included all claims resulting in eight or more days away from work in any given year from each NAICS four-digit category. A very small proportion (3%) of employers with limited claims activity, but no reported employees were excluded from these analyses.
Saw-related claims were further analyzed by using the injury category description which is based on the Optimal Return to Work (RTW) ICD-9-CM description code.3 Frequency distributions of all claims as well as frequency distributions of saw-related claims were performed.
RESULTS
Distribution of Establishments Among Industry Sub-Sectors
By far, the largest number of establishments were in the “other wood product manufacturing” [NAICS 3219] sub-sector. For the time period 2001–2009, the distribution of establishments by size remained relatively constant. The “veneer, plywood, and engineered wood product manufacturing” sub-sector experienced the most change (on a percentage basis) in distribution of establishments by number of employees. For both “sawmills and wood preservation” and “other wood product manufacturing” sub-sectors, the leading employer size was 1–10 employees. In general, the “veneer, plywood, and engineered wood product manufacturing” sub-sector had more employees per establishment with the highest category being 11–49 employees for many years except for 2008 and 2009.
Injury Distribution Among Industry Sub-Sectors
Total incidence rates were calculated by OBWC among each type of wood product manufacturing sub-sector (indicated by NAICS four-digit code) annually from 2001 to 2009 stratified by employer size (1–10 employees, 11–49 employees, and 50–249 employees). Incidence rates were determined per 100 employees per OBWC methodology.4
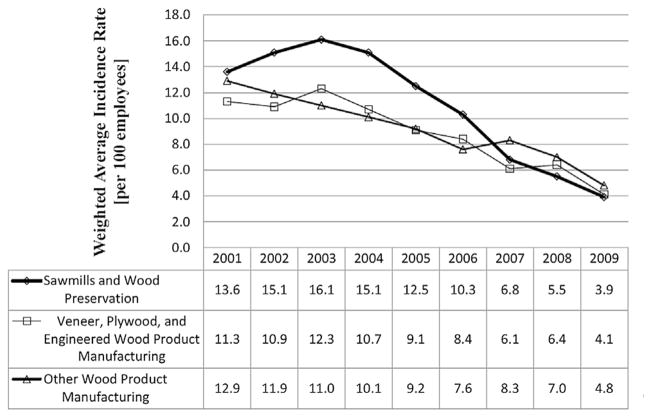
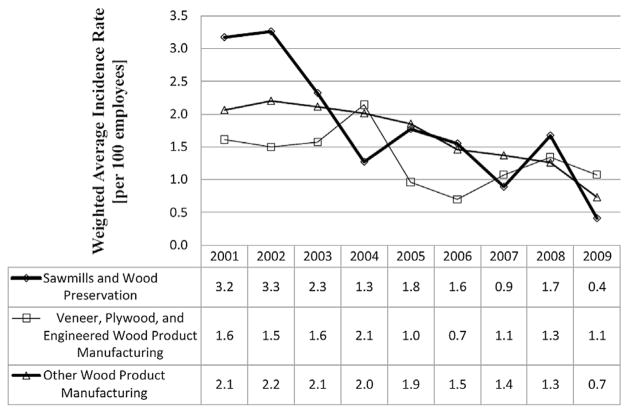
Figure 1 shows the trend in average incidence rate from 2001 to 2009 by sub-sector within wood product manufacturing. All sub-sectors demonstrated substantial reductions in annual incidence rates for all claims from 2001 to 2009. Comparing 2001 and 2009 data, several declines were found: the sawmills and wood preservation sub-sector injury rate decreased from 13.6 to 3.9 (71% reduction); the veneer, plywood, and engineered wood product manufacturing sub-sector decreased from 11.3 to 4.1 (64% reduction); and the other wood product manufacturing sub-sector decreased from 12.9 to 4.8 (63% reduction). Figure 2 displays the trend in annual lost-time incidence rates. Again, all sub-sectors showed substantial decreases in rates: the sawmills and wood preservation sub-sector decreased from 3.2 to 0.4 (87% reduction); the veneer, plywood, and engineered wood product manufacturing sub-sector decreased from 1.6 to 1.1 (34% reduction); and the other wood product manufacturing sub-sector decreased from 2.1 to 0.7 (65% reduction).
FIGURE 1.
Trend in annual incidence rates for all workers’ compensation claims (medical only and lost-time) in Ohio wood product manufacturing among all sub-sectors and employer sizes from 2001 to 2009.
FIGURE 2.
Trend in lost-time incidence rates for workers’ compensation claims in Ohio wood product manufacturing establishments among all sub-sectors and employer sizes from 2001 to 2009.
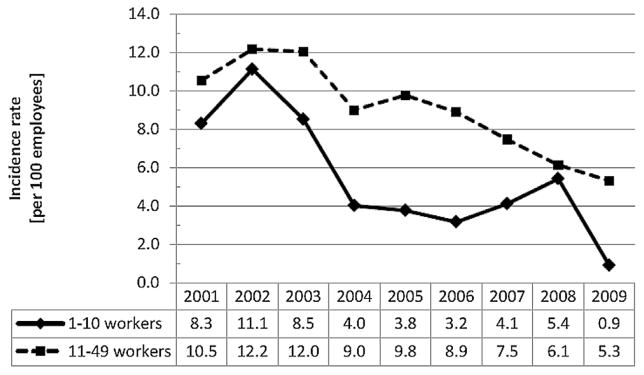
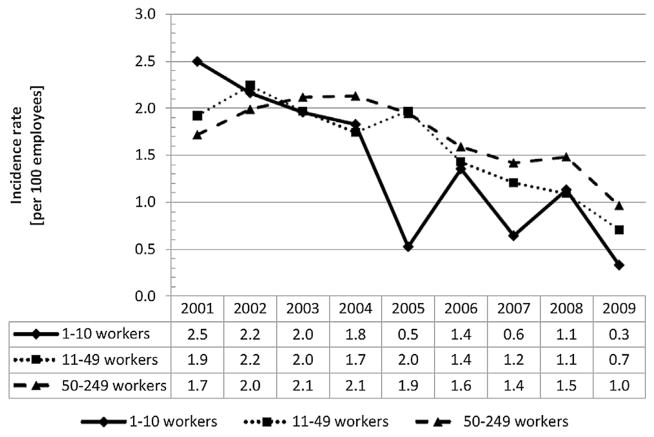
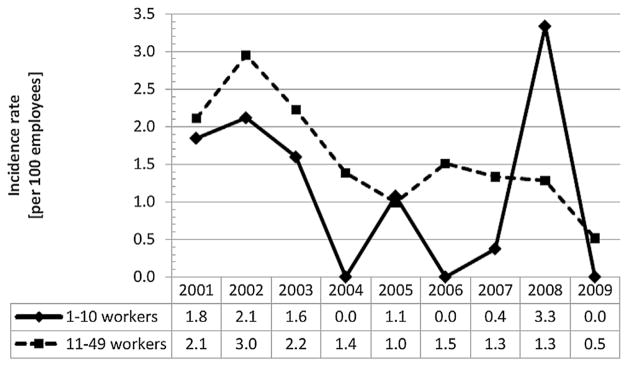
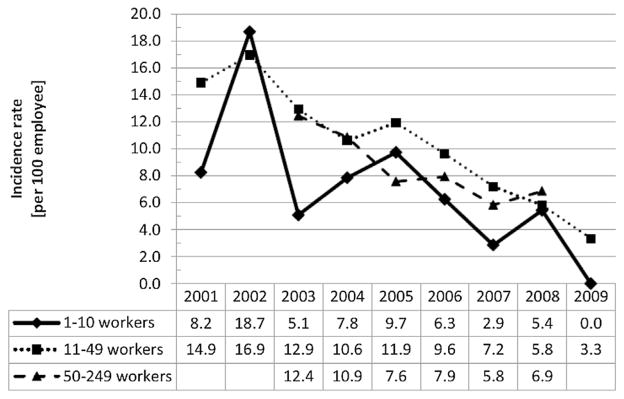
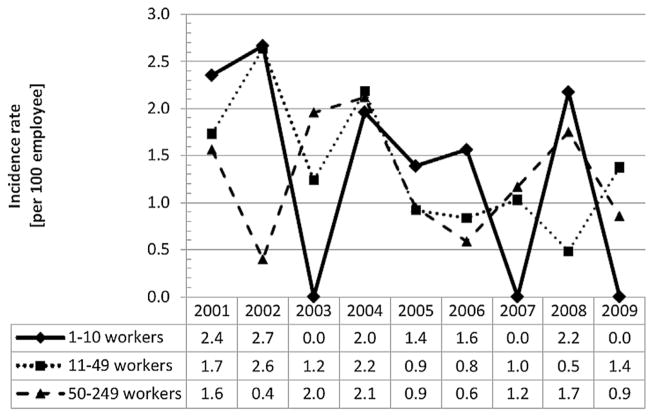
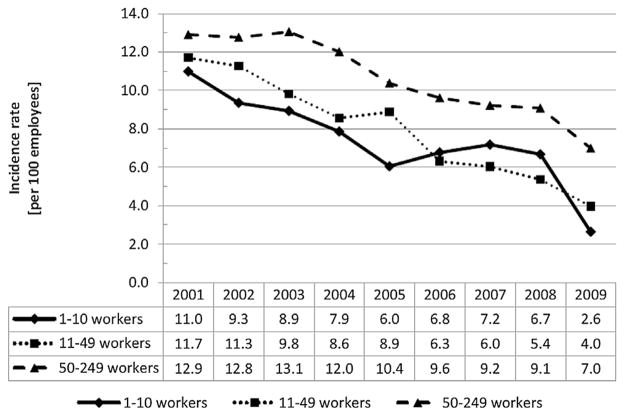
Annual injury incidence rates from 2001 to 2009 among each sub-sector and employer size are reported in Figures 3–8 by claim type. Figures have been grouped by sub-sector. Figures 3–4 show incidence rates for the “sawmills and wood preservation” sub-sector. Figures 5–6 show incidence rates for the “veneer, plywood, and engineered wood product manufacturing” sub-sector. Figures 7–8 show incidence rates for “other wood product manufacturing.” For some sub-sectors, there were not enough establishments within an employer size category (e.g., 50–249 employees) to report results.
FIGURE 3.
Incidence rate (medical+lost-time) by year and employer size for “sawmills and wood preservation” sub-sector.
FIGURE 8.
Incidence rate (lost-time) by year and employer size for “other wood product manufacturing” sub-sector.
FIGURE 4.
Incidence rate (lost-time) by year and employer size for “sawmills and wood preservation” sub-sector.
FIGURE 5.
Incidence rate (medical+lost-time) by year and employer size for “veneer, plywood, and engineered wood product manufacturing” sub-sector. (Note: Blank cells indicate that reporting threshold of >5 establishments was not met.)
FIGURE 6.
Incidence rate (lost-time) by year and employer size for “veneer, plywood, and engineered wood product manufacturing” sub-sector.
FIGURE 7.
Incidence rate (medical+lost-time) by year and employer size for “other wood product manufacturing” sub-sector.
Saw-Related Injuries
A total of 8,547 workers’ compensation claims were identified among single-location, OBWC-insured wood product manufacturing employers from 2001 to 2009. For all years combined, MSD claims totaled 19.7% (1,683) of the injuries, STF claims totaled 15.9% (1,356) of injuries, and OTH claims made up 64.4% (5,508) of injuries. Saw-related claims accounted for 14.7% (810) of all OTH claims. A detailed breakdown of OTH claims is available in Table A1 of Appendix A.
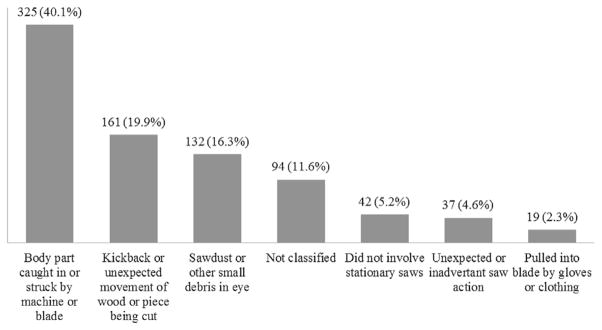
A frequency distribution of the causes of injury for the 810 identified saw-related cases, is presented in Figure 9. Cases categorized as “not classified” included situations where the injury was not saw-related, the incident text was truncated, the incident text was not sufficient to make appropriate inferences, or the injury event did not match with any of the derived causes of injury. Cases in the category “did not involve stationary saws” included equipment such as chain saws or portable circular saws.
FIGURE 9.
Frequency distribution of cause of injury/illness among saw-related workers’ compensation claims in Ohio wood product manufacturing from 2001 to 2009, n=810.
Injury Description
Table I displays the frequency distribution of all saw-related claims based on injury category description and cause. Cases that were coded as “not classified” in Figure 9 were removed from Table I data since many did not involve saws. The rows of Table I show the injury category description listed in descending order from top to bottom of the table. “Open wounds” was the most common injury category description for saw-related claims. Columns of the table show cause of injury and are listed in ascending order from left to right. “Body part caught in or struck by machine or blade” was the leading cause of injury overall.
TABLE I.
Distribution of Saw-Related Workers’ Compensation Claims Among Cause of Injury in Ohio Wood Product Manufacturing From 2001 to 2009, N=716
| Injury category description (ICD-9-CM code range) | Total Count, N=716a (% of total count) | Pulled into blade by gloves or clothing, (n=19) | Unexpected or inadvertent saw action, (n=37) | Did not involve stationary saw, (n=42) | Sawdust or other small debris in eye, (n=132) | Kickback or unexpected movement of wood or piece being cut, (n=161) | Body part caught in or struck by machine or blade, (n=325) |
|---|---|---|---|---|---|---|---|
| Open wounds (873–893) | 330 (46.0) | 12 (3.6)b | 21 (6.4) | 35 (10.6) | — | 51 (15.5) | 211 (63.9) |
| Fracture (802.4–825.2) | 109 (15.2) | 3 (2.8) | 6 (5.5) | — | — | 36 (33.0) | 64 (58.7) |
| Superficial injury (911–918.9) | 75 (10.5) | — | 3 (4.0) | 2 (2.7) | 62 (82.7) | 5 (6.7) | 3 (4.0) |
| Contusion (920–924.2) | 60 (8.4) | — | 3 (5.0) | 1 (1.7) | 1 (1.7) | 46 (76.7) | 9 (15.0) |
| Foreign body, eye (930–930.9) | 56 (7.8) | — | — | 1 (1.8) | 53 (94.6) | 2 (3.6) | — |
| Amputation (885–886.1) | 28 (3.9) | 3 (10.7) | 2 (7.1) | 1 (3.6) | — | 3 (10.7) | 19 (67.9) |
| Injury to nerves and spinal cord (955.2–955.6) | 17 (2.4) | — | — | — | — | 5 (29.4) | 12 (70.6) |
| Disease of nervous system and sense organs (337.29–388.7) | 15 (2.1) | — | — | — | 13 (86.7) | 2 (13.3) | — |
| Crushing Injury (927.2–928.3) | 10 (1.4) | 1 (10.0) | — | — | — | 4 (40.0) | 5 (50.0) |
| Sprains (840.8–847.2) | 8 (1.1) | — | — | 1 (12.5) | 1 (12.5) | 6 (75.0) | — |
Entries with a total count of ≤2 were omitted.
Percentage of row total.
Severity of Injury
This study used medical only or lost-time claims as a surrogate measure to describe injury severity. Lost-time claims were considered more severe due to job restrictions or days away from work. Table II displays the frequency distributions for medical only (i.e., those involving less than eight days away from work) and lost-time claims (i.e., those involving eight or more days away from work) within the three industry sub-sectors. Medical only claims accounted for over 80% of claims across all industry sub-sectors. Employers classified as “other wood product manufacturing” (NAICS 3219) constituted the highest percentage of saw-related claims and saw-related claims resulting in lost-time.
TABLE II.
Workers’ Compensation Claims From OBWC in Wood Product Manufacturing by Claim Type and Sub-Sector from 2001 to 2009, N=8,547
| Wood product manufacturing sub-sector (NAICS) Claims group |
All claims
|
Medical only claims
|
Lost-time claimsa
|
|||
|---|---|---|---|---|---|---|
| N | % | N | % | N | % | |
| Sawmills and wood preservation (3,211) | ||||||
| All claims | 1,299 | 100% | 1,086 | 83.6% | 213 | 16.4% |
| Saw-related claims within OTH | 99 | 100% | 83 | 83.8% | 16 | 16.2% |
| Veneer, plywood, and engineered wood product manufacturing (3,212) | ||||||
| All claims | 1,095 | 100% | 932 | 85.1% | 163 | 14.9% |
| Saw-related claims within OTH | 70 | 100% | 58 | 82.9% | 12 | 17.1% |
| Other wood product manufacturing (3,219) | ||||||
| All claims | 6,153 | 100% | 5,032 | 81.8% | 1,121 | 18.2% |
| Saw-related claims within OTH | 641 | 100% | 506 | 78.9% | 135 | 21.1% |
Eight or more days away from work.
Saw-related lost-time claims were further analyzed by injury category description frequency distribution, cause, and incidence rate trend. Table III displays the frequency distribution of saw-related lost-time claims by injury category description.
TABLE III.
Injury Nature of Saw-Related Claims Resulting in Lost-Time in OBWC-Insured Wood Product Manufacturing From 2001 to 2009, N =163
| Injury category description | ICD-9-CM code range | “Saw-related” frequency, N (%) |
|---|---|---|
| Fracture | 802.4–825.2 | 58 (35.8%) |
| Open wounds | 873–893 | 48 (29.6%) |
| Amputation | 885–886.1 | 24 (14.8%) |
| Injury to nerves and spinal cord | 955.2–955.6 | 16 (9.9%) |
| Contusion | 920–924.2 | 2 (1.2%) |
| Sprains | 840.8–847.2 | 2 (1.2%) |
| Superficial injury | 911–918.9 | 2 (1.2%) |
| Mental disorders | 296.22–309.28 | 2 (1.2%) |
| Cellulitis or abscess | 681.01–682.7 | 2 (1.2%) |
| Disease of nervous system and sense organs | 337.29–388.7 | 2 (1.2%) |
| Crushing injury | 927.2–928.3 | 1 (<1%) |
| Disc disorders | 722.1 | 1 (<1%) |
| Foreign body, eye | 930–930.9 | 1 (<1%) |
| Soft tissue/Enthesopathy | 726.32–727.05 | 1 (<1%) |
| Symptoms, signs, and Ill-defined conditions NEC | 785.4 | 1 (<1%) |
DISCUSSION/CONCLUSIONS
Figures 1 and 2 highlight substantial downward movement from 2001 to 2009 in incidence rates for all claims and lost-time in wood product manufacturing as reported to the OBWC. For comparison, we looked for similar trends using national data from the Bureau of Labor Statistics.5 In 2003, the wood product manufacturing sub-sector reported an incidence rate of 10.0 per 100 full-time equivalents (FTE) for total recordable cases [U.S. Bureau of Labor Statistics, 2004]. In 2011, this rate was 6.5 [U.S. Bureau of Labor Statistics, 2012]. This represents a reduction of 35%. [Note: 2003 was chosen rather than 2001 because the Bureau of Labor Statistics did not start classifying businesses using NAICS until that year]. A substantial downward trend was also found when examining incidence rates for all private industries, declining from 5.0 in 2003 to 3.5 in 2011(a reduction of 30%).
Some researchers have suggested that recent safety initiatives and innovations in safety controls may have contributed to the decline in overall injury incidence [Davis and Crotts, 2010], but other factors may be contributing as well. Several studies have demonstrated that workers’ compensation claim rates decrease when unemployment rates increase. A recent study [Moore and Tompa, 2011] discussed several possible reasons, including that under reporting may increase during times of high employment because employees are afraid of losing their jobs. Another reason is that more experienced employees (that tend to have fewer injuries) are retained when unemployment is high. Additionally, the data could be influenced if work is shifting away from full-time workers and towards temporary workers as workers’ compensation claims of temporary workers would not appear in wood product manufacturing, but rather under the temporary agency where the worker is employed. As well, when unemployment is low, the pace of production increases and this again may drive workers’ compensation rates higher [Moore and Tompa, 2011].
In general, OBWC data indicate an increasing incidence rate with increasing employer size as measured by number of employees (Figs. 3–8). National data indicate a similar trend. For 2011, the incidence rate for total recordable cases was 4.2/100 full-time employee for employers with 50–249 employees [U.S. Bureau of Labor Statistics, 2012]. The rate was 3.2 for employers with 11–49 employees, and the rate was 1.8 for employers with 1–10 employees.
Among saw-related OBWC claims, the leading cause for injury/illness as described in Figure 9 is “body part caught in or struck by machine or blade.” For risk reduction efforts regarding stationary saw work, safety professionals know to concentrate on injuries involving the saw blade. However, data from this study also point to the need to consider the product being cut by the saw. “Kickback or unexpected movement of the wood or piece being cut” was the cause for nearly one in five saw-related claims. Future safety engineering efforts could focus on techniques to secure the piece being cut while keeping the hands away from the blade. Checklists or risk assessment forms for stationary sawing machinery should include discussion of push sticks and feather boards to guide and secure work pieces. Additionally, workers must be protected from sawdust or other small debris in the eye as indicated by the high frequency of these events in Table I.
The OBWC database provides a resource for occupational surveillance to analyze injuries/illnesses and associated causes. One limitation to the existing OBWC workers’ compensation database is the lack of ICD-9-CM external cause codes (E-codes) through 2010. The claims recorded in the OBWC database included the injury description (ICD-9-CM description code) and beginning in 2007 the database included an OBWC-developed causation field for lost-time claims. However, detailed ICD-9-CM E-codes were not implemented until 2011 for all claims and were not part of the data analyzed. This paper was not intended to be an exhaustive analysis by diagnoses types, but rather focused on causations and the optimal return to work code diagnoses for a given claim. Approximately 33% of claims in this analysis had multiple diagnoses, and counts for a particular diagnosis would be higher if multiple diagnoses are considered. For example, there were a total of 140 amputations in this sample if secondary diagnoses are included. While it is valuable to know the description of injuries/illnesses that occur within a workplace, it is also important to recognize the cause of these injuries/illnesses to develop injury prevention equipment, policies, and programs.
Data from this report are beneficial in performing risk assessments for wood product manufacturing employers using stationary sawing machinery. Safety initiatives such as machine guarding and ergonomic changes can originate from injury claims analyses that identify the types and common causes of injury. Additional examination of injury rates with regard to machine type, task, and operations would also be beneficial. Combining the details of cause of injury and the specific type of equipment or machine involved would support focused activity on improved guarding and other risk reduction methods.
IMPACT ON INDUSTRY
Identifying risks associated with sustaining an injury not only provides evidence to employers that safety initiatives must be maintained and improved, but it also indicates appropriate types of safety interventions. In addition to emphasizing workplace safety, this report demonstrates the value of reporting systems (such as a claims database) to identify hazards to guide risk assessments. Using empirical data provides appropriate justification for a safety intervention and prioritizes risk mitigation efforts. With specific attention to wood product manufacturing, this analysis can be used as a preliminary source for evidence-based risk reduction efforts.
Acknowledgments
We appreciate the statistical support and expertise provided by Scott Hendricks of NIOSH. No funding external to NIOSH was used for this project.
APPENDIX A
NAICS Descriptions
Table AI.
Description of “Other” (OTH) Cases Defined by OIICS Description Within Wood Product Manufacturing in Ohio from January 1, 2001 Through December 31, 2009, n =5,508.
| 2- Digit OIICS code | OIICS description |
|---|---|
| 10 | VIOLENCE OR OTHER INJURIES BY PERSONS OR ANIMALS, UNSPECIFIED |
| 11 | INTENTIONAL INJURIES BY PERSON |
| 12 | UNINTENTIONAL OR INTENT UNKNOWN INJURIES BY PERSON |
| 13 | ANIMAL OR INSECT RELATED INCIDENTS |
| 20 | TRANSPORTATION INCIDENT, UNSPECIFIED |
| 21 | AIRCRAFT INCIDENT |
| 22 | RAIL VEHICLE INCIDENT |
| 23 | ANIMAL AND OTHER NON-MOTORIZED VEHICAL TRANSPORTATION INCIDENTS |
| 24 | PEDESTRIAN VEHICULAR INCIDENTS |
| 25 | WATER VEHICLE INCIDENTS |
| 26 | ROADWAY INCIDENTS, MOTORIZED LAND VEHICLES |
| 27 | NON-ROADWAY INCIDENTS, MOTORIZED LAND VEHICLES |
| 29 | TRANSPORTATION INCIDENT, NEC |
| 30 | FIRES AND EXPLOSIONS, UNSPECIFIED |
| 31 | FIRES |
| 32 | EXPLOSIONS |
| 50 | EXPOSURE TO HARMFUL SUBSTANCES OR ENVIRONMENTS, UNSPECIFIED |
| 51 | EXPOSURE TO ELECTRICITY |
| 52 | EXPOSURE, RADIATION AND NOISE |
| 53 | EXPOSURE TO TEMPERATURE EXTREMES |
| 54 | EXPOSURE TO AIR AND WATER PRESSURE CHANGES |
| 55 | EXPOSURE TO OTHER HARMFUL SUBSTANCES |
| 56 | EXPOSURE TO OXYGEN DEFICIENCY |
| 57 | EXPOSURE TO TRAUMATIC OR STRESSFUL EVENT |
| 59 | EXPOSURE TO HARMFUL SUBSTANCES OR ENVIRONMENTS, NEC |
| 60 | CONTACT WITH OBJECTS AND EQUIPMENT, UNSPECIFIED |
| 61 | NEEDLESTICK WITHOUT EXPOSURE TO HARMFUL SUBSTANCE |
| 62 | STRUCK BY OBJECTS OR EQUIPMENT |
| 63 | STRUCK AGAINST OBJECT OR EQUIPMENT |
| 64 | CAUGHT IN OR COMPRESSED BY EQUIPMENT OR OBJECTS |
| 65 | STRUCK, CAUGHT, OR CRUSHED IN COLLAPSING STRUCTURES, EQUIPMENT OR |
| MATERIALS | |
| 69 | CONTACT WITH OBJECTS AND EQUIPMENT, NEC |
| 73 | OTHER EXERTIONS OR BODILY REACTIONS (Note: Some cases coded “73” are MSD cases) |
Workers’ Compensation Claims were described as “OTH” based upon these descriptions within the ACCIDENT_TEXT of the injury claim in the OBWC database.
OIICS=The BLS Occupational Injury and Illness Classification System.
| 321 Wood Product Manufacturing |
| 3211 Sawmills and Wood Preservation |
| 32111 Sawmills and Wood Preservation |
| 321113 Sawmills |
| 321114 Wood Preservation |
| 3212 Veneer, Plywood, and Engineered Wood Product Manufacturing |
| 32121 Veneer, Plywood, and Engineered Wood Product Manufacturing |
| 321211 Hardwood Veneer and Plywood Manufacturing |
| 321212 Softwood Veneer and Plywood Manufacturing |
| 321213 Engineered Wood Member (except Truss) Manufacturing |
| 321214 Truss Manufacturing |
| 321219 Reconstituted Wood Product Manufacturing |
| 3219 Other Wood Product Manufacturing |
| 32191 Millwork |
| 321911 Wood Window and Door Manufacturing |
| 321912 Cut Stock, Resawing Lumber, and Planing |
| 321918 Other Millwork (including Flooring) |
| 32192 Wood Container and Pallet Manufacturing |
| 321920 Wood Container and Pallet Manufacturing |
| 32199 All Other Wood Product Manufacturing |
| 321991 Manufactured Home (Mobile Home) Manufacturing |
| 321992 Prefabricated Wood Building Manufacturing |
| 321999 All Other Miscellaneous Wood Product Manufacturing |
APPENDIX B
There are many differences between OBWC and BLS rates that should be noted:
Cases in the BLS survey results are recordable cases from OSHA logs and describe injuries/illnesses for employers nationally of all sizes with one or more locations. OBWC cases are workers’ compensation claims and describe injuries/illnesses for small, single-location employers OBWC-insured employers.
BLS is based on the Survey of Occupational Injuries and Illnesses (SOII), and is a sample of injuries/illness from employers nationally. OBWC is not a sample, but rather claims from all OBWC-insured employers with 3 to 499 employees in the state of Ohio.
The BLS case definition for lost-time is that the injured employees missed at least one day of work. In contrast, OBWC defines lost-time cases to be those where employees missed eight or more days of work.
The numerator used in BLS rates is the number of injuries/illnesses that occurred to people working for that employer, including those affecting temporary employees. For OBWC, injuries/illnesses for temporary employees are listed under the temporary agency employer, not the employer where that person was working at the time of injury/illness.
The denominator used in the BLS rates is the number of reported person-hours (part and full-time employees) by the employer as part of the SOII for that year. These person-hours are used to estimate the number of full time equivalents by dividing total hours by 2,000. The denominator used in calculation of OBWC rates for this study is the total number of employees (both part and full time) reported by the employer as part of the QCEW. This is not the same as the number of full time equivalents. A basic problem with the QCEW based rates is that they are not comparable across sectors and industries that have different ratios of part to full time employees. Since this entire analysis is within 3–4 digit NAICS codes, the comparison is really within industries and the QCEW rates are more suitable for this purpose.
Footnotes
Specifically, an MSD was a case where (i) the nature of the injury/illness includes sprains, strains, tears; back pain, hurt back; soreness, pain, hurt, except the back; carpal tunnel syndrome; hernia; or musculoskeletal system and connective tissue diseases and disorders; and (ii) with few exceptions, the event or exposure leading to the injury or illness was bodily reaction (bending, climbing, crawling, reaching, twisting); overexertion; repetition; rubbed or abraded by friction or pressure (contact stress); rubbed or abraded by friction or vibration. This MSD case definition excludes events or exposures due to a single episode of overexertion/bodily reaction due to climbing down, stepping down, walking or running without other incident (missteps). The reason for excluding these events from the MSD case definition was because they all pertain to the interaction of the foot with the supporting surface, and may be prevented in a similar manner as slip, trip or fall events.
The OIICS event or exposure codes for STF claims in this study include the following: (i) 4*-falls, slips, trips; (ii) some 5221-stepped on object or into hole; (iii) 7313-climbing or stepping down-single episode; (iii) 7351-walking, without other incident-single episode (loss of balance or missteps only); (iv) 7361-running, without other incident-single episode (loss of balance or missteps only); and (v) 7371-boarding, alighting-excluding slips, trips, falls (including missteps)-single episode only.
There are 57 possible injury categories, and injury claims were categorized by one the following descriptions: amputation; burn; cellulitis or abscess; contusion; crushing injury; disc disorders; disease of nervous system and sense organs; disease of respiratory system; foreign body, eye; fractures, injury to nerves and spinal cord; open wounds; poisoning and toxic effects; soft tissue/enthesopathy; sprains; superficial injury; symptoms, signs, and ill-defined conditions, other mental disorders; and other and unspecified effects of cause.
Incidence rate=number of total injuries×100 employees/ total number of annual employees.
There are many differences between the OBWC and the Bureau of Labor Statistics, so we must be cognizant of these differences when comparing rates between the two data systems. Differences between the OBWC and the Bureau of Labor Statistics data systems are highlighted in Appendix B.
The findings and conclusions in this report are those of the authors and do not necessarily represent the views of the National Institute for Occupational Safety and Health.
References
- Aaltonen MVP. Occupational injuries in the Finnish furniture industry. Scand J Work Environ Health. 1996;22:197–203. doi: 10.5271/sjweh.131. [DOI] [PubMed] [Google Scholar]
- Anderson NJ, Bonauto DK, Adams D. Work-related amputations in Washington State, 1997–2005. Am J Ind Med. 2010;53:693–705. doi: 10.1002/Ajim.20815. [DOI] [PubMed] [Google Scholar]
- Bertke SJ, Meyers AR, Wurzelbacher SJ, Bell J, Lampl ML, Robins D. Development and evaluation of a Naïve Bayesian model for coding causation of workers’ compensations claims. J Safety Res. 2012;43:327–332. doi: 10.1016/j.jsr.2012.10.012. [DOI] [PMC free article] [PubMed] [Google Scholar]
- Champoux D, Brun JP. Occupational health and safety management in small size enterprises: An overview of the situation and avenues for intervention and research. Safety Sci. 2003;41:301–318. PiiS0925-7535(02)00043-7. [Google Scholar]
- Cheng YH. Explaining disablement in modern times: Hand-injured workers’ accounts of their injuries in Hong Kong. Soc Sci Med. 1997;45:739–750. doi: 10.1016/S0277-9536(96)00410-8. [DOI] [PubMed] [Google Scholar]
- Davis J, Crotts M. National council on compensation insurance research brief. Workers compensation claim frequency continues to decline in 2009. 2010 Retrieved on April 30, 2014 from http://www.ncci.com/Documents/research-claims-frequency-sept-2010.pdf.
- Frank M, Lange J, Napp M, Hecht J, Ekkernkamp A, Hinz P. Accidental circular saw hand injuries: Trauma mechanisms, injury patterns, and accident insurance. Forensic Sci Int. 2010;198:74–78. doi: 10.1016/j.forsciint.2010.01.003. [DOI] [PubMed] [Google Scholar]
- Harner LM. Standard morbidity ratios for work-related amputations and fractures by occupation, 1979–1981. J Safety Res. 1988;19:103–113. doi: 10.1016/0022-4375(88)90001-1. [DOI] [Google Scholar]
- Holcroft CA, Punnett L. Work environment risk factors for injuries in wood processing. J Safety Res. 2009;40:247–255. doi: 10.1016/j.jsr.2009.05.001. [DOI] [PMC free article] [PubMed] [Google Scholar]
- Marcy N, Rutherford G, Mills A. Power tools and workshop equipment. U.S. Consumer Product Safety Commission; 2003. Retrieved July 9, 2014 from https://www.cpsc.gov/PageFiles/106093/2003h054.pdf. [Google Scholar]
- McCall BP, Horwitz IB. An assessment and quantification of the rates, costs, and risk factors of occupational amputations: Analysis of Kentucky workers’ compensation claims, 1994–2003. Am J Ind Med. 2006;49:1031–1038. doi: 10.1002/ajim.20390. [DOI] [PubMed] [Google Scholar]
- Moore IC, Tompa E. Understanding changes over time in workers’ compensation claim rates using time series analytical techniques. Occup Environ Med. 2011;68:837–841. doi: 10.1136/oem.2010.055913. [DOI] [PubMed] [Google Scholar]
- Reinert D, Schwaneberg O, Jung N, Ullmann S, Olbert W, Kamin D, Kohler R. Finger and hand protection on circular table and panel saws. Safety Sci. 2009;47:1175–1184. doi: 10.1016/j.ssci.2009.01.003. [DOI] [Google Scholar]
- U.S. Bureau of Labor Statistics, U. S. Department of Labor. Workplace injuries and illnesses in 2003. 2004 Retrieved April 26, 2013 from http://www.bls.gov/iif/oshwc/osh/os/osnr0021.pdf.
- U.S. Bureau of Labor Statistics. U.S. Department of Labor. Table R27–Number of nonfatal occupational injuries and illnesses involving days away from work by source of injury or illness and selected events or exposures leading to injury or illness, private industry, 2010. 2011 Retrieved October 3, 2012 from www.bls.gov/iif/oshwc/osh/case/ostb2851.pdf.
- U.S. Bureau of Labor Statistics. U.S. Department of Labor. Workplace injuries and illnesses summary –2011 (USDL-12-2121) 2012 Retrieved October 25, 2012 from http://www.bls.gov/news.release/pdf/osh.pdf.
- U.S. Bureau of Labor Statistics. U.S. Department of Labor. Nonfatal cases involving days away from work: Selected characteristics (2003–2010) Washington, DC: U.S. Department of Labor, Bureau of Labor Statistics, Safety and Health Statistics Program; 2013. Injuries, illnesses, and fatalities. IIF databases, discontinued data series, multi-screen data search. Custom tabulation. Retrieved October 24, 2013 from http://www.bls.gov/iif/data.htm. [Google Scholar]
- U.S. Census Bureau. North American industry classification system. 2011 Retrieved November 16, 2012 from http://www.census.gov/cgi-bin/sssd/naics/naicsrch.
- U.S. Department of Labor. Wood products industry. 2008 Retrieved April 25, 2013 from http://www.osha.gov/SLTC/woodproducts/index.html.


