

Abstract
The spontaneous wrapping of nanoparticles by membranes is of increasing interest as nanoparticles become more prevalent in consumer products and hence more likely to enter the human body. We introduce a simulations-based tool that can be used to visualize the molecular level interaction between nanoparticles and bilayer membranes. By combining LIME, an intermediate resolution, implicit solvent model for phospholipids, with discontinuous molecular dynamics (DMD), we are able to simulate the wrapping or embedding of nanoparticles by 1,2-dipalmitoyl-sn-glycero-3-phosphocholine (DPPC) bilayer membranes. Simulations of hydrophilic nanoparticles with diameters from 10Å to 250Å show that hydrophilic nanoparticles with diameters greater than 20Å become wrapped while the nanoparticle with a diameter of 10Å does not . Instead this smaller particle became embedded in the bilayer surface where it could interact with the hydrophilic head groups of the lipid molecules. We also investigate the interaction between a DPPC bilayer and hydrophobic nanoparticles with diameters 10Å to 40Å. These nanoparticles do not undergo the wrapping process; instead they directly penetrate the membrane and embed themselves within the inner hydrophobic core of the bilayers.
Introduction
In this work, we consider the interaction between nanoparticles and biomembranes and the attendant wrapping or penetration that follows from this interaction. Motivation for this study comes from the increasing prevalence of nanoparticles in our everyday lives, the use of nanoparticles to deliver drugs, proteins, and antimicrobials into cells, and concerns about nanoparticle toxicity. For a nanoparticle to be wrapped by, or penetrate through, a cell membrane, specific (ligand-receptor) and nonspecific (surface charge, hydrophobicity, size and shape) binding interactions must overcome the resistive forces associated with membrane stretching and elasticity.[1]. Wrapping can be described as the process by which a membrane bends its structure in order to maximize the number of interactions it has with a nanoparticle. During wrapping the lipid head groups of a membrane form a vesicle around the nanoparticle. This is different than embedding, the process by which a nanoparticle penetrates into a membrane with minimal disruption to the structure. Experimental studies have been performed to investigate the role that both specific and nonspecific interactions play in the cellular uptake of nanoparticles [1,2,3,4,5,6], however, the complexity and diversity of nanoparticle types that currently exist make it very difficult to completely explore the behavior of all nanoparticle/membrane systems. Computer simulation is a tool that could be used to aid this effort by allowing visualization of the molecular motions that contribute to both the wrapping and direct penetration processes that occur at nanoparticle/membrane interfaces.
Our goal has been to develop a computational model that provides molecular-level insights into, and facilitates the exploration of, the interaction between biomembranes and nanoparticles with different geometric and energetic properties. In this paper we demonstrate how the combination of discontinuous molecular dynamics simulations (DMD) and our previously-developed LIME forcefield [7] can be used to model the interaction between lipid membranes and nanoparticles of different sizes and hydrophobicities. We show that LIME/DMD simulations can be used to study the wrapping of hydrophilic nanoparticles of size range 10-250 Å by a lipid membrane and the mechanism by which a hydrophobic nanoparticle penetrates the inner core of a bilayer.
The novelty of our DMD/LIME simulation tool for lipid/nanoparticle systems lies in the fact that it is both extremely fast and highly specific. Similar models that are currently available for modeling nanoparticle/biomembrane systems with speeds that can potentially match the speed of our code use very simplistic, generic parameters for their coarse-grained sites. In contrast we have the ability to extract very specific and well-tested parameters from atomistic simulations and then to use these parameters to simulate any species of interest.
A number of experimental studies have been conducted to examine the interaction between nanoparticles and bilayer membranes. Chithrani et al. investigated the intracellular uptake by mammalian HeLa cells of gold nanoparticles with different sizes and shapes. Rod-shaped nanoparticles with dimensions of 40×14nm and 74×14nm and spherical nanoparticles with diameters of 14, 30, 50, 74 and 100 nm were studied. The cells were incubated with the gold nanoparticles for 6 hours. Subsequently, the concentration of Au that had accumulated in the cells was measured. The cellular uptake of spherical nanoparticles exhibited a maximum as a function of nanoparticle size; it was larger for particles with diameters of 30nm and 50nm and smaller for particles with diameters of 14nm, 74nm and 100nm. Cellular uptake for rod-shaped particles was lower than that for spherical particles. The authors speculated that the difference in the uptake between the various sizes and shapes of nanoparticles could be due to surface curvature and the amount and type of proteins absorbed onto the nanoparticle surface.[2].
Bihan et al. conducted experiments to study how the size of silica nanoparticles affects the engulfing process by DOPC liposomes.[3]. According to their results, silica nanoparticles with diameters of 30, 65 and 190 nm were engulfed by the liposomes, while those with diameters of approximately 15-20 nm remained bound to the outer surface of the liposome. The authors explain that although the 15-20 nm nanoparticles interacted with the DOPC lipid membrane in the same way as the larger nanoparticles, the adhesive strength was not sufficient to induce a curvature of the lipid membrane and to subsequently trigger the engulfing process.[3]
Win and Feng investigated the effect of particle size and surface coating on the cellular uptake of polymeric nanoparticles intended for the oral delivery of anticancer drugs. The authors evaluated the cellular uptake of 50nm, 100nm, 200nm 500nm and 1000nm polystyrene nanoparticles by Caco-cells. The 100nm and 200nm nanoparticles had the best cellular uptake, whereas the 50nm nanoparticles had the smallest cellular uptake. The cellular uptake of polystyrene (PS) nanoparticles and poly(lactic-co-glycolic acid) (PLGA) nanoparticles coated with polyvinyl alcohol (PVA) or vitamin E TPGS was also measured [4]. In another study, Verma and co-workers compared the cell-membrane penetration achieved by two nanoparticles that differed in the arrangement of surface hydrophilic and hydrophobic groups but had the same size, shape and ratio of hydrophobic to hydrophilic molecules.[5].
An alternative albeit indirect way to quantify cellular uptake of different types of nanoparticles is to measure the cytotoxicity that can accompany this process. For example, Pan et al studied the cytotoxicity of gold nanoparticles with diameters ranging in size from 0.8nm to 15nm in four cell lines.[6]. They also tested the toxicity of very small (diameter <0.8nm) gold particles (gold thiomalate). They found that nanoparticles with diameters in the size range from 1 – 2nm were more toxic to all four of the cell lines tested than the very small gold nanoparticles (gold thiomalte) or the larger 15nm particles. The authors speculate that the nanoparticle toxicity was a result of endocytosis, however, their experimental methods did not allow them to determine an exact cause of cell death.[6].
Note that we cannot draw direct comparisons between our work and the experimental studies cited here because many of the nanoparticles described in these papers are much larger (50-1000nm) than those that we simulated (1-25nm). (It was difficult to find experimental results for smaller nanoparticles.) One might expect that the difference in curvature would have a significant qualitative effect. Nevertheless, we felt the experimental studies were important to include because they demonstrate that larger nanoparticles are more likely to be wrapped by membranes than much smaller nanoparticles. This is the same trend that we observed.
In addition to the experimental work that has been performed to examine nanoparticles and membranes, various approaches to modeling the interaction between nanoparticles and membranes with simulations have been described in the literature.[9,10,11,12,13,14,15,16]. The levels of detail used to represent the molecules in these models fall roughly in two main categories: high-resolution and low-resolution. High-resolution or atomistic models represent the geometry and energetics of all molecules realistically and typically account for the motion of every atom including every solvent atom. Atomistic simulations were used by Bedrov et al. to investigate the interaction and passive transport of C60 fullerenes into lipid membranes composed of di-myristoyl-phosphatidylcholine (DMPC).[11] The system contained a DMPC bilayer composed of 52 lipid molecules and 1800 water molecules. The Lucretius molecular dynamics simulation package [11] was used along with the lipid force field parameters from CHARMM27.[17]. The free energy and the diffusivity of the fullerene were obtained as a function of its position within the membrane; these properties were used to calculate the membrane permeability.[11].
Coarse-grained models of lipid and nanoparticle systems are low-resolution models that are based on a simplified representation of molecular geometry and energetics. In a coarse-grained model a single interaction site is used to represent a group of several atoms. This reduces the total number of sites whose trajectories must be calculated, thereby increasing the speed of the simulation. One example of a low-resolution model used to describe nanoparticle membrane interactions is that developed by Vacha et al. to study the passive endocytosis of ligand-coated nanoparticles of different sizes, shapes, coverage and membrane-binding strength.[12]. For this work the authors used the implicit-solvent model for phospholipid membranes developed by Cooke and Deserno.[13]. In this model, three spheres are used to represent each phospholipid molecule: a hydrophilic sphere to represent the phospholipid headgroup and two hydrophobic spheres to represent the two phospholipid tails. The nanoparticles are composed of several spheres that are the same size as the hydrophilic headgroup sphere, most of which are hydrophilic. All simulations were performed using the ESPRESSO molecular dynamics package.[14]. Vacha et al. demonstrated that larger spherical particles experienced endocytosis more easily than smaller particles. The authors explain that this observation is a result of the more favorable compromise between bending rigidity and surface adhesive energy for the larger nanoparticles than for the smaller particles. The results also show that it is easier for spherocylindrical particles to undergo endocytosis than spherical particles. [12].
Dissipative particle dynamics (DPD) simulations were performed by Ding and Ma to study and design nanoparticles that could spontaneously transport themselves across membranes.[15] In each simulation hydrophobic ligands were attached to the surface of a hydrophilic nanoparticle with dynamic bonds allowing each nanoparticle to spontaneously insert into the membrane. Once the nanoparticle was inserted in the membrane the bonds attaching the hydrophobic ligands to the surface of the nanoparticle broke and the hydrophilic nanoparticle then exited the hydrophobic portion of the membrane.[15] In other work by Ding and Ma, DPD simulations were used to study how the chemical and physical properties of coating ligands affect the interaction between nanoparticles and cells.[Their results showed that the longer the coating ligands attached to the surface of nanoparticles, the more likely the nanoparticles were to attach to the membrane and the less likely the nanoparticles were to be engulfed by the membrane.[16]
An example of the use of a coarse-grained model to determine how a nanoparticle’s size affects its translocation across a lipid bilayer is work by Lin et al.[18]. The nanoparticles in these explicit solvent simulations were hydrophobic and ranged in size from 1.284 nm to 2.912 nm.; the lipid chosen for study was DPPC. All simulations were run using GROMACS 3.3.3 [19] with the MARTINI force field developed by Marrink et al.[20,21]. Results showed that the time required for a nanoparticle to translocate to different positions in a DPPC bilayer (composed of 512 lipids) decreased with the size of the nanoparticle.[18]. Yang and Ma also used coarse-grained computer simulations based on DPD to simulate the translocation of nanoparticles with different shapes across a lipid bilayer.[22]. The lipid molecules, which contained two hydrophilic head spheres and five hydrophobic tail spheres, were constructed by arranging hydrophilic DPD spheres in the desired geometrical shape. The nanoparticles studied had a variety of geometries. The simulations predicted the translocation of nanoparticles through the lipid membrane but not the endocytosis of the nanoparticles by the membrane. The authors concluded that the nanoparticle shape and initial orientation significantly affect the interaction between the nanoparticle and the lipid bilayer.
In this paper, we use an implicit-solvent intermediate-resolution model for lipid molecules, which we call “LIME,” with discontinuous molecular dynamics (DMD), a fast alternative to traditional molecular dynamics simulation, to model the interaction between both hydrophilic and hydrophobic nanoparticles and DPPC bilayer membranes. The LIME geometric and energetic parameters for the DPPC lipids were obtained using a multiscale modeling approach as described in our previous paper.[7]. In multiscale modeling atoms are grouped into coarse-grained sites and the geometric and energetic parameters for these coarse-grained sites are extracted from atomistic simulations in explicit solvent. The nanoparticle is modeled as a single sphere, essentially a generic nanoparticle, rather than as a cluster of spheres as other investigators have done. This is in keeping with our vision of this work as “proof of method” simulation, which could eventually evolve into examinations of more specific nanoparticle-membrane systems. Two types of nanoparticles are examined, hydrophilic and hydrophobic. The hydrophilic nanoparticles have square-well interactions with hydrophilic lipid sites and the hydrophobic nanoparticles have square-well interactions with hydrophobic lipid sites in our model. We investigate the extent to which hydrophilic nanoparticles with diameters from 10-250 Å are wrapped by a DPPC membrane and the extent to which hydrophobic nanoparticles with diameters from 10-40 Å penetrate the membrane. The largest hydrophobic nanoparticles that we chose to study had a diameter of 40 Å so that they could still fit within the hydrophobic portion of the DPPC bilayer.
Highlights of our results include the following. Our model demonstrates the major role that nanoparticle size plays in the membrane wrapping process. We find that the hydrophilic nanoparticle with 10Å diameter is not wrapped by the bilayer; instead it becomes embedded in the bilayer’s surface where they it can interact with the hydrophilic head groups of the lipid molecules. Hydrophilic nanoparticles with diameters between 20Å and 250Å do undergo the wrapping process with the bilayer membrane. Hydrophobic nanoparticles with diameters of 10Å, 20Å. 30Å and 40Å do not undergo the wrapping process; instead they directly penetrate the membrane and remain within the inner hydrophobic core of the bilayers. These findings are consistent with experimental results. Our results also showed that the rate of wrapping decreases with an increase in nanoparticle size for hydrophilic nanoparticles.
Methods and Model
To simulate the DPPC molecules in this work, LIME, an intermediate resolution implicit-solvent model for lipid molecules [7] developed for use with discontinuous molecular dynamics was employed. In LIME each DPPC molecule is represented by 14 coarse-grained sites and each coarse-grained site is classified as one of six unique coarse-grained types (I-VI). A detailed description of the coarse-grained parameters used to describe each DPPC molecule is provided in our previous work.[7]. Figure 2 illustrates the coarse-grained representation of: (a) a DPPC molecule and (b) a nanoparticle. Types I and II represent the choline entity and the phosphate group, respectively. Types III and IV are assigned to ester coarse-grained sites 3 and 9, respectively. Type V is used to represent the coarse-grained sites in the hydrocarbon tails (excluding the terminal sites). Finally, type VI is used to classify the terminal tail coarse-grained sites. Each nanoparticle in our simulations is represented by one single coarse-grained site and is assigned the coarse-grained type VII.
Figure 2.

Snapshots of final configurations for simulations run on systems containing hydrophilic nanoparticles of different sizes and a DPPC bilayer membrane. Run 1 (a), 2 (b), 3 (c), 4 (d), 5 (e), 6 (f). The color scheme is: purple (DPPC choline entity), orange (DPPC phosphate group), red (DPPC ester groups), cyan (DPPC alkyl tail groups), red (nanoparticles).
The discontinuous molecular dynamics (DMD) algorithm, a very fast alternative to traditional molecular dynamics simulation, is the simulation method used for this work.[23,24]. In DMD simulations, particles interact via a combination of hard-sphere and square well-potentials which means that the forces on particles need only be calculated when discontinuities in the potential are encountered. This allows for faster simulations than traditional molecular dynamics, enabling examination of larger systems and longer time scales. A hard sphere is an impenetrable, solid sphere; a square-well is a hard sphere surrounded by an attractive well. The square well (SW) potential between spheres i and j is given by:
| Equation 1 |
where r is the distance between spheres, σij is the hard sphere diameters, σλij is the well diameter and εij is the well depth. In our DMD simulations, the initial velocities assigned to coarse-grained sites are based on a Maxwell-Boltzmann distribution about the desired simulation temperature. The particle trajectories are then followed by calculating the time between each collision and advancing the simulation to the next event. Types of events include a collision between two hard spheres, a bond event when the distance between two bonded spheres reaches a minimum or maximum limit, and square well events when two spheres enter (capture), unsuccessfully attempt to escape (bounce) or successfully leave (dissociation) a square well.[23,24,25,26].
In all LIME/DMD simulations the simulation temperature is expressed in terms of the reduced temperature :
| Equation 2 |
where kB is Boltzmann’s constant, T is the temperature, and ε* is a reference interaction strength, which is the same as the reference interaction strength, ε* = 0.0363 that was used previously for our simulations of DPPC lipids at 325K.[7]. Thus when T* = kBT/ε* = (8.6173×10⁻⁵eV/K)*(325K)/(0.0363eV) = 0.77 in our DMD/LIME simulations, the lipid molecules will behave as they would at a real temperature of 325K. A detailed description of the procedure used to calculate this value is provided in our previous work.[7]. Throughout all simulations the temperature is maintained constant using the Andersen thermostat, which uses ghost collisions with randomly selected particles in the system to maintain the Maxwell-Boltzmann velocity distribution about the desired temperature.[28]
The LIME σij, σλij, and εij coarse-grained parameters for DPPC molecules were obtained using a multiscale modeling technique. In this procedure coarse-grained parameters are extracted from data collected from atomistic simulations. Data used to calculate the DPPC parameters were obtained by running united-atom explicit-solvent simulations at T=325K of 30 DPPC lipids using the GROMACS simulation package [29,30] version 4.5.4 along with the GROMOS96 53a6 forcefield.[31]. Complete details of the multiscale modeling procedure used to calculate the LIME DPPC parameters and the values of the σij, σλij, and εij parameters for DPPC molecules are provided in our previous publication.[7]. In addition to extracting the σij, σλij, and εij coarse-grained parameters, the GROMACS simulation data was used to calculate the minimum and maximum bond and pseudobond lengths between coarse-grained sites. Pseudobonds are used in the model to maintain the relative stiffness of the lipid molecules by limiting the fluctuation of the coarse-grained sites to the angles and torsional angles observed during the GROMACS simulation.
The coarse-grained interaction parameters between the nanoparticle and the DPPC sites were chosen to allow us to study the behavior of nanoparticles with diameters ranging in size from 10 – 250 Å. For this work we studied the interaction of the DPPC bilayer membrane with both hydrophilic and hydrophobic nanoparticles so that we could compare our results to data on nanoparticles with a wide range of hydrophobicities. We chose to model hydrophilic nanoparticles as spheres that interacted strongly with the hydrophilic lipid head groups of the DPPC molecules. (Since the hydrophilic lipid head groups in LIME have stronger interaction energies with each other than with the hydrophobic tail groups, we assumed that a hydrophilic nanoparticle would also have stronger interaction energies with the hydrophilic lipid head groups than with the hydrophobic tails.) To model these interactions the εij values between DPPC coarse-grained sites 1 (choline entity), 2 (phosphate group) 3 (ester group) and 9 (ester group) and hydrophilic nanoparticles were each set to -2.0 eV, which is much larger than the average intermolecular εij value of -0.036eV for DPPC coarse-grained sites. A value of -2.0 eV was chosen because it represents a very strong attraction (large well-depth) and we felt it would give us a good idea of the way that very hydrophilic nanoparticles would interact with a membrane. The εij between the hydrophilic nanoparticles and all of the DPPC akyl tail groups (coarse-grained sites 4-8 and 10-14) were chosen to be zero, i.e. they interact as hard-spheres. The σλij values between hydrophilic nanoparticles and DPPC coarse-grained sites 1 (choline entity), 2 (phosphate group) 3 (ester group) and 9 (ester group) were set to a value that made the width of the square-well interaction (σλij - σij) equal to 5.0 Å. Since this work was not performed to model any specific nanoparticle/bilayer system, we did not have any atomistic or experimental data to help us select the range for the square-well interactions between the nanoparticle and lipid head groups. We chose the range to be 5.0 Å, long enough for the lipids to feel the nanoparticles and want to wrap around them but not so long that the lipids could have square-well interactions with the nanoparticle without having to wrap around them. In addition, 5.0 Å is less than the 10.0 Å cutoff radius we use when we run atomistic simulations to obtain relatively realistic coarse-grained parameters for the lipid/nanoparticle interactions.
The interaction parameters between nanoparticle and lipid for the hydrophobic nanoparticle case were chosen in the following way. Since the hydrophobic lipid tails in LIME have much stronger interactions with each other than they do with the hydrophilic lipid head groups, we assumed that hydrophobic nanoparticles would prefer to interact with the hydrophobic lipid tails rather than with the hydrophilic lipid head groups. To model these interactions the hydrophobic nanoparticles were assigned square-well interactions of strength εij = -2,0eV with the hydrophobic tails (coarse-grained sites 4-8 and 10-14) and hard-sphere interactions with the DPPC coarse-grained sites 1 (choline entity), 2 (phosphate group) 3 (ester group) and 9 (ester group). The σλij value between hydrophobic nanoparticles and DPPC coarse-grained sites 4-8 and 10-14 (hydrophobic alkyl tails) was set to a value that made the width of the square-well interaction (σλij - σij) equal to 5.0 Å.
Each simulation was started from a preformed DPPC bilayer containing either 1500, 2500, 4000, or 20000 molecules. The bilayers composed of 1500, 2500, 4000 and 10000 lipids were built to span areas of 218Å × 218Å, 281Å × 281Å , 356Å × 356Å, and 563Å × 563Å in the center of boxes with dimensions of 250Å × 250Å × 250Å. 400Å × 400Å × 400Å, 600Å × 600Å × 600Å and 800Å × 800Å × 800Å, respectively. In all cases the bilayer was placed in a position where it could not interact with its periodic boundary image in each simulation. This was done to prevent the surface tension of the bilayer from affecting its interaction with the nanoparticle. We did not force the bilayer to remain fixed at the center of our simulation box. However, we did ensure that our simulation box was sufficiently large to prevent the bilayer from interacting with its periodic images regardless of how much it migrated. Each nanoparticle was initially placed at the center of the bilayer, approximately 5Å above the preformed bilayer, far enough from the bilayer to prevent any overlaps, yet close enough to begin interacting with the bilayer. We chose to position nanoparticles close to the bilayers to avoid spending computational resources on simulations in which the nanoparticles did not interact with the bilayer. All simulations were run at constant volume with a T* = 0.77.
Results and Discussion
DMD simulations were conducted to study the interaction between hydrophilic nanoparticles with a range of different physical properties and a bilayer composed of DPPC molecules. The nanoparticles in each simulation had diameters ranging from 10 250 Å reflecting the fact that nanoparticles can be made in a variety of sizes. Each nanoparticle in the simulations reported in this paper had a mass density of 0.013 amu/Å3.
Simulations were conducted for ten different parameter sets; due to the computational intensity we only conducted a single run for each set. Table 5 lists the nanoparticle diameter,, hydrophobicity and the number of DPPC lipids present in each simulation.
Table 5.
The nanoparticle diameter, nanoparticle hydrophobicity, and number of DPPC lipids in each simulation.
| Run # | Nanoparticle Diameter (Å) | Hydrophobicity | Number of DPPC lipids |
|---|---|---|---|
| 1 | 10 | hydrophilic | 1500 |
| 2 | 20 | hydrophilic | 1500 |
| 3 | 40 | hydrophilic | 1500 |
| 4 | 60 | hydrophilic | 2500 |
| 5 | 100 | hydrophilic | 4000 |
| 6 | 250 | hydrophilic | 10000 |
| 7 | 10 | hydrophobic | 1500 |
| 8 | 20 | hydrophobic | 1500 |
| 9 | 30 | hydrophobic | 1500 |
| 10 | 40 | hydrophobic | 1500 |
Hydrophilic Nanoparticles
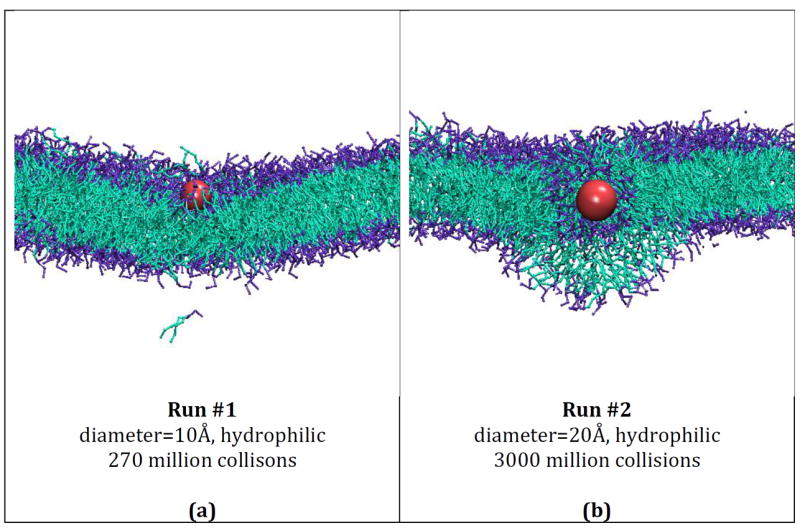
Figures 2 (a) – (f) provide snapshots of runs 1 – 6 (described in Table 5), respectively. Figure 2a shows an image of the nanoparticle from run 1 after it embeds itself within the hydrophilic headgroups of the membrane. Figures 2 (b) – (e) provide images of the nanoparticles in runs 2-5, respectively, after they have become completely wrapped by the bilayer membrane. Figure 2f provides an image of the very large (250Å) nanoparticle in run 6 undergoing the wrapping process. Time limitations prevented us from getting to the stage where this nanoparticle was completely wrapped. Each figure shows the interactions between the nanoparticle and the DPPC lipids. Comparison of the various panels makes it apparent that nanoparticle size plays a major role in determining whether or not a hydrophilic nanoparticle will be wrapped by a lipid bilayer. The hydrophilic nanoparticle with a diameter of 10 Å (Figure 2a) embedded itself within the hydrophilic portion of the bilayer but did not get wrapped. Hydrophilic nanoparticles with diameters of 20, 40, 60, 100 and 250Å (Figure 2b – 2f) do get wrapped.
Figure 3 shows the difference between the z position (the bilayer normal points in the z direction) of the DPPC headgroups (coarse-grained type 1) in square-well contact with the nanoparticle and the z position of the DPPC head groups not in square well contact with the nanoparticle as a function of time for runs #1, #2 and #3. Only the DPPC head groups in the leaflet of the bilayer that is interacting with the nanoparticle are considered. This gives us a measure of the degree of penetration/wrapping of the membrane by the nanoparticle as a function of time. Here by square well contact we mean coarse-grained sites interacting via a square-well potential with each other. We can see that as the nanoparticle becomes wrapped in runs #2 and #3 and moves down through the bilayer, the average distance (in the z-direction) between DPPC headgroups in contact with the nanoparticle and not in contact with the nanoparticle increases. Figure 3 also shows that for run #1, in which the nanoparticle does not become wrapped (it just stays within the hydrophilic portion of the membrane), the distance (in the z-direction) between DPPC headgroups in and out of square well contact with the nanoparticle fluctuates, but does not increase over time since the nanoparticle does not move through the bilayer.
Figure 3.
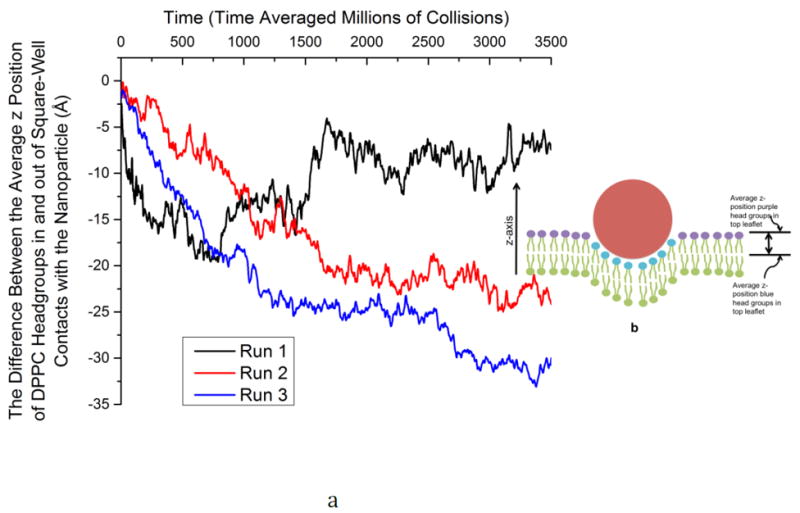
(a) The difference between the average z position of DPPC headgroups in square-well contact and not in square well contact with the nanoparticle versus time for Runs #1, #2 and #3. (b) A simple schematic of a DPPC bilayer interacting with a nanoparticle (red). DPPC head groups that are experiencing a square-well interaction with the nanoparticle are shown in blue whereas those in the top leaflet that are not interacting with the nanoparticle are shown in purple. The difference between the average z-position of DPPC head groups in and out of square-well contacts with the nanoparticle is calculated by taking the average z-position of the blue head groups and subtracting the average z-position of the purple head groups in the top leaflet of the bilayer. This gives us a measure of how deeply the nanoparticle has penetrated the bilayer.
Figure 4 shows the fraction of a nanoparticle wrapped by DPPC lipids as a function of time for hydrophilic nanoparticles with diameters of 20Å (Run #2), 40Å (Run #3), 60Å (Run #4), and 100Å (Run #5). We see that the rate of wrapping decreases as nanoparticle size increases and the time required for complete wrapping increases as nanoparticle size increases.
Figure 4.
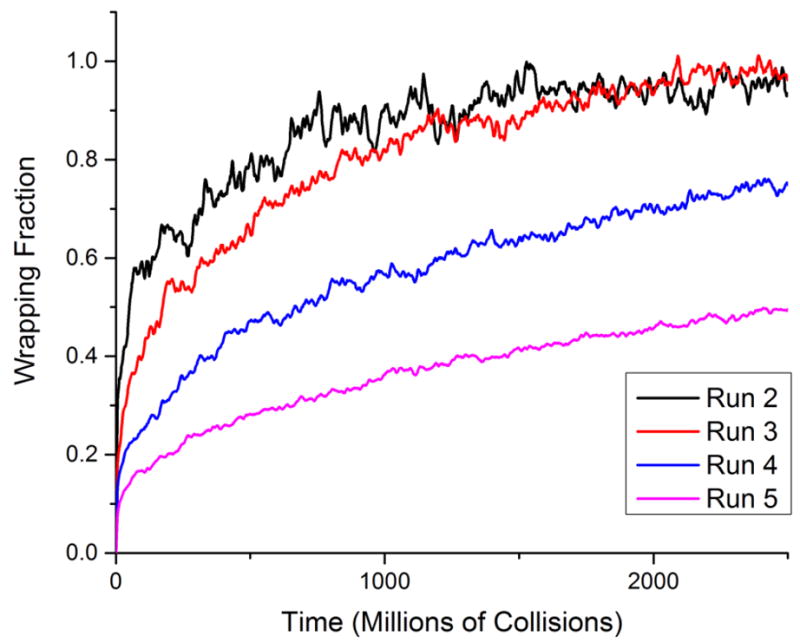
The wrapping fraction as a function of time for nanoparticles with diameters of 20Å (Run #2), 40Å (Run #3), 60Å (Run #4), and 100Å (Run #5). The time is displayed as the time in millions of collisions.
Figure 5 provides snapshots at different time points during run #3, where a hydrophilic nanoparticle with a diameter of 40Å is wrapped by a bilayer. At 25 million collisions (Figure 5a) the nanoparticle reaches the surface of the membrane and is then slowly wrapped by the bilayer in 5b (500 million collisions), 5c (1250 million collisions) and 5d (3000 million collisions). The same wrapping process was observed for all other hydrophilic nanoparticles with a diameter greater than 20Å.
Figure 5.
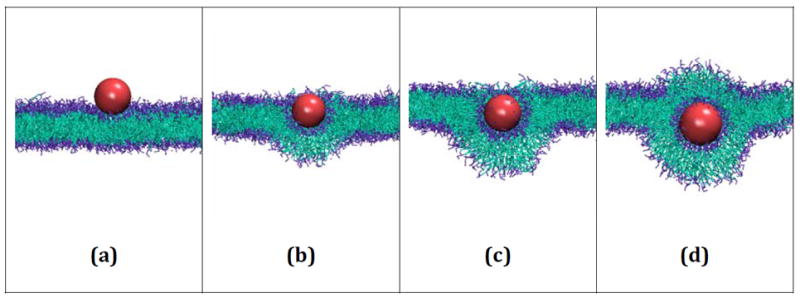
Snapshots from run #3 in which a hydrophilic nanoparticle with diameter 40Å is wrapped by a bilayer membrane composed of 1500 DPPC lipids. The nanoparticle (a) reaches the surface of the bilayer at 25 million collisions. The wrapping process continues at (b) 500 million collisions, (c) 1250 million collisions and (d) 3000 million collisions.
Hydrophobic Nanoparticles
Figure 6 provides simulation snapshots of the embedding of a hydrophobic nanoparticle with a diameter of 20 Å by DPPC bilayers at three different time points in run #8. Figure 6a shows the hydrophobic nanoparticle approaching the surface of the membrane after 25 million collisions. By 50 million collisions, Figure 6b, the nanoparticle has entered the lipid bilayer but continues to interact with both the hydrophilic head groups and hydrophobic tails of the DPPC lipids. Figure 6c shows the nanoparticle after it has completely embedded itself within the inner hydrophobic core of the membrane at 225 million collisions. In fact, the nanoparticle completely embeds itself within the membrane by 75 million collisions; there is no visible change in the configuration between the 75 million and 225 million collisions. Since this simulation ran at a rate of approximately 1 million collisions per minute, the time required for the nanoparticle to completely embed itself within the bilayer membrane is approximately 1.25 CPU hours.
Figure 6.
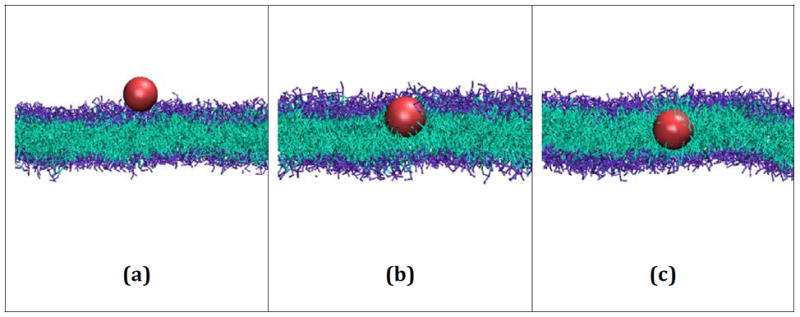
Snapshots from run #8 in which a hydrophobic nanoparticle with a diameter of 20Å embeds itself in a DPPC bilayer composed of 1500 lipids. The nanoparticle (a) reaches the surface of the bilayer after 25 million collisions, (b) begins to penetrate the membrane after 50 million collisions, and (c) is fully embedded within the inner hydrophobic core of the membrane after 225 million collisions.
Figure 7 shows the time averaged distance from the nanoparticle to the plane through the center of the bilayer for runs #7, #8, #9 and #10. The plane that goes through the center of the bilayer was calculated as the average z-position of the terminal tail coarse-grained sites of all DPPC lipids on both layers not in a square-well interaction with the nanoparticle. This plane fluctuated by a small amount over the course of each simulation; however, the location of the plane was recalculated for each time point included in Figure 7. Figure 7 also shows that for runs #7, #8, #9 and #10 (hydrophobic nanoparticles with diameters of 10Å, 20Å, 30Å and 40Å, respectively) once the nanoparticle starts to experience square-well interactions with the bilayer, the distance between the nanoparticle and the plane through the bilayer center decreases as a function of time until it reaches approximately 0 Å. Once each hydrophobic nanoparticle reaches the plane through the bilayer center, the distance between the nanoparticle and the bilayer fluctuates slightly but overall remains almost constant. It can be seen that the smaller the nanoparticle the faster it penetrates the bilayer to reach the plane through the bilayer center. This makes sense: smaller nanoparticles have to push less lipids out of the way to penetrate the bilayer.
Figure 7.
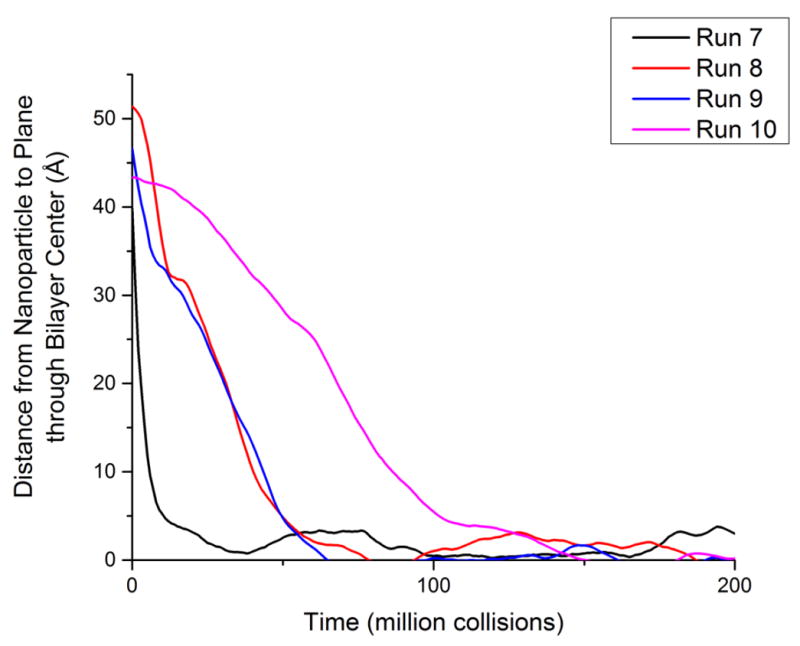
The distance from the hydrophobic nanoparticle to the plane through the bilayer center for runs #7 (10Å), #8 (20Å) #9 (30Å) and #10 (40Å). The zero time point for each run is set to the time when the nanoparticle first has a square-well interaction with a lipid tail coarse-grained site.
Conclusion
We describe the results of computer simulations performed to study the interaction between nanoparticles with a range of physical properties (sizes and hydrophobicities) with DPPC lipid membranes. Our model is generic, meant to give insights into the general biophysics associated with nanoparticle-membrane interactions. For this reason, we cannot compare our findings to any specific nanoparticle/membrane system because the parameters that we used for the nanoparticle in this model were not based on experimental work or on atomistic simulation. The great advantage of LIME/DMD compared to similar simulation tools is that it is both fast and specific. Many of the similar models that we have discussed employ dissipative particle dynamics (DPD).[32] These models typically used only 3 beads to represent each lipid molecule. In comparison, 14 coarse-grained sites with realistic geometries and energetics are used to represent each lipid in our model. Our ability to easily determine specific parameters for coarse-grained sites is likely to be very useful for studying the detailed molecular level interactions that govern the behavior of functionalized nanoparticles interacting with proteins and biomembranes. Since the simulations-based papers on related coarse-grained models that we looked at do not report the CPU time required to run their models it is difficult to compare their speeds with ours. However, one way to compare the time required to complete different simulation studies is to consider the Big-O notation, a measure of the computational efficiency of different codes. Big-O notation is used to describe how the performance or complexity (referring to the number of operations) required to run an algorithm depends on the system size. The Big-O notation for DMD is O(log (n)) and for continuous molecular dynamics simulations is O(nlog(n)), where n represents the number of particles in each simulation. For example in DMD an operation could be the search for the next collision event and for continuous molecular dynamics an operation could be the performance of the calculations required at each timestep. Therefore, as system size increases (the number of particles increases), the computational resource for simulations using continuous molecular dynamics will grow n times faster than those required by DMD. This is an important factor to consider for simulating large nanoparticles with diameters on the order of nanometers since these can require very large systems.
Although not physically realistic, in this work we have decoupled particle volume from interaction strength. We selected a reasonable square-well width on the order of 5 Å, and interaction energies of -2.0eV for interactions between hydrophilic nanoparticles and hydrophilic lipid molecules and for interactions between hydrophobic nanoparticles and hydrophobic lipid molecules. Note that changing the interaction energy and square-well width of the interaction between the hydrophilic nanoparticles and DPPC lipids will likely affect the critical particle size above which there is wrapping. For this work, we simply aimed to demonstrate that for a given set of interaction parameters we could observe the wrapping process for nanoparticles above a certain size. We did not aim to model a specific nanoparticle/bilayer system. In the future, we hope to utilize our multiscale modeling approach to obtain realistic square-well depths and widths for which we can compare the critical point of particle size for wrapping to experimental values.
We chose to study both hydrophilic and hydrophobic nanoparticles to investigate the interaction between bilayer membranes and nanoparticles with different hydrophobicities. We successfully demonstrated that LIME/DMD can be used to model the process by which hydrophilic nanoparticles are either wrapped by a bilayer membrane or implant themselves on the surface of the membrane. We also show how hydrophobic nanoparticles spontaneously penetrate the lipid bilayer to embed themselves within the membrane core.
It is of interest to compare the trends that we have observed with those found in nature. Nanoparticle size is known to play a role in cellular uptake. According to Nel and co-workers a threshold radius exists below which particles are incapable of entry and hence cellular uptake is reduced.[1] In addition, nanoparticles are thought to have optimal sizes which help to accelerate the wrapping process.[1,2,33]. Values for the threshold radius and the optimal wrapping radius vary depending on nanoparticle properties. Our LIME/DMD simulations are consistent with this concept in that our model membrane would not wrap nanoparticles with a diameter below a critical value.
Our result that hydrophilic nanoparticles with a diameter less than 20Å get embedded as opposed to wrapped by the lipid bilayers is in agreement with the experimental observation of Bihan and co-workers. They showed that hydrophilic silica nanoparticles with diameters of approximately 15-20nm remained bound to the outer surface of a liposomal membrane and that hydrophilic silica nanoparticles with diameters of 30nm and 65nm were engulfed.[3]. Note that we cannot directly compare our results to those of Bihan et al because we did not simulate the same type of nanoparticle. In addition, we cannot draw any direct comparisons between our work and any of the other experimental studies discussed because we did not study the same size or type of nanoparticles.
We measured the wrapping fraction as a function of time for nanoparticles with diameters from 20Å - 250Å and found that the rate of wrapping decreases as nanoparticle diameter increases. These results were consistent with those of Gao et al. who observed a higher wrapping rate for small nanoparticles than for large nanoparticles during molecular dynamics simulations using the dissipative particle dynamics method.[34] In the future, we plan to simulate the behavior of specific nanoparticle/membrane systems with realistic estimates for the nanoparticle size, density and hydrophilicity.
We also studied the interaction between hydrophobic nanoparticles and the bilayer membrane. According to our simulations, hydrophobic nanoparticles embed themselves within the hydrophobic core of the bilayer membrane without becoming wrapped. This result is in good agreement with those of Li et al. who showed that in simulations of hydrophobic nanoparticles and DPPC bilayers the nanoparticle embeds itself into the hydrophobic core of the membrane.[35]. Our results are also consistent with simulations performed by Qiao et al. who found that a hydrophobic fullerene C60 molecule easily embeds itself within a DPPC bilayer.[36] The authors explain that the adsorption of the C60 into the DPPC bilayer is driven by the interactions between the C60 and the lipid tails. In addition, the authors report that C60(OH)20 adsorbed onto the membrane instead of embedding within the bilayers because this functionalization of the fullerene made it hydrophilic.[36]. In other experimentally-based studies, silver hydrophobic nanoparticles have been found to embed themselves inside the bilayer membrane regardless of the values for the mass per volume.[37,38]. This was also the case in our simulations for both hydrophilic and hydrophobic nanoparticles.
Since this work was essentially a proof-of-method study to see if LIME/DMD simulations were capable of mimicking the adsorption of a nanoparticle by a lipid membrane, we designed our systems to minimize simulation time, which is why we limited the diameter of our nanoparticles to the size range of 10Å - 250Å. We chose not to study nanoparticles larger than 250 Å because this would require extremely large bilayers to provide enough lipid molecules to fully wrap the nanoparticles, which would in turn require significant computational resources and time. In the future we would like to simulate systems with much larger nanoparticles (50nm – 100nm). Now that we have verified the ability of our model to properly simulate nanoparticle behavior, we are ready to invest the time required to model these larger systems.
One advantage that our LIME/DMD model has over other coarse-grained models reported in the literature is its speed. We demonstrated in our previous publication that LIME allows for the simulation of lipids at the fastest rate reported in the literature.[7]. The is important for bilayer/nanoparticle studies because the number of molecules in bilayer/nanoparticle systems is often very large, requiring a very fast algorithm in order to simulate their behavior over desirable time scales. While the LIME/DMD model has many advantages for simulating the interaction between nanoparticles and lipid membranes it does have some disadvantages. Some of these limitations include: (1) electrostatics is not represented explicitly, (2) the use of an implicit solvent approach means that diffusion and hydrodynamics are not well represented, and (3) a direct correlation between reduced temperature and real temperature can only be made at the temperature at which LIME was parameterized.
Supplementary Material
Figure 1.
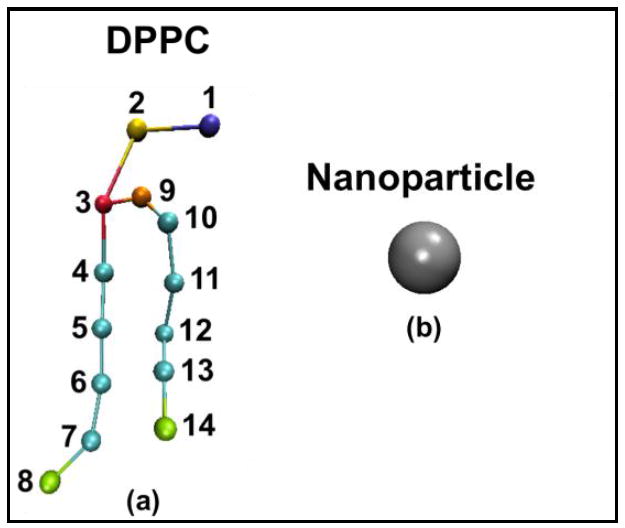
(a) Coarse-grained representation of DPPC (b) Coarse-grained representation of a nanoparticle. The color scheme is; purple (choline entity – type I for DPPC site 1); yellow (phosphate group – type II for DPPC site 2); red (ester group – type III for DPPC site 3); orange (ester group – type IV for DPPC site 9); cyan (alkyl tail groups – type V for DPPC sites 4-7&10-13); green (terminal tail groups – type VI for DPPC sites 8&14); gray (nanoparticle – type VII for nanoparticle site 1). The size of the DPPC coarse-grained sites and the nanoparticle are not drawn to scale.
Acknowledgments
This work was supported by the National Institutes of Health under grants GM56766 and EB006006, and by the National Science Foundation under grant DMR-1206943. This work was also supported in part by NSF’s Research Triangle MRSEC (DMR-1121107). EMC received a GAANN (North Carolina State University Graduate Assistance in Areas of National Need) Computational fellowship and a NIH/North Carolina State University Molecular Biotechnology Training Program fellowship. This work used the Extreme Science and Engineering Discovery Environment (XSEDE), which is supported by National Science Foundation grant number ACI-1053573. EMC received a startup research allocation from XSEDE, which helped complete the work described in this paper. We thank the National Institute for Computational Science (NICS), Texas Advanced Computing Center (TACC) and San Diego Supercomputer Center (SDSC) for providing us computing time. We also thank the Deutsche Forschungsgemeinschaft (DFG) for financial support via the International Research Training Group 1524 ‘‘Self-Assembled Soft Matter Nano- Structures at Interfaces
References
- 1.Nel A, Madler L, Velegol D, Xia T, Hoek E, Somasundaran P, Klaessig F, Castranova V, Thompson M. Nat Mater. 2009;8:543–557. doi: 10.1038/nmat2442. [DOI] [PubMed] [Google Scholar]
- 2.Chithrani B, Chazani A, Chan W. Nano Lett. 2006;6:662–668. doi: 10.1021/nl052396o. [DOI] [PubMed] [Google Scholar]
- 3.Bihan OL, Bonnafous P, Marak L, Bickel T, Trepout S, Mornet S, De Haas F, Talbot H, Taveau J, Lambert O. J Struct Biol. 2009;168:419–425. doi: 10.1016/j.jsb.2009.07.006. [DOI] [PubMed] [Google Scholar]
- 4.Win K, Feng S. Biomaterials. 2005;26:2713–2722. doi: 10.1016/j.biomaterials.2004.07.050. [DOI] [PubMed] [Google Scholar]
- 5.Verma A, Uzun O, Hu Y, Hu Y, Han H, Watson N, Chen S, Irvine D, Stellacci F. Nature Mater. 2008;7:588–595. doi: 10.1038/nmat2202. [DOI] [PMC free article] [PubMed] [Google Scholar]
- 6.Pan Y, Neuss S, Leifert A, Fischler M, Wen F, Simon U, Schmid G, Brandau W, Jahnen-Dechent W. Small. 2007;11:1941–1949. doi: 10.1002/smll.200700378. [DOI] [PubMed] [Google Scholar]
- 7.Curtis E, Hall C. J Phys Chem B. 2013;117:5019–5030. doi: 10.1021/jp309712b. [DOI] [PMC free article] [PubMed] [Google Scholar]
- 8.Cooper GM. The Cell. 2. Sinauer Associates; Sunderland: 2000. [Google Scholar]
- 9.Bahrami AH, Raatz M, Agudo-Canalejo J, Michel R, Curtis E, Hall CK, Gradzielski M, Lipowsky R, Weikl TR. Adv Colloid Interface Sci. 2014;208:214–224. doi: 10.1016/j.cis.2014.02.012. [DOI] [PubMed] [Google Scholar]
- 10.Pera H, Nolte TM, Leermakers FAM, Kleijn JM. Langmuir. 2014;30:14581–14590. doi: 10.1021/la503413w. [DOI] [PubMed] [Google Scholar]
- 11.Bedrov D, Smith G, Davande H, Li L. J Phys Chem B. 2008;112:2078–2084. doi: 10.1021/jp075149c. [DOI] [PubMed] [Google Scholar]
- 12.Vacha R, Martinez-Veracoechea F, Frankel D. Nano Lett. 2011;11:5391–5395. doi: 10.1021/nl2030213. [DOI] [PubMed] [Google Scholar]
- 13.Cooke IR, Deserno M. J Chem Phys. 2005;123:224710. doi: 10.1063/1.2135785. [DOI] [PubMed] [Google Scholar]
- 14.Limbach H, Arnold A, Mann B, Holm C. Comput Phys Commun. 2006;174:704–727. [Google Scholar]
- 15.Ding H, Tian W, Ma Y. ACS Nano. 2012;6:1230–1238. doi: 10.1021/nn2038862. [DOI] [PubMed] [Google Scholar]
- 16.Ding H, Ma Y. Biomaterials. 2012;33:5798–5802. doi: 10.1016/j.biomaterials.2012.04.055. [DOI] [PubMed] [Google Scholar]
- 17.Foloppe N, MacKerell AD., Jr J Comput Chem. 2000;21:86–104. [Google Scholar]
- 18.Lin X, Li Y, Gu N. J Comput Theor Nanosci. 2010;7:269–276. [Google Scholar]
- 19.Lindahl E, Hess B, Van der Spoel D. J Mol Model. 2001;7:306–317. [Google Scholar]
- 20.Marrink S, de Vries A, Mark A. J Phys Chem B. 2004;108:750–760. [Google Scholar]
- 21.Marrink S, Risselada H, Yefimov S, Tieleman D, de Vries A. J Phys Chem B. 2007;111:7812–7824. doi: 10.1021/jp071097f. [DOI] [PubMed] [Google Scholar]
- 22.Yang K, Ma Y. Nat Nanotechnol. 2010;5:579–583. doi: 10.1038/nnano.2010.141. [DOI] [PubMed] [Google Scholar]
- 23.Smith SW, Hall CK, Freeman BD. J Comput Phys. 1997;134:26–30. [Google Scholar]
- 24.Alder B, Wainwright T. J Chem Phys. 1959;31:459–466. [Google Scholar]
- 25.Rapaport DC. J Phys A: Math Gen. 1978;11:L213–L217. [Google Scholar]
- 26.Rapaport DC. J Chem Phys. 1979;71:3299–3303. [Google Scholar]
- 27.Nguyen HD, Hall CK. Proc Natl Acad Sci U.S.A. 2004;101:16180–16185. doi: 10.1073/pnas.0407273101. [DOI] [PMC free article] [PubMed] [Google Scholar]
- 28.Andersen HC. J Chem Phys. 1980;72:2384–2393. [Google Scholar]
- 29.Faller R, Marrink A. Langmuir. 2004;20:7686–7693. doi: 10.1021/la0492759. [DOI] [PubMed] [Google Scholar]
- 30.Van der Spoel D, Lindahl E, Hess B, Groenhof G, Mark A, Berendsen H. J Computational Chemistry. 2005;26:1701–1719. doi: 10.1002/jcc.20291. [DOI] [PubMed] [Google Scholar]
- 31.Oostenbring C, Villa A, Mark A, Van Gunsteren W. J Comput Chem. 2004;25:1656–1675. doi: 10.1002/jcc.20090. [DOI] [PubMed] [Google Scholar]
- 32.Groot RD, Warren PB. J Chem Phys. 1997;107:4423–4435. [Google Scholar]
- 33.Decuzzi P, Ferrari M. Biomaterials. 2007;28:2915–2922. doi: 10.1016/j.biomaterials.2007.02.013. [DOI] [PubMed] [Google Scholar]
- 34.Gao X, Dong J, Zhang X. Mol Simul. 2014;41:531–537. [Google Scholar]
- 35.Li Y, Chen X, Gu N. J Phys Chem B. 2008;112:16647–16653. doi: 10.1021/jp8051906. [DOI] [PubMed] [Google Scholar]
- 36.Qiao R, Roberts AP, Mount AS, Klaine SJ, Ke PC. Nano Lett. 2007;7:614–619. doi: 10.1021/nl062515f. [DOI] [PubMed] [Google Scholar]
- 37.Park S, Oh S, Mun J, Han S. Colloids Surf, B. 2005;44:117–122. doi: 10.1016/j.colsurfb.2005.06.002. [DOI] [PubMed] [Google Scholar]
- 38.Bothun G. J of Nanobiotechnol. 2008;6:1–10. [Google Scholar]
Associated Data
This section collects any data citations, data availability statements, or supplementary materials included in this article.