Abstract
Objective(s):
Dispersive liquid-liquid microextraction coupled with gas chromatography (GC)-flame ionization detector was developed for the determination of valproic acid (VPA) in human plasma.
Materials and Methods:
Using a syringe, a mixture of suitable extraction solvent (40 µl chloroform) and disperser (1 ml acetone) was quickly added to 10 ml of diluted plasma sample containing VPA (pH, 1.0; concentration of NaCl, 4% (w/v)), resulting in a cloudy solution. After centrifugation (6000 rpm for 6 min), an aliquot (1 µl) of the sedimented organic phase was removed using a 1-µl GC microsyringe and injected into the GC system for analysis. One variable at a time optimization method was used to study various parameters affecting the extraction efficiency of target analyte. Then, the developed method was fully validated for its accuracy, precision, recovery, stability, and robustness.
Results:
Under the optimum extraction conditions, good linearity range was obtained for the calibration graph, with correlation coefficient higher than 0.998. Limit of detection and lower limit of quantitation were 3.2 and 6 μg/ml, respectively. The relative standard deviations of intra and inter-day analysis of examined compound were less than 11.5%. The relative recoveries were found in the range of 97 to 107.5%. Finally, the validated method was successfully applied to the analysis of VPA in patient sample.
Conclusion:
The presented method has acceptable levels of precision, accuracy and relative recovery and could be used for therapeutic drug monitoring of VPA in human plasma.
Keywords: Dispersive liquid-liquid microextraction, Gas chromatography-flame ionization detector, Human plasma, Valproic acid
Introduction
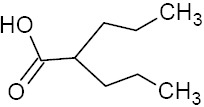
Valproic acid (2-propylpentanoic acid, VPA) is a simple eight carbon branched-chain fatty acid with unique anticonvulsant properties and is used in the treatment of epilepsy, bipolar disorder and prophylaxis of migraine headaches (1–5). Hence, monitoring drug levels in various matrices is particularly valuable in epilepsy for effective therapeutic drug management (6–9). Therapeutic serum/plasma concentration of VPA is between 20–100 µg/ml during controlled therapy but its toxic serum/plasma concentration may reach 120–150 µg/ml (10). Physicochemical and pharmacokinetic properties of VPA are listed in Table1. High performance liquid chromatography (HPLC) with ultraviolet (UV) detection (11, 12), fluorescence detection (13, 14) or coupled with mass spectrometry (MS) (15– 17) and capillary electrophoresis (CE) coupled with contactless conductivity detection (CD) (18, 19), are the methods that were used for determination of VPA. Additionally, due to volatility of VPA, gas chromatography (GC) (20, 21) is often used. In order to prevent severe tailing of the fatty acid peak, on-column and pre-column derivatization have also been used (22, 23). Analysis of VPA in biological samples is difficult due to the presence of proteins, salts and various organic compounds in samples. Hence, sample preparation is crucial in drug analysis, which includes both analyte pre-concentration and sample cleanup (24). Some sample preparation techniques based on protein precipitation (PPT) (18), liquid-liquid extraction (LLE) (22), solid-phase extraction (SPE) (16), solid-phase microextr-action (SPME) (23, 25–27), hollow fiber-liquid-phase microextraction (HF-LPME) (28) and dispersive liquid–liquid microextraction (DLLME) (19, 29) have been developed for this purpose. LLE is time-consuming and uses large amounts of potentially toxic or hazardous solvents (30). In addition, the resulting extract may be transferred, evaporated to dryness and reconstituted with a suitable solvent prior to analysis. Compared with LLE, SPE is a selective sample preparation method that uses a packed solid sorbent (silica or polymer) to isolate the desired analyte. Nevertheless, potential variability of SPE packings, irreversible adsorption of some analytes on SPE cartridges and more-complex method development are some of the drawbacks that are presented by this technique (31). SPME was introduced in the early 1990s as a solvent-free process for extracting the analytes from aqueous samples or headspace of the samples (32). Despite its obvious advantages, SPME suffers from some drawbacks, for example: expensive SPME fibers are fragile and quite sensitive to complex matrices such as plasma (33). LPME is a solvent-minimized sample pretreatment procedure, in which only a few microliters of solvents are used (34, 35). Several different modes of LPME have been developed, such as static LPME, dynamic LPME and HF-LPME (36). It should be noted that in most cases, LPME methods are time-consuming and equilibrium could not be attained even after a long extraction time (31). Recently, Assadi et al developed a simple and novel LPME method, which was named as DLLME (37, 38). In this method, a water-miscible disperser solvent containing a water-immiscible extraction solvent is injected into the aqueous solution of analytes. A cloudy solution (a mixture of water, disperser solvent, and extraction solvent) is formed and consequently the equilibrium state achieved quickly. After phase separation, enriched analyte can be determined by analytical systems. To our knowledge, there is no DLLME coupled with gas chromatography-flame ionization detector (GC-FID) method for determination of VPA in human plasma in the literature. The present work is the first report of combination of the DLLME method with GC-FID, without any derivatization, for the determination of VPA in human plasma. Several factors that influence the microextraction efficiency were comprehensively examined in detail and the optimized microextraction conditions were established. Finally, the developed method was validated according to the Food and Drug Administration (FDA) guidance and applied to a real sample analysis.
Table 1.
Physicochemical and pharmacokinetic properties of valporic acid
| Physicochemical properties | ||||
|---|---|---|---|---|
| Molecular structure | Molecular weight (g/mole) | Melting point (°C) | Log P | pKa |
 |
144.21 | 120-121 | 2.8 | 4.7 |
| Pharmacokinetic properties | ||||
| Therapeutic range (µg/ml) | Toxic range (µg/ml) | Half-life [t0.5 (h)] | Bioavailability | Plasma protein binding (%) |
| 20-100 | 120-150 | 9-18 | 70-100 | 80-95 |
Physicochemical properties calculated using ACD/Labs software version 11.0
Materials and Methods
Chemicals and reagents
Sodium valproate was kindly donated by Rouz Darou Pharmaceutical Co. (Tehran, Iran). Dichloro-methane, tetrachloroethylene, chloroform, and carbon tetrachloride as extraction solvents and other chemicals such as methanol, acetone, acetonitrile, tetrahydrofuran (THF), sodium chloride (NaCl), hydrochloric acid (HCl), and sodium hydroxide (NaOH) were purchased from Merck Company (Darmstadt, Germany). Distilled water was used for preparation of aqueous solutions.
Instrumentation: GC-FID
An Agilent 7890A gas chromatograph with split/splitless inlet and FID was used for separation and determination of VPA. Optimum flow rates of carrier (N2) and detector gases, such as hydrogen and compressed air were 1, 40 and 300 ml/min, respectively. Hettich centrifuge, model D-7200 (Germany) was used for centrifuging. Injection port temperature of 270 °C in the splitless mode and a purge time of 30 sec were selected as optimal state. Separation was carried out on an HP-5 capillary column (30 m × 0.32 mm i.d., 0.25 μm film thicknesses). The oven temperature was programmed as follows: initial temperature of 80 °C (held 1 min), from 80 °C to 140 °C at a rate of 15 °C/min, and held at 140 °C for 2 min. Then raised at 40 °C/min to 250 °C and held for 5 min. The FID temperature was maintained at 280 °C.
Sample preparation Plasma treatment
A standard stock solution of sodium valproate (1000 mg/l) was prepared in methanol and stored at 4°C. Working solutions were prepared by dilution with deionized water. Free drug plasma samples were obtained from Iranian Blood Transfusion Research Center (Tabriz, Iran) and kept at –20 °C until analysis. For preparation of desired concentration (6-140 µg/ml) of VPA in plasma, 1 ml of drug-free plasma was spiked with known amounts of the VPA standard solution and kept at room temperature for 20 min. Then for precipitation of plasma proteins, acetonitrile was added to plasma sample in the ratio of 1:1 and vortexed for 1 min. Then it was centrifuged at 6000 rpm for 5 min. 1 ml of the clear supernatant was transferred in a 10.0 ml volumetric flask and 0.4 g NaCl was added. Following this, it was diluted to the mark with deionized water and the pH of obtained solution was adjusted to 1.00 by 1 M HCl. In order to reduce the matrix effect of the plasma sample, the supernatant was diluted 10-fold with deionized water and then was subjected to the microextraction procedure.
Preparation of real plasma sample
Blood sample was obtained from a male patient (35 years old) who had signed the consent form that was approved by the Ethics Committee, Tabriz University of Medical Sciences. This patient had been administered VPA (125 mg), flurazepam, bipyridine, risperidone, and propranolol. 5 ml of blood was collected in a heparinized tube at 2 hr after drug intake. Blood sample was centrifuged immediately and the plasma was separated and subjected to the proposed DLLME method.
DLLME procedure
In the next step, 10 ml of diluted plasma sample (described above) was transferred into a 12-ml glass test tube with conic bottom, and 1 ml acetone (as disperser) containing 40 µl chloroform (as extraction solvent) was rapidly added to the solution using a 5-ml syringe, which immediately resulted in a cloudy solution. After centrifugation at 6000 rpm for 6 min, organic phase was settled to the bottom of the tube. An aliquot (1µl) of the sedimented organic phase was removed using a 1- µl GC microsyringe (Hamilton, Switzerland) and injected into the GC system for analysis.
Assay validation
Method validation was done according to the FDA recommendations. For quantification, calibration curves were constructed on three different days. Linear range, correlation coefficient, and limit of detection (LOD) was calculated from calibration curve. The lowest and highest concentrations of calibration curve were selected as the lower limit of quantification (LLOQ) and upper limit of quantification (ULOQ), while the relative standard deviations (%RSDs) of three replications were less than 20% and 15%, respectively. Intra- and inter-day precision and accuracy were determined by measuring plasma quality control samples (QCs) at low, medium and high concentration levels of VPA. Relative recovery (RR) of the sample preparation method was computed using the following equation:

where CFound is the analyte concentration measured from the sample after analyte addition, CReal is the native analyte concentration and CAdded is the concentration of added analyte. Specificity, selectivity of method, stability of VPA in plasma samples under different storage conditions, and method robustness were also evaluated. Further details on the validation results were described in the following section.
Results
Optimization of the dispersive liquid–liquid microextraction
Extraction efficiency of DLLME depends on several parameters. One variable at a time optimization method was used to study factors affecting the extraction efficiency. Some important parameters such as types of extraction and dispersive solvents and their volumes, pH, salt effect, sample volume, centrifugation rate, and time were investigated.
Selection of the extraction solvent
Chlorinated solvents are denser than water and are the most widely used solvents in DLLME due to being easily removed from the bottom of the conical vial after centrifugation. Therefore, dichloromethane, tetrachloroethylene, chloroform, and carbon tetrachloride were used as extraction solvents. For this purpose, 500 µl of spiked plasma (140 µg/ml) was transferred into 1.5 ml Eppendorff tubes. In the next step, acetonitrile was added with 1:1 ratio. The mixture was vortexed for 1 min and centrifuged for 5 min at 6000 rpm. After precipitation of proteins, 0.5 ml of clear supernatant solution was transferred in a 5.0 ml volumetric flask and deionized water and 0.2 g NaCl was added before pH adjustment. DLLME procedure was performed by various volumes of selected extraction solvents mixed with 1 ml methanol to give equal volume of the sedimented phase (40 µl). The obtained results revealed (Figure 1) that VPA was extracted into chloroform better than the other solvents. Therefore, chloroform was selected as extraction solvent for further studies.
Figure 1.
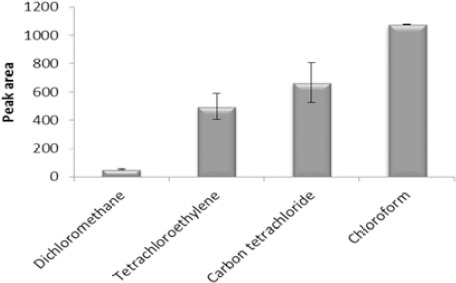
Effect of extraction solvent type on the microextraction efficiency. Extraction conditions: extraction solvent, dichloromethane (150 µl), tetrachloroethylene (100 µl), chloroform (67 μl), carbon tetrachloride (60 μl); disperser solvent, methanol (1 ml); sample volume, 5 ml; analyte concentration, 7 µg/ml of sodium valproate; pH, 2.0; concentration of NaCl, 4% (w/v); extraction time, ~0 min; centrifugation time, 5 min and centrifugation speed, 6000 rpm. The bars indicate the standard deviations (n=3)
Selection of the disperser
Selection of dispersion solvent is very important in DLLME. The disperser is a miscible solvent with both aqueous and organic phases. A cloudy solution containing fine droplets of the extraction solvent is formed when a mixture of extraction and disperser solvents is injected into an aqueous sample. Therefore, a large surface area for mass transfer is obtained. Extraction efficiency can be significantly increased by effective dispersion of an extraction solvent into aqueous phase. So 1 ml of methanol, acetonitrile, acetone or THF was mixed with 67 μl of chloroform and rapidly injected into the aqueous sample. Due to the results, acetone was selected as the disperser because of formation of a cloudy state with very fine droplets and consequently increasing the extraction capability of the VPA (Figure 2).
Figure 2.
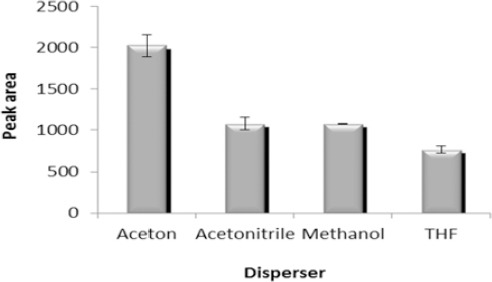
Effect of disperser kind on the microextraction efficiency. Extraction conditions: extraction solvent, chloroform (67 μl); disperser solvent volume, 1 ml; sample volume, 5 ml; analyte concentration, 7 µg/ml of sodium valproate; pH, 2.0; concentration of NaCl, 4% (w/v); extraction time, ~0 min; centrifugation time, 5 min and centrifugation speed, 6000 rpm. The bars indicate the standard deviations (n=3)
Effect of salt addition
With increasing the ionic strength, solubility of the analytes in the aqueous phase decreases and extraction efficiency can be enhanced. To evaluate this parameter, 1 ml of acetone containing 67 µl of chloroform was used for the extraction of VPA from aqueous solution containing various concentrations of NaCl from 0 to 10% (w/v).
According to the obtained results (Figure 3) peak area was slightly increased with increasing the concentration of NaCl up to 4% due to salting out effect and decreased after that due to increasing volume of the sedimented phase and dilution. Therefore, further studies were performed in the presence of 4% (w/v) NaCl.
Figure 3.
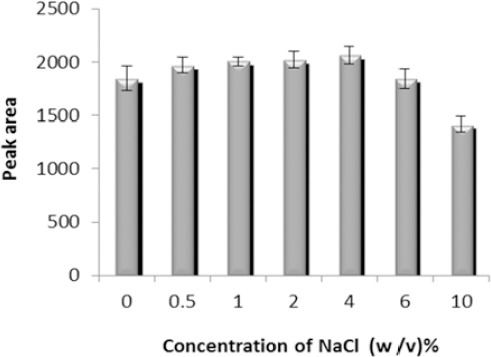
Effect of salt addition on the microextraction efficiency. Extraction conditions: extraction solvent, chloroform (67 μl); disperser solvent, acetone (1 ml); sample volume, 5 ml; analyte concentration, 7 µg/ml of sodium valproate; pH, 2.0; extraction time, ~0 min; centrifugation time, 5 min and centrifugation speed, 6000 rpm. The bars indicate the standard deviations (n=3)
Optimization of extraction solvent volume
In microextraction methods, typically microliter volumes of an organic solvent are used. Therefore, preconcentration and extraction efficiency can be significantly improved. Extraction solvent volume is usually selected as low as possible to obtain higher extraction efficiencies and lower toxic effects. Extraction solvent volume was evaluated by injecting 1 ml of acetone containing different volumes of chloroform (40, 50, 67, 75, and 100 μl). The results (Figure 4) show that the analytical signal decreases gradually with increasing the extraction solvent volume. Therefore, 40 µl was chosen as the optimum volume of the extraction solvent.
Figure 4.
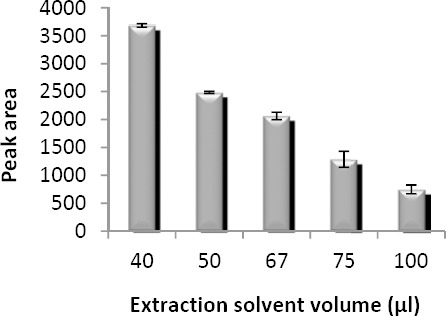
Effect of extraction solvent volume on the microextraction efficiency. Extraction conditions: extraction solvent, chloroform; disperser solvent, acetone (1 ml); sample volume, 5 ml; analyte concentration, 7 µg/ml of sodium valproate; pH, 2.0; concentration of NaCl, 4% (w/v); extraction time, ~0 min; centrifugation time, 5 min and centrifugation speed, 6000 rpm. The bars indicate the standard deviations (n=3)
Optimization of disperser volume
Disperser volume has a key role in DLLME procedure. In low disperser volumes, DLLME performance is disrupted whereas in high volumes, the solubility of the analyte in the aqueous phase is increased. To study this parameter, different volumes of acetone (0.25-2 ml) containing 40 µl of chloroform were investigated. The obtained results were illustrated in Figure 5. From these results it was concluded that analytical signal increases up to 1 ml due to the cloudy state being well formed. A further increase in disperser volume results in decreased peak areas; this may be because larger disperser volume increases the aqueous solubility of VPA. For this reason, 1 ml acetone was selected as optimum volume of disperser in subsequent experiments.
Figure 5.
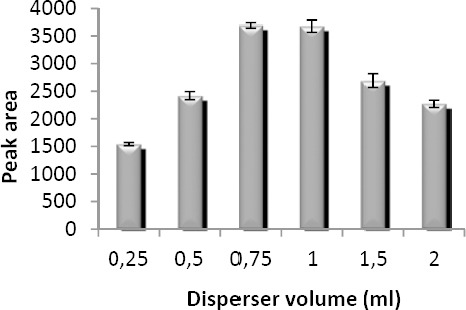
Effect of disperser volume on the microextraction efficiency. Extraction conditions: extraction solvent, chloroform (40 µl); disperser solvent, acetone; sample volume, 5 ml; analyte concentration, 7 µg/ml of sodium valproate; pH, 2.0; concentration of NaCl, 4% (w/v); extraction time, ~0 min; centrifugation time, 5 min and centrifugation speed, 6000 rpm The bars indicate the standard deviations (n=3)
Optimization of plasma sample volume
Diluted plasma sample volume effect was studied in four levels from 2.5 to 10 ml containing 7 µg/ml of VPA. For this purpose, 0.25, 0.5, 0.75, and 1 ml of spiked plasma (140 µg/ml) were mixed with the acetonitrile in 1:1 (v/v) ratio. After precipitation with acetonitrile, 0.25, 0.5, 0.75, and 1 ml of clear supernatant solution were used for preparing 2.5, 5, 7.5, and 10 ml of sample solutions. Basically, peak areas should be increased when the sample volume is increased. This is due to the additional amounts of VPA in the aqueous solution. However, ratio of organic phase/aqueous phase, reduces when sample volume increases. Therefore, extraction recovery decreases in higher volumes. As shown in Figure 6, peak area increases with increasing sample size. Therefore, 10 ml was used as the optimum sample volume in the following experiments.
Figure 6.
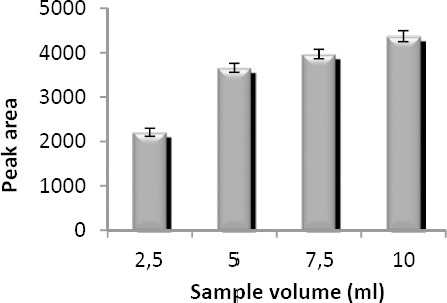
Effect of sample volume on the microextraction efficiency. Extraction conditions: extraction solvent, chloroform (40 µl); disperser solvent, acetone (1 ml); analyte concentration, 7 µg/ml of sodium valproate; pH, 2.0; concentration of NaCl, 4% (w/v); extraction time, ~0 min; centrifugation time, 5 min and centrifugation speed, 6000 rpm. The bars indicate the standard deviations (n=3)
Optimization of centrifugation rate and time
The extraction equilibrium can be attained quickly after adding mixture of the extraction and disperser solvents. In DLLME process, the most time consuming step is centrifugation. The effects of centrifugation rate and time were examined in the range of 3000–6000 rpm and 2–20 min, respectively. According to the obtained results (Figures 7A and 7B) 6000 rpm and 6 min were selected as centrifuge rate and time, respectively.
Figure 7.
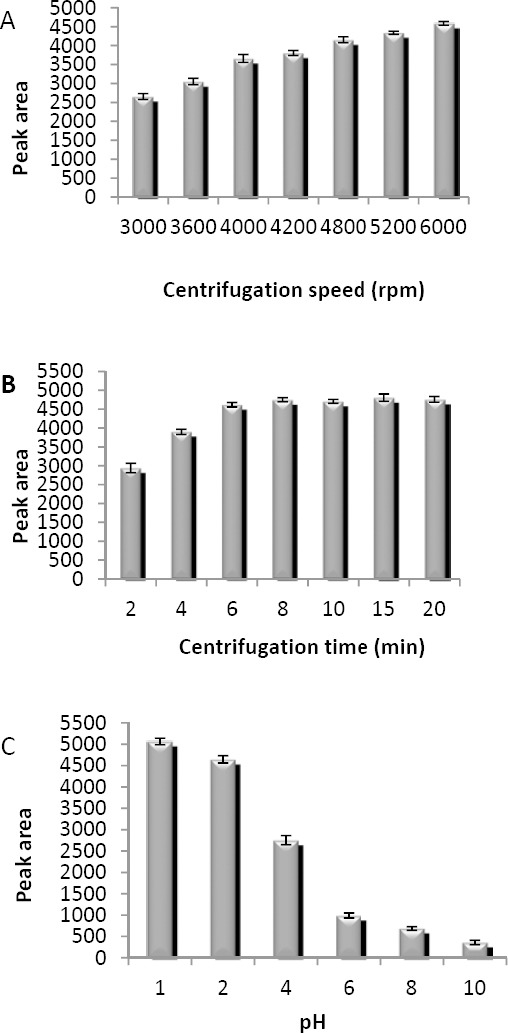
Optimization of (A) centrifugation speed, (B) centrifugation time and (C) pH. Extraction conditions: extraction solvent, chloroform (40 µl); disperser solvent, acetone (1 ml); sample volume, 10 ml; analyte concentration, 7 µg/ml of sodium valproate; concentration of NaCl, 4% (w/v); extraction time, ~0 min for A-C; (A) pH, 2.0; centrifugation time, 5 min; (B) pH, 2.0; centrifugation speed, 6000 rpm; (C) centrifugation speed, 6000 rpm; centrifugation time, 6 min. The bars indicate the standard deviations (n=3)
Effect of pH
The effect of pH was studied ranging from 1 to 10, and 1 M HCl or NaOH was used for the pH adjustment. VPA is a weak acid with a pKa of 4.7 and is completely ionized at high pH. The results in Figure 7C indicate that peak area decreases in high pH. Therefore, pH of 1 was chosen for further experiments.
Validation report Linearity and calibration curves
Three calibration curves of VPA were prepared in 3 different days at 10 increasing concentrations ranging from 6–140 (µg/ml) in plasma samples and the analysis was carried out in triplicates for each concentration. During method validation, the calibration curves were linear over the therapeutic concentration range (r2 > 0.998). The lowest and highest concentrations of calibration curve were selected as LLOQ and ULOQ. LOD was calculated for an S/N ratio of 3, baseline noise was measured at different places of the baseline void of VPA peak. Signal height was converted into concentration through the height of the peak of the VPA at the LLOQ. LOD, LLOQ and ULOQ were 3.2, 6 and 140 (µg/ml), respectively. Obtained results are presented in Table 2.
Table 2.
Quantitative features of proposed method for valproic acid determination in plasma samples
| Parameter | Valproic acid |
|---|---|
| Linear range (µg/ml) | 6–140 |
| Slope | 724.2 |
| Slope standard errors | 13.65 |
| Intercept | 65.59 |
| Intercept standard errors | 5.32 |
| Correlation coefficient (r2) | 0.998 |
| Number of data points | 10 |
| LOD (µg/ml) | 3.2 |
| LLOQ (µg/ml) | 6.0 |
| ULOQ (µg/ml) | 140.0 |
Precision and accuracy
The mean intra- and inter-day assay precisions for all QC samples were determined at low (8 µg/ml), medium (40 µg/ml) and high (120 µg/ml) concentration levels of VPA and were expressed as RSD%. By comparing the calculated QC concentrations with nominal values, accuracies were obtained by computing the relative errors (REs). RSD% and RE% were less than 11.5% and 7.5%, respectively. The results were given in Table 3.
Table 3.
Intra- and inter-day analytical precision and accuracy of proposed method for determination of valproic acid in plasma samples
| Nominal concentration (µg/ml) (n=5) | Inter-assay precision (RSD %) (n=15) | Intra-assay precision (RSD %) (n=5) | Accuracy (RE %) |
|---|---|---|---|
| 8 | 8.7 | 11.5 | 7.5 |
| 40 | 2.8 | 5.7 | 5.4 |
| 120 | 0.8 | 1.2 | 1.8 |
Specificity and selectivity
The specificity of the method was evaluated by analyzing batches of blank plasma and the results demonstrated that there is no significant interference at the retention time of VPA. Some of the most frequently used antiepileptic drugs (AEDs) such as gabapentin, lamotrigine; phenobarbital, primidone, carbamazepine, and phenytoin are used in VPA combination therapy.
Presence of non-volatile and basic drugs poses no problems due to the very different characteristics of the AEDs (boiling point, pKa and volatility) (39). These drugs show no interference with the present analysis because basic drugs get ionized in acidic medium, thus this form is poorly extracted and in most cases, chromatography of above mentioned drugs without prior derivatization is not possible.
Recovery
RRs of VPA spiked in plasma at three concentration levels were calculated by comparing real values with those measured using the present extraction procedure. The RRs% for VPA were between 97 and 107.5%. From recovery data in Table 4, it can be found that the method allows determination of VPA in a complex matrix (plasma) without a significant matrix effect. Figure 8 shows typical chromatograms of a blank plasma and plasma spiked with 20 µg/ml VPA after DLLME.
Table 4.
Relative recoveries of valproic acid obtained by proposed method in plasma samples spiked at 8, 40 and 120 µg/ml
| Nominal concentration (µg/ml) (n=5) | Found concentration (µg/ml) ± SD (n=5) | Accuracy (RE %) | Relative recovery (RR%) ± SD |
|---|---|---|---|
| 8 | 8.6±0.02 | 7.5 | 107.5±0.02 |
| 40 | 38.8±0.04 | -3 | 97±0.03 |
| 120 | 118.4±0.05 | -1.3 | 98.7±0.05 |
SD: Standard deviation
Figure 8.
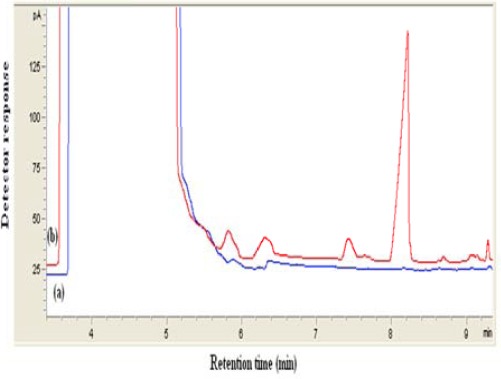
Typical chromatogram obtained from spiked plasma extracted by proposed method. (a) blank (b) plasma sample spiked with sodium valproate (20 µg/ml). In both cases DLLME method was performed and 1 µl of the collected phase was injected into GC. Extraction conditions: extraction solvent, chloroform (40 µl); disperser solvent, acetone (1 ml); sample volume,10 ml; pH, 1.0; concentration of NaCl, 4% (w/v); extraction time, ~0 min; centrifugation speed, 6000 rpm; centrifugation time, 6 min
Stability study
Stability was also investigated in three levels of VPA and after different storage conditions; short-term (12 hr) room temperature and three freeze-thaw (-20 to 25 °C) cycles. According to the obtained results no significant degradation was observed for VPA under different storage conditions. The results are given in Table 5.
Table 5.
Stability data for valproic acid in plasma samples obtained by the proposed method
| Room temperature stability | Freeze–thaw stability | |||||
|---|---|---|---|---|---|---|
| Nominal concentration (µg/ml) (n=3) | Found concentration (µg/ml) ± SD | Accuracy (RE %) | Relative recovery (%) ± SD | Found concentration (µg/ml) ± SD | Accuracy (RE %) | Relative recovery (%) ± SD |
| 8 | 8.8±0.04 | 10 | 110±0.09 | 8.6±0.05 | 7.5 | 107.5± 0.12 |
| 40 | 38.8±0.06 | -3 | 97±0.05 | 38.0± 0.11 | -5 | 95± 0.09 |
| 120 | 113.8±0.05 | -5.2 | 94.8±0.07 | 116.4± 0.06 | -3 | 97± 0.08 |
Robustness of the method
Robustness of the method was checked by varying method parameters such as pH of sample solution, ionic strength, centrifugation rate, and time. Effects of the following changes in extraction conditions were determined: NaCl content in sample solution adjusted by (±1% w/v), sample solution pH adjusted by (up to +0.5 and +1 pH units), centrifugation rate and time adjusted by (± 1000 rpm and ±1 min), respectively. Results presented in Table 6 show RRs% at these conditions were all below 96.5 % and these changes are within the limits that produce acceptable results.
Table 6.
Evaluation of the proposed method robustness for extraction and analysis of valproic acid in spiked plasma samples
| Level | Nominal concentration (µg/ml) (n=3) | Found concentration (µg/ml) ± SD (n=3) | Accuracy (RE %) | Relative recovery (%) ± SD |
|---|---|---|---|---|
| 1 | 8 | 7.5±0.08 | -6 | 94.0± 0.06 |
| 2 | 8 | 7.7± 0.07 | -3.5 | 96.5± 0.09 |
| 3 | 8 | 7.2± 0.06 | -9.8 | 90.2± 0.07 |
1: pH=1.5, 3% (w/v) NaCl, speed and time of centrifugation: 5000 rpm for 5 min
2: pH=1, 4% (w/v) NaCl, speed and time of centrifugation: 6000 rpm for 6 min
3: pH=2, 5% (w/v) NaCl, speed and time of centrifugation: 7000 rpm for 7 min
Analysis of a patient’s sample
In order to evaluate method performance for the monitoring of VPA in real samples, plasma sample of an epileptic patient was extracted according to the proposed method. The patient had plasma level of 17 µg/ml. Figure 9 shows typical chromatogram of a real sample. Note that no interfering peaks in the retention time of VPA are observed and the appearance of the chromatogram is very similar to those of spiked plasma in Figure 8. It can be found that this method is applicable for the determination of VPA levels in patient plasma for therapeutic purposes.
Figure 9.

Typical chromatogram obtained from real plasma sample extracted by proposed method. (a) belongs to the drug-free plasma sample and (b) belongs to the plasma sample from patient with epilepsy. Experimental conditions were the same as those described in Figure 8
Discussion
This work explains a well-known microextrac-tion procedure (DLLME) for quantification of VPA in plasma samples. Plasma samples are more challenging in this respect because plasma can emulsify organic solvents to some extent. Thus, the problems associated with the matrix effects should be reduced in quantitative bioanalysis. The optimized method presents an improvement in work-flow compared to common applied sample preparation and analysis techniques, i.e., SPE followed by liquid chromatography with tandem mass spectrometry. This carefully conducted work is presented in a very concise and clear way so that it could be used as a guideline for method development and validation in similar fields. With comparison of the proposed method with others, it was found that for a number of GC methods (5, 22, 23) cited in Table 7, column deactivation and chemical derivatization of VPA could be a restriction factor when compared with the proposed method, especially for routine analysis. Methods reported in references (11, 15, 16, 23) have used more sophisticated instrumentations and time-consuming sample preparation procedures. It should be noted that MS is not available in all laboratories and is not routine like FID. CE-CD methods with DLLME and/or PPT (18, 19) employed contactless conductivity detection, which is not a standard detection system available on commercial CE instruments. Four GC-FID based methods (26–28, 40) were also reported for determination of VPA in plasma samples. As it can be seen, all of these methods require a long extraction time to reach equilibrium of analyte from the sample matrix.
Table 7.
Comparison of the proposed method with other methods
| Method | Sample | Validation | Linear range / (µg/ml) | Extraction time / min | LOD / (µg/ml) | Ref |
|---|---|---|---|---|---|---|
| LLE-GC-FIDa | Human serum | No method validation | 10-160 | 5 | 5 | (5) |
| LLE-HPLC-UVb | Human plasma | No stability test | 1.25-320 | 4 | 0.10 | (11) |
| SPE-LC-MS-MSc | Human plasma | Yes | 2-200 | NRj | NR | (15) |
| SPE-LC-MS-MS | Human plasma | Yes | 2.03-152.25 | NR | NR | (16) |
| PPT-CE-CDd | Human plasma | No selectivity, stability test | 2-150 | ~0 | 0.024 | (18) |
| DLLME-CE-CDe | Human plasma | No method validation | 0.40-300 | ~0 | 0.08 | (19) |
| LLE-GC-FID | Human plasma | No selectivity test | 0.45-100 | 5 | 0.15 | (22) |
| HS-SPME-GC-MSf | Human plasma | No selectivity, stability test | 2-100 | 20 | NR | (23) |
| HS-SPME-GC-FIDg | Human serum | No method validation | 0.20-100 | 15 | 0.07 | (26) |
| HS-SPME-GC-FID | Human serum | No method validation | 0.25-100 | 10 | 1.7 | (27) |
| HF-LPME-GC-FIDh | Rat plasma | No method validation | 0.05-10 | 30 | 0.017 | (28) |
| HS-LPME-GC-FIDi | Human serum | No method validation | 2-20 | 20 | 0.80 | (40) |
| DLLME-GC-FID | Human plasma | Yes | 6-140 | ~0 | 3.2 | This work |
LLE-GC-FID: Liquid liquid extraction- gas chromatography- flame ionization detector
LLE-HPLC-UV: Liquid liquid extraction-high performance liquid chromatography-ultraviolet detection
SPE-LC-MS-MS: Solid-phase extraction- liquid chromatography-tandem mass spectrometry
PPT-CE-CD: Protein precipitation-capillary electrophoresis-contactless conductivity detection
DLLME-CE-CD: Dispersive liquid-liquid microextraction-capillary electrophoresis-contactless conductivity detection
HS-SPME-GC-MS: Headspace -solid-phase microextraction-gas chromatography-mass spectrometry
HS-SPME-GC-FID: Headspace -solid-phase microextraction-gas chromatography- flame ionization detector
HF-LPME-GC-FID: Hollow fiber-liquid-phase microextraction-gas chromatography-flame ionization detector
HS-LPME-GC-FID: Headspace -liquid-phase microextraction-gas chromatography-flame ionization detector
NR: Not reported
In addition, a few of the reported works carried out full validation concerning FDA and/or ICH guidelines. Hence, the importance of this validated method is the rapidity of sample preparation and the simplicity and versatility of instrumental setup that make feasible the determination of this analyte in real samples.
Conclusion
In this study, DLLME method followed by GC-FID analysis was established for determination of VPA in human plasma. Compared with the other methods, this technique provided several advantages including simplicity of operation, less solvent and time-consumption, low cost and excellent sample clean-up for the detection of VPA in plasma and in the its therapeutic range. Therefore, the validated method can be utilized as a routine analytical method in therapeutic drug monitoring studies.
Acknowledgment
The authors would like to thank the Iranian Blood Transfusion Research Center, Tabriz, Iran for donating drug-free plasma samples.
References
- 1.Macdonald RL, Kelly KM. Antiepileptic drug mechanisms of action. Epilepsia. 1995;36:S2–S12. doi: 10.1111/j.1528-1157.1995.tb05996.x. [DOI] [PubMed] [Google Scholar]
- 2.Johannessen CU, Johannessen SI. Valproate: past, present, and future. CNS Drug Rev. 2003;9:199–216. doi: 10.1111/j.1527-3458.2003.tb00249.x. [DOI] [PMC free article] [PubMed] [Google Scholar]
- 3.Warner A, Privitera M, Bates D. Standards of laboratory practice: antiepileptic drug monitoring. Clin Chem. 1998;44:1085–1095. [PubMed] [Google Scholar]
- 4.Löscher W. Valproate: a reappraisal of its pharmacodynamic properties and mechanisms of action. Prog Neurobiol. 1999;58:31–59. doi: 10.1016/s0301-0082(98)00075-6. [DOI] [PubMed] [Google Scholar]
- 5.Arranz Peña MI. Rapid gas chromatographic determination of valproic acid in serum. J Chromatogr. 1981;225:459–462. doi: 10.1016/s0378-4347(00)80296-0. [DOI] [PubMed] [Google Scholar]
- 6.Kumps AH. Therapeutic drug monitoring: a comprehensive and critical review of analytical methods for anticonvulsive drugs. J Neurol. 1982;228:1–16. doi: 10.1007/BF00313405. [DOI] [PubMed] [Google Scholar]
- 7.Krasowski MD. Therapeutic drug monitoring of the newer anti-epilepsy medications. Pharmaceu-ticals. 2010;3:1909–1935. doi: 10.3390/ph3061908. [DOI] [PMC free article] [PubMed] [Google Scholar]
- 8.Musenga A, Saracino MA, Sani G, Raggi MA. Antipsychotic and antiepileptic drugs in bipolar disorder: the importance of therapeutic drug monitoring. Curr Med Chem. 2009;16:1463–1481. doi: 10.2174/092986709787909604. [DOI] [PubMed] [Google Scholar]
- 9.Kang J, Park YS, Kim SH, Kim SH, Jun MY. Modern methods for analysis of antiepileptic drugs in the biological fluids for pharmacokinetics, bioequival-ence and therapeutic drug monitoring. Korean J Physiol Pharmacol. 2011;15:67–81. doi: 10.4196/kjpp.2011.15.2.67. [DOI] [PMC free article] [PubMed] [Google Scholar]
- 10.Regenthal R, Krueger M, Koeppel C, Preiss R. Drug Levels: therapeutic and toxic serum/plasma concentrations of common drugs. J Clin Monit Comput. 1999;15:529–544. doi: 10.1023/a:1009935116877. [DOI] [PubMed] [Google Scholar]
- 11.Amini H, Javan M, Ahmadiani A. Development and validation of a sensitive assay of valproic acid in human plasma by high-performance liquid chromatography without prior derivatization. J Chromatogr B. 2006;830:368–371. doi: 10.1016/j.jchromb.2005.11.028. [DOI] [PubMed] [Google Scholar]
- 12.Kushida K, Ishizaki T. Concurrent determination of valproic acid with other antiepileptic drugs by high-performance liquid chromatography. J Chromatogr. 1985;338:131–139. doi: 10.1016/0378-4347(85)80077-3. [DOI] [PubMed] [Google Scholar]
- 13.Lin MC, Kou HS, Chen CC, Wu SM, Wu HL. Simple and sensitive fluorimetric liquid chromatography method for the determination of valproic acid in plasma. J Chromatogr B. 2004;810:169–172. doi: 10.1016/j.jchromb.2004.07.025. [DOI] [PubMed] [Google Scholar]
- 14.Wolf JH, Veenma-van der Duin L, Korf J. Automated analysis procedure for valproic acid in blood, serum and brain dialysate by high-performance liquid chromatography with bromomethylmethoxycoumarin as fluorescent label. J Chromatogr. 1989;487:496–502. doi: 10.1016/s0378-4347(00)83061-3. [DOI] [PubMed] [Google Scholar]
- 15.Jain D, Subbaiah G, Sanyal M, Shrivastav P. A high throughput and selective method for the estimation of valproic acid an antiepileptic drug in human plasma by tandem LC–MS/MS. Talanta. 2007;72:80–88. doi: 10.1016/j.talanta.2006.09.033. [DOI] [PubMed] [Google Scholar]
- 16.Gao S, Miao H, Tao X, Jiang B, Xiao Y, Cai F, et al. LC–MS/MS method for simultaneous determination of valproic acid and major metabolites in human plasma. J Chromatogr B. 2011;879:1939–1944. doi: 10.1016/j.jchromb.2011.05.022. [DOI] [PubMed] [Google Scholar]
- 17.Cheng H, Liu Z, Blum W, Byrd JC, Klisovic R, Grever MR, et al. Quantification of valproic acid and its metabolite 2-propyl-4-pentenoic acid in human plasma using HPLC-MS/MS. J Chromatogr B. 2007;850:206–212. doi: 10.1016/j.jchromb.2006.11.027. [DOI] [PubMed] [Google Scholar]
- 18.Belin GK, Krähenbühl S, Hauser PC. Direct determination of valproic acid in biological fluids by capillary electrophoresis with contactless conductivity detection. J Chromatogr B. 2007;847:205–209. doi: 10.1016/j.jchromb.2006.10.003. [DOI] [PubMed] [Google Scholar]
- 19.Pham TTT, See HH, Morand R, Krähenbühl S, Hauser PC. Determination of free and total valproic acid in human plasma by capillary electrophoresis with contactless conductivity detection. J Chromatogr B. 2012;907:74–78. doi: 10.1016/j.jchromb.2012.08.037. [DOI] [PubMed] [Google Scholar]
- 20.Degel F, Heidrich R, Schmid RD, Weidemann G. Quantitative determination of valproic acid by means of gas chromatographic headspace analysis. Clin Chim Acta. 1984;139:29–36. doi: 10.1016/0009-8981(84)90189-x. [DOI] [PubMed] [Google Scholar]
- 21.Cooreman S, Cuypers E, De Doncker M, Van Hee P, Uyttenbroeck W, Neels H. Comparison of three immunoassays and one GC-MS method for the determination of valproic acid. Immuno-Anal Biol Spe. 2008;23:240–244. [Google Scholar]
- 22.Ahmadkhaniha R, Rastkari N, Kobarfard F, Pakdaman H, Ahmadkhaniha O, Kebriaeezadeh A. An improved GC method for rapid analysis of valproic acid in human plasma without derivatization. Iran J Pharm Sci. 2007;9:37–42. [Google Scholar]
- 23.Deng C, Li N, Ji J, Yang B, Duan G, Zhang X. Development of water-phase derivatization followed by solid-phase microextraction and gas chromatography/mass spectrometry for fast determination of valproic acid in human plasma. Rapid Commun Mass Spectrom. 2006;20:1281–1287. doi: 10.1002/rcm.2451. [DOI] [PubMed] [Google Scholar]
- 24.Ho TS, Pedersen-Bjergaard S, Rasmussen KE. Liquid-phase microextraction of protein-bound drugs under non-equilibrium conditions. Analyst. 2002;127:608–613. doi: 10.1039/b110105f. [DOI] [PubMed] [Google Scholar]
- 25.Krogh M, Johansen K, Tønnesen F, Rasmussen KE. Solid-phase microextraction for the determination of the free concentration of valproic acid in human plasma by capillary gas chromatography. J Chromatogr B. 1995;673:299–305. doi: 10.1016/0378-4347(95)00273-8. [DOI] [PubMed] [Google Scholar]
- 26.Matin AA, Biparva P, Amanzadeh H, Farhadi K. Zinc/Aluminum layered double hydroxide–titanium dioxide composite nanosheet film as novel solid phase microextraction fiber for the gas chromatographic determination of valproic acid. Talanta. 2013;103:207–213. doi: 10.1016/j.talanta.2012.10.034. [DOI] [PubMed] [Google Scholar]
- 27.Farajzadeh MA, Farhadi K, Matin AA, Hashemi P, Jouyban A. Headspace solid-phase microextraction-gas chromatography method for the determination of valproic acid in human serum, and formulations using hollow-fiber coated wire. Anal Sci. 2009;25:875–879. doi: 10.2116/analsci.25.875. [DOI] [PubMed] [Google Scholar]
- 28.Jahangiri S, Hatami M, Farhadi K, Bahram M. Hollow-fiber-based LPME as a reliable sampling method for gas chromatographic determination of pharmacokinetic parameters of valproic acid in rat plasma. Chromatographia. 2013;76:663–669. [Google Scholar]
- 29.Sobhi HR, Kashtiaray A, Farahani H, Abrahimpour F, Esrafili A. Quantitation of valproic acid in pharmaceutical preparations using dispersive liquid-liquid microextraction followed by gas chromatography-flame ionization detection without prior derivatization. Drug Test Anal. 2010;2:362–366. doi: 10.1002/dta.131. [DOI] [PubMed] [Google Scholar]
- 30.Namera A, Saito T. Recent advances in unique sample preparation techniques for bioanalysis. Bioanalysis. 2013;5:915–932. doi: 10.4155/bio.13.52. [DOI] [PubMed] [Google Scholar]
- 31.Ashri NY, Abdel-Rehim M. Sample treatment based on extraction techniques in biological matrices. Bioanalysis. 2011;3:2003–2018. doi: 10.4155/bio.11.201. [DOI] [PubMed] [Google Scholar]
- 32.Lord H, Pawliszyn J. Evolution of solid-phase microextraction technology. J Chromatogr A. 2000;885:153–193. doi: 10.1016/s0021-9673(00)00535-5. [DOI] [PubMed] [Google Scholar]
- 33.Arthur CL, Pawliszyn J. Solid phase microextraction with thermal desorption using fused silica optical fibers. Anal Chem. 1990;62:2145–2148. [Google Scholar]
- 34.Jeannot MA, Cantwell FF. Solvent microextraction into a single drop. Anal Chem. 1996;68:2236–2240. doi: 10.1021/ac960042z. [DOI] [PubMed] [Google Scholar]
- 35.He Y, Lee HK. Liquid-phase microextraction in a single drop of organic solvent by using a conventional microsyringe. Anal Chem. 1997;69:4634–4640. [Google Scholar]
- 36.Sarafraz-Yazdi A, Amiri A. Liquid-phase microextraction. Trends Anal Chem. 2010;29:1–14. [Google Scholar]
- 37.Rezaee M, Assadi Y, Milani Hosseini MR, Aghaee E, Ahmadi F, Berijani S. Determination of organic compounds in water using dispersive liquid–liquid microextraction. J Chromatogr A. 2006;1116:1–9. doi: 10.1016/j.chroma.2006.03.007. [DOI] [PubMed] [Google Scholar]
- 38.Berijani S, Assadi Y, Anbia M, Milani Hosseini MR, Aghaee E. Dispersive liquid-liquid microextraction combined with gas chromatography-flame photometric detection. Very simple, rapid and sensitive method for the determination of organophosphorus pesticides in water. J Chromatogr A. 2006;1123:1–9. doi: 10.1016/j.chroma.2006.05.010. [DOI] [PubMed] [Google Scholar]
- 39.Volmut J, Matisová E, Pham Thi Ha. Simultaneous determination of six antiepileptic drugs by capillary gas chromatography. J Chromatogr B. 1990;527:428–435. doi: 10.1016/s0378-4347(00)82127-1. [DOI] [PubMed] [Google Scholar]
- 40.Shahdousti P, Mohammadi A, Alizadeh N. Determination of valproic acid in human serum and pharmaceutical preparations by headspace liquid-phase microextraction gas chromatography-flame ionization detection without prior derivatization. J Chromatogr B. 2007;850:128–133. doi: 10.1016/j.jchromb.2006.11.013. [DOI] [PubMed] [Google Scholar]


