Abstract.
Biofilm formation has been linked to ventilator-associated pneumonia, which is a prevalent infection in hospital intensive care units. Currently, there is no rapid diagnostic tool to assess the degree of biofilm formation or cellular biofilm composition. Optical coherence tomography (OCT) is a minimally invasive, nonionizing imaging modality that can be used to provide high-resolution cross-sectional images. Biofilm deposited in critical care patients’ endotracheal tubes was analyzed in vitro. This study demonstrates that OCT could potentially be used as a diagnostic tool to analyze and assess the degree of biofilm formation and extent of airway obstruction caused by biofilm in endotracheal tubes.
Keywords: optics, biofilm, optical coherence tomography, endotracheal tube, ventilator-associated pneumonia
1. Introduction
Biofilm formation in the inner lumen of endotracheal tubes has been linked to ventilator-associated pneumonia (VAP), which is a prevalent infection in hospital intensive care units (ICUs) that results in an increase in cost of hospital stay and increased morbimortality.1 Biofilms initially form when microorganisms attach to a synthetic surface, multiply, and develop an extracellular polymeric substance matrix that colonizes the growth of bacteria.2 The presence of endotracheal tubes in intubated patients increases the chances of contracting VAP due to a functionally compromised mucociliary system that would otherwise hamper formation of bacteria biofilm in the airway. It has been shown that these biofilms can be characterized by scanning electron microscopy (SEM) in vitro but require a sample drying and gold sputtering sample preparation process that can be a lengthy and arduous task and cannot be performed in vivo.1 Optical coherence tomography (OCT), a noninvasive, nonionizing tomographic imaging technology, can provide micrometer high-resolution cross-sectional images of various biological samples. It has been shown that OCT can be adapted to a rotational endoscopic probe–based system that can provide high-resolution three-dimensional volumetric information.3 The aim of this study is to utilize OCT as a tool to visualize the presence of biofilm in endotracheal tubes. The eventual goal of this study would be to image biofilm formation on the inner lumen of intubated endotracheal tubes in vivo and to correlate the progression of biofilm formation to nosocomial pneumonia in critical care patients.
2. Materials and Methods
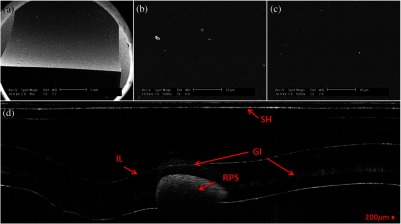
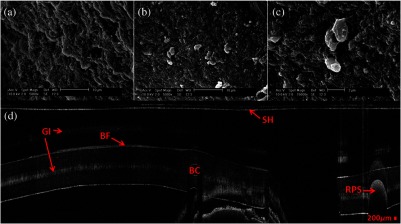
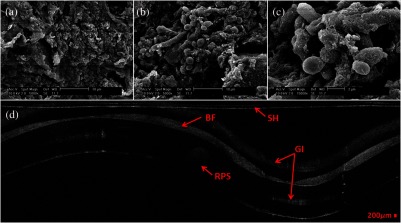
OCT and SEM images were collected from three endotracheal tube samples before intubation: patient A’s tube extubated 24-h postintubation, patient B’s tube extubated 120-h postintubation, and a sealed endotracheal tube to serve as a control (see Figs. 1–3). It should be noted that these patients were not prospectively enrolled in this study. Extubated patients’ endotracheal tubes (Portex, sizes 7.5 to 8 mm) were obtained from critical care patients at UCI Medical Center ICU and were transported (- to 40-min travel time) in a sealed moist environment to the site of imaging (UCI IBC 2014-1484). The tubes were then secured onto a sterile fabric chuck and imaged with a side-viewing helical scanning probe and OCT system previously described in Ref. 4. Briefly, a 1310-nm center wavelength swept source with 50-kHz sweep rate and 100-nm bandwidth laser source was used in a fiber-based Michelson interferometer. The OCT system and probe had an axial resolution of in biofilm and a lateral resolution of . In addition, an acousto-optic modulator was used on the OCT system’s reference arm to provide a carrier frequency of 150 MHz for the OCT signal to take advantage of the full coherence length of the laser source. After OCT imaging, the samples were prepared for SEM using a standard dehydration and gold sputtering protocol. Samples of endotracheal tube were segmented using a surgical blade, then fixed in 10% buffered formalin phosphate formaldehyde for 1 h, placed in sodium phosphate buffer for 24 h, and air-dried in a sterile hood. Next, samples were placed into 1% osmium tetroxide in double-distilled water for 1 h. Following osmium tetroxide, the samples were placed in an increasing concentration of ethanol solutions (EtOH 30%, 50%, 70%, 90%, and 100%) for 10 min at each concentration. Finally, each sample was placed into four mixtures of EtOH and hexamethyldisilazane (67% EtOH and 33% HMDS, 50% EtOH and 50% HMDS, 33% EtOH and 67% HMDS, 100% HMDS) for 15 min each. Samples were then gold sputtered (Cressington 308R, Ted Pella Inc.) to a thickness of 9 nm. SEM was then conducted on samples (Phillips XL-30 Field Emission ESEM) at 10,000 keV with variable levels of magnification, namely 5000, 10,000, and 15,000.
Fig. 1.
IL, inner lumen of ET tube; SH, probe sheath; RPS, radiopaque strip; and GI, ghost image. (a) scanning electron microscopy (SEM) image of sealed endotracheal tube segment; (b) SEM image of same endotracheal tube showing dust debris and the absence of an extracellular polymeric substrate as well as bacteria cells; (c) SEM of same endotracheal tube in different location; and (d) corresponding optical coherence tomography (OCT) image.
Fig. 2.
BF, biofilm; SH, probe sheath; RPS, radiopaque strip; GI, ghost image; and BC, baloon inflating channel; (a) SEM image of 24-h postintubation endotracheal tube showing the presence of extracellular polymeric substrate; (b) SEM image of same endotracheal tube in a different location; (c) SEM of same endotracheal tube focusing in on cluster of cells; and (d) corresponding OCT image.
Fig. 3.
BF, biofilm; SH, probe sheath; RPS, radiopaque strip; and GI, ghost image; (a) SEM image of 120-h postintubation endotracheal tube showing the presence of extracellular polymeric substrate; (b) SEM image of same endotracheal tube in a different location; (c) SEM of same endotracheal tube focusing in on a cluster of cells; and (d) corresponding OCT image.
3. Demonstration
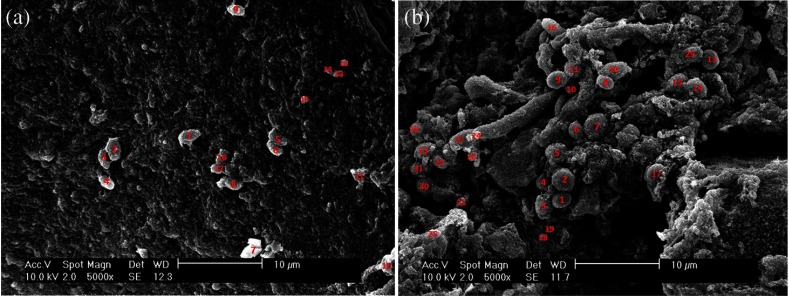
Biofilm is present in both OCT and SEM images (Figs. 2 and 3). In OCT images, biofilm is indicated in Figs. 2(d) and 3(d) by a sharp increase in reflected OCT signal above the inner lumen of the endotracheal tube indicated by the label BF, as also shown in Ref. 5. In SEM images, Figs. 2(a)–2(c) and 3(a)–3(c) show the presence of biofilm from the OCT imaged tubes that can be seen through the presence of extracellular polymeric matrix encapsulating bacteria cell population. It should be noted that the SEM data for the control sealed endotracheal tube (Fig. 1) have some dust debris artifacts that could be mistaken for cells present. The average size of single bacteria and cellular population density was identified and measured in SEM images (Fig. 4; Image J, National Institutes of Health). A mean cellular diameter of with a standard deviation of was measured and correlates well with previous bacteria characterization literature of bacteria commonly found in biofilms.6,7 An increase in cellular density was observed through magnification SEM data between 1- and 5-day intubation endotracheal tubes.
Fig. 4.
(a) SEM image of endotracheal tube extubated after a period of 1-day intubation. (b) SEM image of an endotracheal tube extubated after 5 days of intubation. Red numbering in both images indicates a bacterial cell that is counted toward cellular density and average cell diameter.
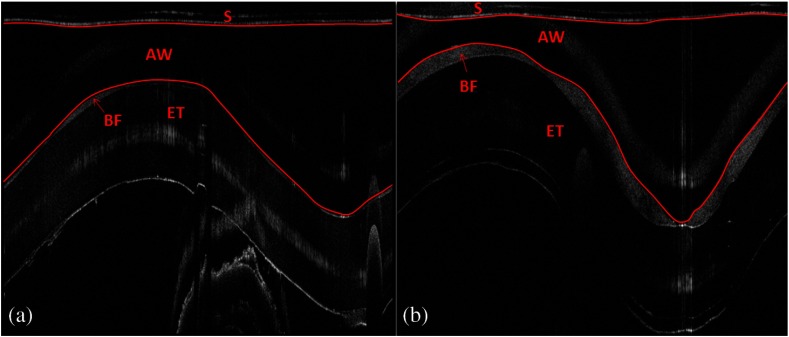
Endotracheal tube two-dimensional airway obstruction was assessed utilizing the intensity-based OCT images and an image processing algorithm developed in MATLAB (MathWorks, Natick, Massachusetts). The number of pixels between the sheath (Zeus 20 AWG FEP, nominal O.D 1.01 mm) and the biofilm were calculated for each A-line in a single B-scan manually by tracing out the biofilm layer in a MATLAB script (Fig. 5). Because the position of the sheath is known and the contour of the biofilm was identified, it is possible to calculate the number of pixels between the two surfaces. Having measured the axial resolution of the OCT system to be , a physical quantity for the measured distance between the sheath and the biofilm could be provided. This value, added to the radius of the sheath (0.505 mm), was then used as the radius to calculate the area of a sector that each vertical column or A-line represents. All of the circular sectors for a single B-scan area were calculated and added together to represent the total area of the endotracheal tube not obstructed by the biofilm surface. The percent change of area was then calculated with respect to the inner lumen area of a control endotracheal tube. It was found that there was a reduction in endotracheal inner lumen area by a percent change of 1.64% and 8.14% for the 1- and 5-day intubation endotracheal tubes, respectively.
Fig. 5.
S, probe sheath; BF, biofilm; ET, endotracheal tube; and AW, airway between probe sheath and biofilm; (a) OCT B-scan of 1-day intubated endotracheal tube; (b) OCT B-scan of 5-day intubated endotracheal tube, with red lines in both images representing the boundary that was measured for airway obstruction calculation.
4. Conclusion and Future Work
It has been shown that OCT can detect the presence of biofilm and that we could gather further information about the extent of biofilm formation from the thickness of biofilm observed. Through this study, it has been shown that OCT could potentially be used as a tool to assess the extent of biofilm formation and airway obstruction. There may be a component of secretions in the endotracheal tubes, as it is not yet possible to clearly differentiate thin secretion coating from biofilm. However, either could potentially serve as a subsequent source of bacterial contamination of the lower airway and increased endotracheal tube resistance. Using OCT intensity-based images, we plan to analyze the thickness and structure of the biofilm at which intubated patients in the ICU contract VAP. Additionally, future work will be done to further analyze biofilm subcomponents using fluorescent lifetime imaging (FLIM). By using FLIM, we can potentially separate out bacterial phenotypes based on their relative autofluorescent lifetime signatures. In addition, relative bacteria concentrations can also be determined by a fluorescent intensity measure.
Acknowledgments
The authors would like to acknowledge the Lih-Huei “leacky” Liaw for her instruction on how to prepare and image samples for scanning electron microscopy. This work was based on research supported by BEST IGERT program funded by the National Science Foundation DGE-1144901, NIH (Grant Nos. R01 HL-125084, R01 HL-105215, R01 EY-021529, and P41 EB-015890), and Air Force Office of Scientific Research, Medical Free-Electron Laser Program (Grant No. FA9550-08-1-0384).
Biographies
Andrew E. Heidari is currently conducting doctoral research in Dr. Zhongping Chen’s lab at the Beckman Laser Institute under the University of California, Irvine. His research focus is minimally invasive detection of bacteria biofilms using Optical Coherence Tomography as well as other imaging modalities. He hopes one day to prevent nosocomial infections typically caused by biofilm formation in catheters, tubes and other medical devices.
Lidek Chou is a research engineer in the OCT Laboratory at Beckman Laser Institute. His work involves designing and building OCT (optical coherence tomography) systems and probes for various applications such as upper and lower airway imaging. Several systems he built are regularly used for human and animal clinical studies.
Biographies for the authors are not available.
References
- 1.Souza P. R., et al. , “Endotracheal tube biofilm and ventilator-associated pneumonia with mechanical ventilation,” Microsc. Res. Tech. 77(4), 305–312 (2014). 10.1002/jemt.22344 [DOI] [PubMed] [Google Scholar]
- 2.Gil-Perotin S., et al. , “Implications of endotracheal tube biofilm in ventilator-associated pneumonia response: a state of concept,” Crit. Care 16(3), R93 (2012). 10.1186/cc11357 [DOI] [PMC free article] [PubMed] [Google Scholar]
- 3.Tran P. H., et al. , “In vivo endoscopic optical coherence tomography by use of a rotational microelectromechanical system probe,” Opt. Lett. 29(11), 1236 (2004). 10.1364/OL.29.001236 [DOI] [PubMed] [Google Scholar]
- 4.Jing J., et al. , “High-speed upper-airway imaging using full-range optical coherence tomography,” J. Biomed. Opt. 17(11), 110507 (2012). 10.1117/1.JBO.17.11.110507 [DOI] [PMC free article] [PubMed] [Google Scholar]
- 5.Nguyen C. T., et al. , “Investigation of bacterial biofilm in the human middle ear using optical coherence tomography and acoustic measurements,” Hear. Res. 301, 193–200 (2013). 10.1016/j.heares.2013.04.001 [DOI] [PMC free article] [PubMed] [Google Scholar]
- 6.Harris L. G., Foster S. J., Richards R. G., “An introduction to Staphylococcus aureus, and techniques for identifying and quantifying S. aureus adhesins in relation to adhesion to biomaterials: review,” Eur. Cells Mater. 4, 39–60 (2002). [DOI] [PubMed] [Google Scholar]
- 7.Chi S. Y., et al. , “Bacterial pathogens of ventilator-associated pneumonia in a tertiary referral hospital,” Tuberc. Respir. Dis. 73(1), 32 (2012). 10.4046/trd.2012.73.1.32 [DOI] [PMC free article] [PubMed] [Google Scholar]


