

Abstract
Background
Many differences between different ethnic groups have been observed, such as skin color, eye color, height, susceptibility to some diseases, and response to certain drugs. However, the genetic bases of such differences have been under-investigated. Since the HapMap project, large-scale genotype data from Caucasian, African and Asian population samples have been available. The project found that these populations were located in different areas of the PCA (Principal Component Analysis) plot. However, as an unsupervised method, PCA does not measure the differences in each single nucleotide polymorphism (SNP) among populations.
Results
We applied an advanced mutual information-based feature selection method to detect associations between SNP status and ethnic groups using the latest HapMap Phase 3 release version 3, which included more sub-populations. A total of 299 SNPs were identified, and they can accurately predicted the ethnicity of all HapMap populations. The 10-fold cross validation accuracy of the SMO (sequential minimal optimization) model on training dataset was 0.901, and the accuracy on independent test dataset was 0.895.
Conclusions
In-depth functional analysis of these SNPs and their nearby genes revealed the genetic bases of skin and eye color differences among populations.
Electronic supplementary material
The online version of this article (doi:10.1186/s12864-015-2328-0) contains supplementary material, which is available to authorized users.
Background
A single nucleotide polymorphism (SNP) is defined as a single base change in a DNA sequence that occurs in a significant proportion (more than 1 %) of a large population. SNPs occur at a frequency that ranges from 1 in 1000 to 1 in 100 bases. Recently, the NCBI (National Center for Biotechnology Information) released the SNP-138 database, which contains more than 60 million SNP sites (ftp://ftp.ncbi.nlm.nih.gov/snp/). To our knowledge, over the millions of years of evolution, mutations have occurred occasionally and are maintained or lost by inheritance and natural selection. The more than 60 million SNPs are scattered throughout the entire genome, including −50 % on the coding region and the rest on the non-coding region [1]. Based on the change in amino acid sequence, SNPs in the CDS (coding sequence) region can be divided into 2 classes: synonymous SNPs whose variants do not change the protein sequence and non-synonymous SNPs that change the amino acid sequence [2]. Along with the rapid development of next-generation DNA sequencing technologies, hundreds of thousands of novel human SNPs could be discovered in the next several years [3]. In addition to sequencing technology, GWAS (Genome-Wide Association Study) has been applied to discover disease-related SNPs [4–6]. To the best of our knowledge, functional polymorphisms are used not only to develop useful genetic markers but also to facilitate the outcomes of personalized medicines [7]. In addition, understanding the role of SNPs has been important to understanding the molecular mechanisms of evolution because SNPs could be used as evolution markers [8].
Among humans, 99.9 % of the bases in the entire genome are remarkably similar; it is the remaining 0.1 % of the bases that makes a person unique [9]. Among this 0.1 % of bases, more than 90 % are SNPs [10]. Barbujani et al. estimated that −85 % of SNPs are common to all human populations and that only approximately 15 % of SNPs are population-specific [11]. However, among different populations, specific SNPs account for 15 % of all SNPs, and common SNPs account for 85 % of all SNPs; both types contribute to various characteristics, including drug resistance and skin color [12, 13]. For example, Xu et al. found that the incidence of G6PD deficiency varies among populations because of the different proportions of SNP alleles [14]. Similarly, β-thalassemia exhibits a varied incidence among populations from Delhi (India), Lebanon and Sardinia because of the different predominant alleles in these areas [15–17]. In addition to susceptibility to diseases, physical appearance based on skin/hair color and physique varies among populations, especially those traits observed on different continents [12, 18]. The efforts of several groups have led to the identification of a series of SNPs and their corresponding genes, which may influence human pigmentation phenotypes; these include rs885479 at MC1R, rs16891982 at SLC45A2, rs1545397 at OCA2, rs12913832 at HERC2, rs6119471 at ASIP, and rs1426654 at SLC24A5. [19–24]. Although many pivotal SNPs have been discovered, they are far less important to explaining the differences among populations, such as the differences in physical appearance, disease susceptibility [25], and drug responses [26]. The studies performed in developed Caucasian countries may not apply well to developing African and Asian countries [27].
To systemically investigate the genetic differences among ethnic groups, we analyzed the latest HapMap [28] genotype data, which included more ethnic groups than the early releases and allowed us to explore the structure of the data in more detail. Advanced feature selection methods were applied to identify the different SNPs. Four different model construction methods were tested. Finally, a total of 299 SNPs were selected, and the prediction accuracy with SMO (sequential minimal optimization) evaluated using 10-fold cross validation on the training dataset achieved 0.901, and the accuracy on the independent test dataset was 0.895. Some selected SNPs demonstrated a high potential to be ethnic biomarkers, and the genes closest to those SNPs showed interesting functions, such as keratinization, which may reveal the genetic basis of some of the observed phenotype differences, such as skin color, between different ethnic populations.
Methods
The genotype data set
We downloaded the genomes of different ethnic groups from the HapMap Phase 3 [28] release version 3 (ftp://ftp.hgsc.bcm.tmc.edu/HapMap3-ENCODE/HapMap3/HapMap3v3), which includes 1397 samples and 1,457,897 SNPs among 11 ethnic groups. Because the Chinese and Japanese samples were very similar [28, 29], they (CHB: Han Chinese in Beijing, China, CHD: Chinese in Metropolitan Denver, Colorado and JPT : Japanese in Tokyo, Japan) were combined. To compile an independent test dataset, we randomly chose 15 % of the samples from each population. The other 85 % of the samples formed the training dataset. The final nine ethnic groups and their sample sizes in the training and independent test dataset are shown in Table 1.
Table 1.
The 1397 samples from nine ethnic groups
| Index | Abbreviation | Full Name | Training Sample Size | Independent Test Sample Size |
|---|---|---|---|---|
| 1 | ASW | African ancestry in Southwest USA | 74 | 13 |
| 2 | CEU | Utah residents with Northern and Western European ancestry from the CEPH collection | 140 | 25 |
| 3 | CHB/CHD/JPT | Han Chinese in Beijing, China/ Chinese in Metropolitan Denver, Colorado/Japanese in Tokyo, Japan | 305 | 54 |
| 4 | GIH | Gujarati Indians in Houston, Texas | 86 | 15 |
| 5 | LWK | Luhya in Webuye, Kenya | 94 | 16 |
| 6 | MEX | Mexican ancestry in Los Angeles, California | 73 | 13 |
| 7 | MKK | Maasai in Kinyawa, Kenya | 156 | 28 |
| 8 | TSI | Tuscan in Italy | 87 | 15 |
| 9 | YRI | Yoruban in Ibadan, Nigeria (West Africa) | 173 | 30 |
| Total | 1188 | 209 | ||
The original PED and MAP files (hapmap3_r3_b36_fwd.consensus.qc.poly.ped.gz and hapmap3_r3_b36_fwd.consensus.qc.poly.map.gz) were transformed into a matrix using PLINK [30] with “--recodeA” and read into R using package adegenet [31] (http://cran.r-project.org/web/packages/adegenet/). The genotype matrix was a matrix of 0, 1 and 2, which were the numbers of the minor SNP alleles in that sample.
Irrelevant SNPs were excluded using Cramer’s V coefficient
Because there were too many SNPs and because most of them differed among the ethnic groups, we calculated the Cramer’s V coefficient [32] for each SNP and removed the SNPs with Cramer’s V coefficients smaller than or equal to 0.6.
The Cramer’s V coefficient measured the association between SNP status and ethnic groups and was defined as follows:
| 1 |
where N was the total number of genotype samples, 1397 in our study, k was the number of ethnic groups (k = 9) and r was the number referring to the SNP status (r = 3, for “0 minor allele”, “1 minor allele” and “2 minor allele”). 2 is Pearson’s chi-squared statistic, which can be calculated as follows:
| 2 |
where Oi,j is the number of the occurrences of SNP status j among ethnic group i and Ei,j is the expected occurrences of SNP status j among ethnic group i, which can be calculated as follows:
| 3 |
where ni is the number of samples in ethnic group i and mj is the number of samples with SNP status j.
The Cramer’s V coefficient ranges from 0 to 1, where 0 indicates no association between the SNP status and ethnic group and 1 indicates a complete association between SNP status and ethnic group.
The Cramer’s V coefficients of the 1,457,897 SNPs were calculated using the function CramerV from R package DescTools https://cran.r-project.org/web/packages/DescTools/. The 2,448 SNPs with Cramer’s V coefficients greater than 0.6 on the training dataset were considered to be candidate SNPs and were analyzed using more advanced machine learning based feature selections [33–36] to obtain the optimal discriminating SNPs.
The optimal SNPs were selected using mRMR and IFS
We applied a widely used [37–39] mutual information based method, mRMR (minimal Redundancy Maximal Relevance) [40], to rank the SNPs. The mRMR program was downloaded from http://penglab.janelia.org/proj/mRMR/. Unlike a univariate filter, such as Cramer’s V coefficient, mRMR not only considered the associations between SNPs and ethnic groups but also the redundancies between SNPs.
Ω, Ωs and Ωt were used to denote the entire set of 2,448 (N) candidate SNPs, the selected m SNPs, and the to-be-selected n SNPs, respectively. The relevance of the SNP f from Ωt with ethnic group c can be measured with mutual information [41, 42] (I):
| 4 |
In addition, the redundancy R of the SNP f with the selected SNPs can be calculated as follows:
| 5 |
To obtain the SNP fj from Ωt with maximum relevance with ethnic group c and minimum redundancy with the already-selected SNPs, the mRMR function was defined as follows:
| 6 |
The mRMR feature evaluation is continued for N rounds, and then a ranked SNP list S using the mRMR method is obtained:
| 7 |
The SNP with a smaller index h has a better trade-off between relevance and redundancy and is more important for classifying samples from different ethnic groups.
Based on the top 2,448 mRMR SNPs, we constructed 2,448 classifiers and applied an Incremental Feature Selection (IFS) method [43–47] to identify the optimal SNP set. Candidate SNP set Si = {f1, f2, …, fi}(1 ≤ i ≤ 2, 448) included the top i SNPs.
Based on the prediction performance of each candidate SNP set, an IFS curve was plotted. The x-axis denoted the number of SNPs, and the y-axis denoted the 10-fold cross validation accuracies using these SNPs.
Different predictive models were compared
We used 10-fold cross validation [48, 49] to test the predictive performance of the predictive models on the training dataset and then tested the trained model on the independent test dataset. During 10-fold cross validation, all of the samples were randomly divided into 10 equal parts; in each iteration, nine parts were used to train the classifier, and the remaining part was used for the test. After 10 rounds, all samples were predicted with an ethnic group, and the predicted ethnic groups were compared with the actual ethnic groups. The entire training dataset was used to train the final predictive model, which was then tested on the independent test dataset. Figure 1 showed the flowchart of model construction and performance evaluation. The predictive accuracy of ethnic group i was
| 8 |
Fig. 1.
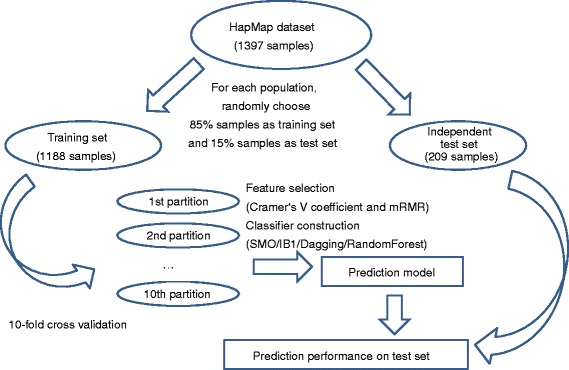
Flowchart for the predictive model construction and performance evaluation. First, we randomly divided the HapMap dataset into the training set (85 % of samples from each population) and independent test set (15 % of samples from each population). Then, the training samples were further partitioned into 10 equally sized partitions for 10-fold cross validation. Based on the training dataset, the features were selected, and the predictive model was constructed. Finally, the constructed model was tested on the independent test dataset
where Ni is the number of samples in ethnic group i and Ti is the number of correctly predicted samples in ethnic group i. The total accuracy [50, 51] was
| 9 |
We constructed the classifiers by using four common predictive methods: SMO (sequential minimal optimization), IB1 (nearest neighbor algorithm), Dagging, and RandomForest (random forest) in Weka [52]. Weka is an easy-to-use software package that integrated various machine learning models and can be downloaded from http://www.cs.waikato.ac.nz/ml/weka/.
The SMO method is an algorithm for building support vector machine (SVM) models [53]. The optimization of an SVM was broken into a series of the sub-problems, which were as small as possible and were then solved analytically [53]. Because there were nine ethnic groups, the prediction problem was multi-class, and pairwise coupling [54] was adopted to construct the multi-class predictive model.
IB1 was an application of the nearest neighbor method [55]. The sample similarity was measured using the normalized Euclidean distance. For a test sample, the ethnic group of a training sample with closest distance was assigned as the predicted ethnic group.
Dagging was used as a meta classifier, and the ethnic group of the test sample was predicted by voting [56]. If the training dataset ℑ included N samples, they were randomly divided into k subsets that each contained n samples (kn ≤ N). In each subset, a basic model Mi(1 ≤ i ≤ k), was trained on these k subsets. A test sample was predicted to be the ethnic group with most votes.
The random forest algorithm [57] was an ensemble predictor with multiple decision trees. If there were N samples and M SNPs in the training set, each tree was trained using n randomly selected samples. At each node, m features were randomly selected and used to optimize the split. The test sample was predicted to be the ethnic group with the most votes from the decision trees.
The IFS prediction accuracies of these four methods were evaluated by 10-fold cross validation and compared, and the selected model was tested on the independent test dataset.
Results and discussion
Identify the relevant SNPs
We analyzed the HapMap genotype data, which included 1,457,897 SNPs on 1397 samples from nine ethnic groups. The sample sizes of each ethnic group in the training dataset and independent test dataset are shown in Table 1. The high dimension of the genotype data makes their analysis difficult and time-consuming. To reduce the SNPs and remove the irrelevant SNPs that did not differ among ethnic groups, we calculated the Cramer’s V coefficient that measured the univariate association between SNP status, i.e., the number of minor alleles, and ethnic group categories in the training dataset. The 2,448 SNPs with Cramer’s V coefficient greater than 0.6 in the training dataset were considered to be relevant and were further optimized.
The SNP set was optimized with the best classifying performance
We applied the mRMR method to rank the 2,448 SNPs. Then, the top SNPs were optimized using the IFS method. The predictive accuracies of the samples and each ethnic group were elevated using 10-fold cross validation. Four widely used predictive models, i.e., SMO, IB1, Dagging and RandomForest, were compared. Their performances based on using different numbers of top SNPs are shown in Fig. 2. IB1 failed to predict LWK and TSI, Dagging performed poorly on ASW, LWK and TSI, and RandomForest did not correctly predict ASW, LWK and TSI. SMO was able to predict all ethnic groups, and its total accuracy was 0.955.
Fig. 2.
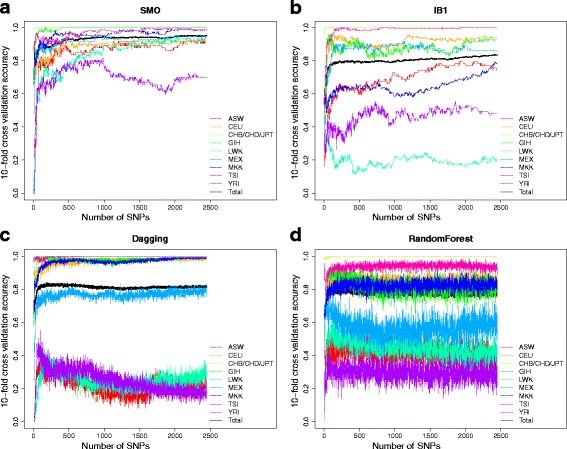
The IFS curves of four different methods. The IFS curves show how the 10-fold cross validation accuracies in each ethnic group (y-axis) change with the number of SNPs (x-axis) using SMO (a), IB1 (b), Dagging (c) and RandomForest (d) methods
In Table 2, the best predictive accuracies of each method are listed. The SMO performed best not only in total accuracy but also for almost every ethnic group. To make sure the great performances of SMO are not specific to a certain partition of training and independent test datasets, we randomly divided the training (85 % of the samples) and independent test (15 % of the samples) datasets for 30 times and for each time, the training and test processes were repeated. The mean and standard deviation of the accuracies on 30 training and independent test datasets were calculated and shown in Additional file 1. The mean accuracies were close to the accuracies of SMO in Table 2 and the standard deviations were very small which indicated that the partition of training and independent test datasets does not affect the prediction performance.
Table 2.
The best predictive performance of the different methods
| Method | #SNP | ASW | CEU | CHB/CHD/JPT | GIH | LWK | MEX | MKK | TSI | YRI | Total |
|---|---|---|---|---|---|---|---|---|---|---|---|
| SMO | 2192 | 0.932 | 0.921 | 1.000 | 1.000 | 0.926 | 0.945 | 0.987 | 0.724 | 0.994 | 0.955 |
| IB1 | 2413 | 0.757 | 0.943 | 1.000 | 0.930 | 0.213 | 0.863 | 0.795 | 0.483 | 1.000 | 0.838 |
| Dagging | 186 | 0.338 | 0.964 | 1.000 | 0.988 | 0.383 | 0.808 | 0.968 | 0.345 | 0.994 | 0.840 |
| RandomForest | 75 | 0.459 | 0.900 | 0.993 | 0.884 | 0.543 | 0.74 | 0.853 | 0.345 | 0.931 | 0.815 |
However, the best SMO model requires too many features. To balance the model complexity and predictive performance, we considered the top 299 SNPs used by the SMO to be the optimal SNP set because subsequently, upon adding more SNPs, the performance did not increase greatly. In other words, the IFS curve shown in Fig. 2a became stable after the top 299 SNPs, and the accuracy was consistently over 90 %. As shown in Table 3, the 10-fold cross validation accuracy of SMO method with the top 299 SNPs on the training dataset was 0.901, and the accuracy on the independent test dataset was 0.895. The 299 SNPs and their annotations, such as dbSNP IDs, minor alleles, chromosome positions and nearby genes (within 500Kb), are provided in Additional file 2.
Table 3.
The predictive performance of the SMO method in the top 299 SNPs in the training and independent test dataset
| Dataset | ASW | CEU | CHB/CHD/JPT | GIH | LWK | MEX | MKK | TSI | YRI | Total |
|---|---|---|---|---|---|---|---|---|---|---|
| Training (10-fold cross validation) | 0.865 | 0.836 | 1.000 | 0.977 | 0.723 | 0.904 | 0.968 | 0.644 | 0.919 | 0.901 |
| Independent test | 0.846 | 0.760 | 1.000 | 1.000 | 0.688 | 1.000 | 0.786 | 0.800 | 1.000 | 0.895 |
The allele frequency differences among ethnic groups
We sought to explore how these 299 SNPs differed among ethnic groups and calculated their minor allele frequency in each ethnic group. In Fig. 3, the top nine SNPs are plotted. The same plot for all 299 SNPs are provided in Additional file 3.
Fig. 3.
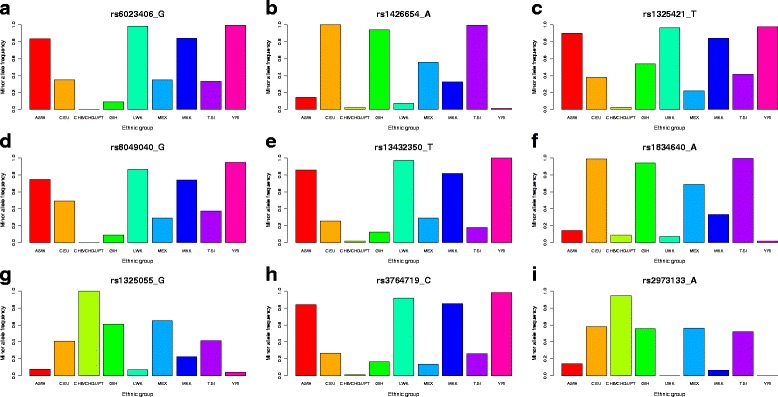
The minor allele frequency of the top nine SNPs in each ethnic group. The minor allele frequencies of the top three SNPs, rs6023406 (a), rs1426654 (b), rs1325421 (c), rs8049040 (d), rs13432350 (e), rs1834640 (f), rs1325055 (g), rs3764719 (h), rs2973133 (i) in the nine ethnic groups were plotted. Each ethnic group has their own specific alleles. For example, the allele frequencies of rs6023406_G, rs1426654_A, rs1325421_T, rs8049040_G, rs13432350_T, rs1834640_A and rs3764719_C were very low, but those of rs1325055_G and rs2973133_A were very high in the Asian population (CHB/CHD/JPT)
As shown in Fig. 3, each ethnic group has its own specific alleles. For example, the allele frequencies of rs6023406_G, rs1426654_A, rs1325421_T, rs8049040_G, rs13432350_T, rs1834640_A and rs3764719_C were very low, but those of rs1325055_G and rs2973133_A were very high in the Asian population (CHB/CHD/JPT).
The biological relevance of likely ethnicity-related SNPs
In our study, 299 SNPs, which varied significantly among different ethnic groups, were identified. Considering the large number of our SNPs, we selected the 9 SNPs that achieved the highest score in our list. The SNP with the highest score (0.861) was rs6023406, which is located in the intron region of the DOX5 gene. As Tabassum R and his colleagues reported, DOX5 was a susceptibility gene for type 2 diabetes [58, 59]. Further, we know that the risk of type 2 diabetes varied greatly among Asian races and European ethnic groups [60, 61]. Globally, some regions, such as South Asians, Pacific Islanders, Latinos, and Native Americans, have a higher likelihood of developing type 2 diabetes [62]. Although the link between the different risk factors of type 2 diabetes and DOX5 was unclear, our findings might offer clues to answer this question.
rs1426654, which is a coding SNP that scores 0.581 and ranks 2nd in our analysis, was located on chromosome 15, where the G- > A transition changes p.A111T in the SLC24A5 protein. Lamason RL et al. revealed that SLC24A5 affects pigmentation in zebrafish and humans [63]. Recently, Wei A et al. identified SLC24A5 as a candidate gene for nonsyndromic oculocutaneous albinism (OSA) [64]. Interestingly, Mikiko S and his group investigated the allele frequency of rs1426654 in Chinese, Sinhalese and Tamils from Sri Lanka, Uygurs, Europeans, and Xhosans (Africans) from South Africa, and Ghanaians using polymerase chain reaction-restriction fragment length polymorphism. They found that the A nucleotide was predominant in the European population but exhibited low levels in the Asian population [65]. Notably, another top-ten SNP rs1834640 (6th place, with a score of 0.436) is located 21327 bp upstream of SLC24A5. Intriguingly, rs1426654 and rs1834640 had highly similar distribution of minor allele frequency among the 9 ethnic groups, which also implied the potential synergistic function of the two SNPs. However, the detailed relationship between rs1426654 (or rs1834640) and pigmentation still needs more experimental evidence.
rs1325421, the 3rd SNP, which scored 0.515 in our analysis, is located downstream from the PREP gene. PREP could reportedly play an important role in many biological processes, such as the maturation and degradation of peptide hormones and neuropeptides, learning and memory, cell proliferation and differentiation, and glucose metabolism [66]. Considering the multiple functions of PREP, it might be altered by rs1325421 and thus manifest different characteristics among different populations.
rs8049040, which ranked 4th place in our data and is located on chr15:48392415, is nearest to gene ZNF23, which was widely reported among multiple types of cancers, including liver and ovarian cancer [67–69]. Interestingly, 2 other SNPs in our top-ten list were related to cancers. One, rs1325055, is an SNP that ranked in 7th place and is located downstream of the FAM135B gene. Song Y. et al. identified the mutation on FAM135B in esophageal squamous cell cancer, which implied a biological function of FAM135B in cancer [70]. The other SNP was rs3764719, ranked in 8th place and located in Rbm38, which is a target of the p53 family and could modulate p53 expression via mRNA translation [71]. Xue JQ et al. found that Rbm38 could act as a tumor suppressor in breast cancer [72]. Furthermore, p53 deficiency was common among many types of cancers [73, 74]. In contrast, it is reported that the risk of several cancers, including breast cancer, colorectal cancer, liver cancer and lung cancer, varied among different ethnic groups [75, 76]. Nevertheless, the underlying mechanism leading to the disparities of cancer incidence remain unclear. The differences of the SNPs that were on or near cancer-related genes may shed light on the variation.
rs13432350, an SNP that ranked 5th in our analysis, is located in EXOC6B. As Evers.C et al. reported, EXOC6B might play an important role in the molecular pathogenesis of intellectual disabilities [77]. Intellectual disabilities affect approximately 2–3 % of the general population, whereas approximately 95 million cases were due to unknown causes [78]. In contrast, the highest incidence of intellectual disability was observed in low- and middle-income countries [79]. Although economic disparities should be considered, differences in SNPs such as rs13432350 may also contribute to the varied risks of intellectual disability.
rs2973133, the 9th-ranked SNP in our data, is located upstream of PRR16 gene. Liu X. et.al reported that dysfunction of PRR16 could lead to Coronary Artery Disease (CAD) [80]. In fact, the incidences of CAD varied significantly among different races; for example, almost 60 % of the world’s cardiovascular disease burden occurs in South Asia, although it only accounts for 20 % of the world’s population [81]. However, the potential underlying reasons were not fully answered, and our finding may provide an alternative explanation for the varied risks of CAD.
In addition to the top-nine SNPs on our lists, several other SNPs have a potential relationship with the varied characteristics among ethnic groups, such as rs12913832, an SNP ranked in 42nd place, which was scored as 0.386 and is located within an intron of the non-pigment gene HERC. Visser M et al. found that rs12913832 modulates human pigmentation by attenuating chromatin-loop formation between a long-range enhancer and the OCA2 promoter [82]. Mengel FJ et al. investigated rs12913832 in 395 randomly selected Danes and found that rs12913832 affects eye color [83]. In addition, Amos C et al. found that the 50 % variability in eye color is associated with variations in the rs12913832 SNP based on their GWAS, in which 1804 melanoma cases and 1026 controls were used [84]. Above all, the results of our analysis could enhance our understanding of the mechanisms of different characteristics among ethnic groups.
The biological relevance of nearby genes
In addition to exploring the SNPs directly, we analyzed the functions of 1,397 genes located within a 500 kb range of the 299 SNPs using DAVID. The results are shown in Table 4. The most enriched gene ontology (GO) biological process (BP) terms were “GO: 0031424 keratinization” and “GO: 0030216 keratinocyte differentiation” [85]. During keratinization, keratinocytes become cornified as keratin protein is incorporated into longer keratin intermediate filaments; they eventually undergo apoptosis and become fully keratinized [86]. Keratinization is indispensable to the development of the epidermis and for hair growth [87]. Therefore, we speculated that the various SNPs may contribute to the differences in hair or skin characteristics among populations by affecting the critical genes related to keratinization. Furthermore, some diseases were also related to keratinization, such as pachyonychia congenita (PC), dyskeratosis congenita (DC), and Darier’s disease [88–90]. Although no population pattern about these diseases have been reported, our results indicated potential possibilities for the population distribution of these diseases. In addition to keratinization, the “GO:0030855: epithelial cell differentiation” and “GO: 0009913 epidermal cell differentiation” were included at the top of our list. Several skin disorders, such as epidermolytic hyperkeratosis and epidermolysis bullosa simplex, occur if epidermis development is disrupted [91]. The most enriched GO cellular component (CC) term was “GO: 0001533 cornified envelope”. To our knowledge, the cornified envelope is a structure that forms beneath the plasma membrane in terminally differentiating stratified squamous epithelia, and it is essential for effective physical and water barrier function in the skin [92]. We surmised that these components could contribute to these differences, especially those that are directly or indirectly related to skin color diversity among populations.
Table 4.
Gene ontology enrichments of genes close to the 427 SNPs
| Term | P Value | Fold Enrichment | Benjamini adjusted P value |
|---|---|---|---|
| GO:0031424 ~ keratinization (BP) | 3.37E-06 | 4.77 | 0.00998 |
| GO:0030216 ~ keratinocyte differentiation (BP) | 6.41E-06 | 3.78 | 0.00948 |
| GO:0030855 ~ epithelial cell differentiation (BP) | 1.64E-05 | 2.67 | 0.01613 |
| GO:0009913 ~ epidermal cell differentiation (BP) | 2.09E-05 | 3.46 | 0.01545 |
| GO:0001533 ~ cornified envelope (CC) | 4.76E-06 | 6.95 | 0.00228 |
Conclusions
Above all, we learned that the various SNPs could contribute to different characteristics, including skin color, eye color and the risk of diseases, especially skin-related disorders, among different populations. Our study revealed a large spectrum of SNPs that could facilitate our understanding of the different characteristics between populations and the underlying mechanisms of molecular evolution.
Data availability
All data are public available from HapMap project at ftp://ftp.hgsc.bcm.tmc.edu/HapMap3-ENCODE/HapMap3/HapMap3v3.
Acknowledgements
This work was supported by grants from the National Basic Research Program of China (2011CB510102, 2011CB510101), and the National Natural Science Foundation of China (31371335), Innovation Program of Shanghai Municipal Education Commission (12ZZ087), the grant of “The First-class Discipline of Universities in Shanghai”.
Abbreviations
- SNP
Single nucleotide polymorphism
- NCBI
National Center for Biotechnology Information
- CDS
Coding sequence
- GWAS
Genome-Wide Association Study
- SMO
Sequential minimal optimization
- mRMR
Minimal Redundancy Maximal Relevance
Additional files
The predictive performance of the SMO method on 30 randomly divided training and independent test datasets. The training (85 % of the samples) and independent test (15 % of the samples) datasets were randomly divided for 30 times and for each time, the training and test processes were repeated. Then the mean and standard deviation of the accuracies on 30 training and independent test datasets were calculated. As shown in this table, the mean accuracies were close to the accuracies of SMO in Table 2 and the standard deviations were very small which indicated that the partition of training and independent test datasets does not affect the prediction performance. (XLSX 20 kb)
The 299 optimal SNPs that can classify the nine ethnic groups with accuracy greater than 90 %. The order is the mRMR rank, and the SNP name includes the dbSNP ID and the minor allele. (XLSX 37 kb)
The minor allele frequencies of the 299 optimal SNPs in each ethnic group. Each page is a SNP. (PDF 238 kb)
Footnotes
Competing interests
The authors declare that they have no competing interests.
Authors’ contributions
TH and YDC designed the study. TH and YS analyzed the data and wrote the manuscript. All authors read and approved the final manuscript.
Authors’ information
Tao Huang and Yang Shu are co-first author.
Contributor Information
Tao Huang, Email: tohuangtao@126.com.
Yang Shu, Email: shuyang1986@gmail.com.
Yu-Dong Cai, Email: cai_yud@126.com.
References
- 1.Halushka MK, Fan J-B, Bentley K, Hsie L, Shen N, Weder A, et al. Patterns of single-nucleotide polymorphisms in candidate genes for blood-pressure homeostasis. Nat Genet. 1999;22(3):239–247. doi: 10.1038/10297. [DOI] [PubMed] [Google Scholar]
- 2.Chen R, Davydov EV, Sirota M, Butte AJ. Non-Synonymous and Synonymous Coding SNPs Show Similar Likelihood and Effect Size of Human Disease Association. PLoS One. 2010;5(10):e13574. doi: 10.1371/journal.pone.0013574. [DOI] [PMC free article] [PubMed] [Google Scholar]
- 3.Celton J-M, Christoffels A, Sargent DJ, Xu X, Rees DJG. Genome-wide SNP identification by high-throughput sequencing and selective mapping allows sequence assembly positioning using a framework genetic linkage map. BMC Biol. 2010;8(1):155. doi: 10.1186/1741-7007-8-155. [DOI] [PMC free article] [PubMed] [Google Scholar]
- 4.Liu Y, Xu H, Chen S, Chen X, Zhang Z, Zhu Z, et al. Genome-wide interaction-based association analysis identified multiple new susceptibility loci for common diseases. PLoS Genet. 2011;7(3):e1001338. doi: 10.1371/journal.pgen.1001338. [DOI] [PMC free article] [PubMed] [Google Scholar]
- 5.Xu Z, Taylor JA. SNPinfo: integrating GWAS and candidate gene information into functional SNP selection for genetic association studies. Nucleic Acids Res. 2009;37(suppl 2):W600–W605. doi: 10.1093/nar/gkp290. [DOI] [PMC free article] [PubMed] [Google Scholar]
- 6.Rafnar T, Sulem P, Thorleifsson G, Vermeulen SH, Helgason H, Saemundsdottir J, et al. Genome-wide association study yields variants at 20p12.2 that associate with urinary bladder cancer. Hum Mol Genet. 2014;23(20):5545–57. doi: 10.1093/hmg/ddu264. [DOI] [PubMed] [Google Scholar]
- 7.Shastry BS. SNPs in disease gene mapping, medicinal drug development and evolution. J Hum Genet. 2007;52(11):871–880. doi: 10.1007/s10038-007-0200-z. [DOI] [PubMed] [Google Scholar]
- 8.Shastry BS. SNP alleles in human disease and evolution. J Hum Genet. 2002;47(11):0561–0566. doi: 10.1007/s100380200086. [DOI] [PubMed] [Google Scholar]
- 9.Collins FS, Mansoura MK. The human genome project. Cancer. 2001;91(S1):221–225. doi: 10.1002/1097-0142(20010101)91:1+<221::AID-CNCR8>3.0.CO;2-9. [DOI] [PubMed] [Google Scholar]
- 10.Collins FS, Brooks LD, Chakravarti A. A DNA Polymorphism Discovery Resource for Research on Human Genetic Variation. Genome Res. 1998;8(12):1229–1231. doi: 10.1101/gr.8.12.1229. [DOI] [PubMed] [Google Scholar]
- 11.Barbujani G, Magagni A, Minch E, Cavalli-Sforza LL. An apportionment of human DNA diversity. Proc Natl Acad Sci. 1997;94(9):4516–4519. doi: 10.1073/pnas.94.9.4516. [DOI] [PMC free article] [PubMed] [Google Scholar]
- 12.Spichenok O, Budimlija ZM, Mitchell AA, Jenny A, Kovacevic L, Marjanovic D, et al. Prediction of eye and skin color in diverse populations using seven SNPs. Forensic Sci Int Genet. 2011;5(5):472–478. doi: 10.1016/j.fsigen.2010.10.005. [DOI] [PubMed] [Google Scholar]
- 13.Nelson MR, Wegmann D, Ehm MG, Kessner D, St. Jean P, Verzilli C, et al. An Abundance of Rare Functional Variants in 202 Drug Target Genes Sequenced in 14,002 People. Science. 2012;337(6090):100–104. doi: 10.1126/science.1217876. [DOI] [PMC free article] [PubMed] [Google Scholar]
- 14.Xu W, Westwood B, Bartsocas C, Malcorra-Azpiazu J, Indrak K, Beutler E. Glucose-6 phosphate dehydrogenase mutations and haplotypes in various ethnic groups, vol. 85. 1995;85(1):257-263. [PubMed]
- 15.Zahed L, Talhouk R, Saleh M, Abou-Jaoudeh R, Fisher C, Old J. The spectrum of beta-thalassaemia mutations in the Lebanon. Hum Hered. 1997;47(5):241–249. doi: 10.1159/000154419. [DOI] [PubMed] [Google Scholar]
- 16.Madan N, Sharma S, Rusia U, Sen S, Sood SK. Beta-thalassaemia mutations in northern India (Delhi) Indian J Med Res. 1998;107:134–141. [PubMed] [Google Scholar]
- 17.Pirastu M, Kan YW, Cao A, Conner BJ, Teplitz RL, Wallace RB. Prenatal diagnosis of beta-thalassemia. Detection of a single nucleotide mutation in DNA. N Engl J Med. 1983;309(5):284–287. doi: 10.1056/NEJM198308043090506. [DOI] [PubMed] [Google Scholar]
- 18.Yang J, Benyamin B, McEvoy BP, Gordon S, Henders AK, Nyholt DR, et al. Common SNPs explain a large proportion of the heritability for human height. Nat Genet. 2010;42(7):565–569. doi: 10.1038/ng.608. [DOI] [PMC free article] [PubMed] [Google Scholar]
- 19.Hart KL, Kimura SL, Mushailov V, Budimlija ZM, Prinz M, Wurmbach E. Improved eye- and skin-color prediction based on 8 SNPs. Croat Med J. 2013;54(3):248–256. doi: 10.3325/cmj.2013.54.248. [DOI] [PMC free article] [PubMed] [Google Scholar]
- 20.Branicki W, Brudnik U, Wojas-Pelc A. Interactions between HERC2, OCA2 and MC1R may influence human pigmentation phenotype. Ann Hum Genet. 2009;73(2):160–170. doi: 10.1111/j.1469-1809.2009.00504.x. [DOI] [PubMed] [Google Scholar]
- 21.Branicki W, Brudnik U, Kupiec T, Wolanska-Nowak P, Szczerbinska A, Wojas-Pelc A. Association of polymorphic sites in the OCA2 gene with eye colour using the tree scanning method. Ann Hum Genet. 2008;72(Pt 2):184–192. doi: 10.1111/j.1469-1809.2007.00407.x. [DOI] [PubMed] [Google Scholar]
- 22.Shekar SN, Duffy DL, Frudakis T, Sturm RA, Zhao ZZ, Montgomery GW, et al. Linkage and association analysis of spectrophotometrically quantified hair color in Australian adolescents: the effect of OCA2 and HERC2. J Invest Dermatol. 2008;128(12):2807–2814. doi: 10.1038/jid.2008.147. [DOI] [PubMed] [Google Scholar]
- 23.Stokowski RP, Pant PV, Dadd T, Fereday A, Hinds DA, Jarman C, et al. A genomewide association study of skin pigmentation in a South Asian population. Am J Hum Genet. 2007;81(6):1119–1132. doi: 10.1086/522235. [DOI] [PMC free article] [PubMed] [Google Scholar]
- 24.Valverde P, Healy E, Jackson I, Rees JL, Thody AJ. Variants of the melanocyte-stimulating hormone receptor gene are associated with red hair and fair skin in humans. Nat Genet. 1995;11(3):328–330. doi: 10.1038/ng1195-328. [DOI] [PubMed] [Google Scholar]
- 25.Karter AJ. Commentary: Race, genetics, and disease— in search of a middle ground. Int J Epidemiol. 2003;32(1):26–28. doi: 10.1093/ije/dyg033. [DOI] [PubMed] [Google Scholar]
- 26.Huang T, Tu K, Shyr Y, Wei CC, Xie L, Li YX. The prediction of interferon treatment effects based on time series microarray gene expression profiles. J Transl Med. 2008;6(1):44. doi: 10.1186/1479-5876-6-44. [DOI] [PMC free article] [PubMed] [Google Scholar]
- 27.Li C-Y, Yu Q, Ye Z-Q, Sun Y, He Q, Li X-M, et al. A nonsynonymous SNP in human cytosolic sialidase in a small Asian population results in reduced enzyme activity: potential link with severe adverse reactions to oseltamivir. Cell Res. 2007;17(4):357–362. doi: 10.1038/cr.2007.27. [DOI] [PubMed] [Google Scholar]
- 28.Consortium IH. Integrating common and rare genetic variation in diverse human populations. Nature. 2010;467(7311):52–58. doi: 10.1038/nature09298. [DOI] [PMC free article] [PubMed] [Google Scholar]
- 29.Yamaguchi-Kabata Y, Nakazono K, Takahashi A, Saito S, Hosono N, Kubo M, et al. Japanese Population Structure, Based on SNP Genotypes from 7003 Individuals Compared to Other Ethnic Groups: Effects on Population-Based Association Studies. Am. J. Hum. Genet. 2008;83(4):445–456. doi: 10.1016/j.ajhg.2008.08.019. [DOI] [PMC free article] [PubMed] [Google Scholar]
- 30.Purcell S, Neale B, Todd-Brown K, Thomas L, Ferreira MA, Bender D, et al. PLINK: a tool set for whole-genome association and population-based linkage analyses. Am J Hum Genet. 2007;81(3):559–575. doi: 10.1086/519795. [DOI] [PMC free article] [PubMed] [Google Scholar]
- 31.Jombart T, Ahmed I. adegenet 1.3-1: new tools for the analysis of genome-wide SNP data. Bioinformatics. 2011;27(21):3070–3071. doi: 10.1093/bioinformatics/btr521. [DOI] [PMC free article] [PubMed] [Google Scholar]
- 32.Li Z, Li BQ, Jiang M, Chen L, Zhang J, Liu L, et al. Prediction and analysis of retinoblastoma related genes through gene ontology and KEGG. Biomed Res Int. 2013;2013:304029. doi: 10.1155/2013/304029. [DOI] [PMC free article] [PubMed] [Google Scholar]
- 33.Huang T, Zhang J, Xu ZP, Hu LL, Chen L, Shao JL, et al. Deciphering the effects of gene deletion on yeast longevity using network and machine learning approaches. Biochimie. 2012;94(4):1017–1025. doi: 10.1016/j.biochi.2011.12.024. [DOI] [PubMed] [Google Scholar]
- 34.Huang T, Wang J, Cai YD, Yu H, Chou KC. Hepatitis C virus network based classification of hepatocellular cirrhosis and carcinoma. PLoS One. 2012;7(4):e34460. doi: 10.1371/journal.pone.0034460. [DOI] [PMC free article] [PubMed] [Google Scholar]
- 35.Huang T, Wang C, Zhang G, Xie L, Li Y. SySAP: a system-level predictor of deleterious single amino acid polymorphisms. Protein Cell. 2012;3(1):38–43. doi: 10.1007/s13238-011-1130-2. [DOI] [PMC free article] [PubMed] [Google Scholar]
- 36.Huang T, Xu Z, Chen L, Cai YD, Kong X. Computational Analysis of HIV-1 Resistance Based on Gene Expression Profiles and the Virus-Host Interaction Network. PLoS One. 2011;6(3):e17291. doi: 10.1371/journal.pone.0017291. [DOI] [PMC free article] [PubMed] [Google Scholar]
- 37.Zhou Y, Zhang N, Li BQ, Huang T, Cai YD, Kong XY. A method to distinguish between lysine acetylation and lysine ubiquitination with feature selection and analysis. J Biomol Struct Dyn. 2015;33(11):2479–90. doi: 10.1080/07391102.2014.1001793. [DOI] [PubMed] [Google Scholar]
- 38.Zhao TH, Jiang M, Huang T, Li BQ, Zhang N, Li HP, et al. A novel method of predicting protein disordered regions based on sequence features. Biomed Res Int. 2013;2013:414327. doi: 10.1155/2013/414327. [DOI] [PMC free article] [PubMed] [Google Scholar]
- 39.Niu B, Huang G, Zheng L, Wang X, Chen F, Zhang Y, et al. Prediction of substrate-enzyme-product interaction based on molecular descriptors and physicochemical properties. Biomed Res Int. 2013;2013:674215. doi: 10.1155/2013/674215. [DOI] [PMC free article] [PubMed] [Google Scholar]
- 40.Peng H, Long F, Ding C. Feature selection based on mutual information: criteria of max-dependency, max-relevance, and min-redundancy. IEEE Trans Pattern Anal Mach Intell. 2005;27(8):1226–1238. doi: 10.1109/TPAMI.2005.159. [DOI] [PubMed] [Google Scholar]
- 41.Huang T, Cai Y-D. An Information-Theoretic Machine Learning Approach to Expression QTL Analysis. PLoS One. 2013;8(6):e67899. doi: 10.1371/journal.pone.0067899. [DOI] [PMC free article] [PubMed] [Google Scholar]
- 42.Sun L, Yu Y, Huang T, An P, Yu D, Yu Z, et al. Associations between ionomic profile and metabolic abnormalities in human population. PLoS One. 2012;7(6):e38845. doi: 10.1371/journal.pone.0038845. [DOI] [PMC free article] [PubMed] [Google Scholar]
- 43.Zhang N, Huang T, Cai YD. Discriminating between deleterious and neutral non-frameshifting indels based on protein interaction networks and hybrid properties. Mol Genet Genomics. 2014;290(1):343-352. [DOI] [PubMed]
- 44.Shu Y, Zhang N, Kong X, Huang T, Cai YD. Predicting A-to-I RNA Editing by Feature Selection and Random Forest. PLoS One. 2014;9(10):e110607. doi: 10.1371/journal.pone.0110607. [DOI] [PMC free article] [PubMed] [Google Scholar]
- 45.Li BQ, You J, Huang T, Cai YD. Classification of non-small cell lung cancer based on copy number alterations. PLoS One. 2014;9(2):e88300. doi: 10.1371/journal.pone.0088300. [DOI] [PMC free article] [PubMed] [Google Scholar]
- 46.Jiang Y, Huang T, Chen L, Gao YF, Cai Y, Chou KC. Signal propagation in protein interaction network during colorectal cancer progression. Biomed Res Int. 2013;2013:287019. doi: 10.1155/2013/287019. [DOI] [PMC free article] [PubMed] [Google Scholar]
- 47.Zhang PW, Chen L, Huang T, Zhang N, Kong XY, Cai YD. Classifying ten types of major cancers based on reverse phase protein array profiles. PLoS One. 2015;10(3):e0123147. doi: 10.1371/journal.pone.0123147. [DOI] [PMC free article] [PubMed] [Google Scholar]
- 48.Yang J, Chen L, Kong X, Huang T, Cai YD. Analysis of Tumor Suppressor Genes Based on Gene Ontology and the KEGG Pathway. PLoS One. 2014;9(9):e107202. doi: 10.1371/journal.pone.0107202. [DOI] [PMC free article] [PubMed] [Google Scholar]
- 49.Cui W, Chen L, Huang T, Gao Q, Jiang M, Zhang N, et al. Computationally identifying virulence factors based on KEGG pathways. Mol Biosyst. 2013;9(6):1447–1452. doi: 10.1039/c3mb70024k. [DOI] [PubMed] [Google Scholar]
- 50.Niu B, Lu Y, Lu J, Chen F, Zhao T, Liu Z, et al. Prediction of Enzyme’s Family Based on Protein-Protein Interaction Network. Curr. Bioinforma. 2015;10(1):16–21. doi: 10.2174/157489361001150309122016. [DOI] [Google Scholar]
- 51.Li BQ, Huang T, Zhang J, Zhang N, Huang GH, Liu L, et al. An ensemble prognostic model for colorectal cancer. PLoS One. 2013;8(5):e63494. doi: 10.1371/journal.pone.0063494. [DOI] [PMC free article] [PubMed] [Google Scholar]
- 52.Frank E, Hall M, Trigg L, Holmes G, Witten IH. Data mining in bioinformatics using Weka. Bioinformatics. 2004;20(15):2479–2481. doi: 10.1093/bioinformatics/bth261. [DOI] [PubMed] [Google Scholar]
- 53.Xu Z, Dai M, Meng D. Fast and efficient strategies for model selection of Gaussian support vector machine. IEEE Trans. Syst. Man Cybern. B Cybern. 2009;39(5):1292–1307. doi: 10.1109/TSMCB.2009.2015672. [DOI] [PubMed] [Google Scholar]
- 54.Hastie T, Tibshirani R. Proceedings of the 1997 conference on Advances in neural information processing systems 10. Denver: MIT Press; 1998. Classification by pairwise coupling; pp. 507–513. [Google Scholar]
- 55.Aha DW, Kibler D, Albert MK. Instance-based learning algorithms. Mach. Learn. 1991;6(1):37–66. [Google Scholar]
- 56.Ting KM, Witten IH. Fourteenth international Conference on Machine Learning: 1997; San Francisco, CA. 1997. Stacking bagged and dagged models; pp. 367–375. [Google Scholar]
- 57.Breiman L. Random forests. Mach. Learn. 2001;45(1):5–32. doi: 10.1023/A:1010933404324. [DOI] [Google Scholar]
- 58.Metspalu M, Romero IG, Yunusbayev B, Chaubey G, Mallick CB, Hudjashov G, et al. Shared and unique components of human population structure and genome-wide signals of positive selection in South Asia. Am J Hum Genet. 2011;89(6):731–744. doi: 10.1016/j.ajhg.2011.11.010. [DOI] [PMC free article] [PubMed] [Google Scholar]
- 59.Tabassum R, Mahajan A, Chauhan G, Dwivedi OP, Ghosh S, Tandon N, et al. Evaluation of DOK5 as a susceptibility gene for type 2 diabetes and obesity in North Indian population. BMC Med Genet. 2010;11:35. doi: 10.1186/1471-2350-11-35. [DOI] [PMC free article] [PubMed] [Google Scholar]
- 60.He L, Tuomilehto J, Qiao Q, Soderberg S, Daimon M, Chambers J, et al. Impact of classical risk factors of type 2 diabetes among Asian Indian. Chinese and Japanese populations. Diabetes Metab. 2015;41(5):401–9. doi: 10.1016/j.diabet.2015.07.003. [DOI] [PubMed] [Google Scholar]
- 61.Meeks KA, Freitas-Da-Silva D, Adeyemo A, Beune EJ, Modesti PA, Stronks K, et al. Disparities in type 2 diabetes prevalence among ethnic minority groups resident in Europe: a systematic review and meta-analysis. Intern Emerg Med. 2015. Epub ahead of print. [DOI] [PubMed]
- 62.Vijan S. Type 2 Diabetes. Ann Intern Med. 2010;152(5):ITC3–1. doi: 10.7326/0003-4819-152-5-201003020-01003. [DOI] [PubMed] [Google Scholar]
- 63.Lamason RL, Mohideen MA, Mest JR, Wong AC, Norton HL, Aros MC, et al. SLC24A5, a putative cation exchanger, affects pigmentation in zebrafish and humans. Science. 2005;310(5755):1782–1786. doi: 10.1126/science.1116238. [DOI] [PubMed] [Google Scholar]
- 64.Wei AH, Zang DJ, Zhang Z, Liu XZ, He X, Yang L, et al. Exome sequencing identifies SLC24A5 as a candidate gene for nonsyndromic oculocutaneous albinism. J Invest Dermatol. 2013;133(7):1834–1840. doi: 10.1038/jid.2013.49. [DOI] [PubMed] [Google Scholar]
- 65.Soejima M, Koda Y. Population differences of two coding SNPs in pigmentation-related genes SLC24A5 and SLC45A2. Int J Leg Med. 2007;121(1):36–39. doi: 10.1007/s00414-006-0112-z. [DOI] [PubMed] [Google Scholar]
- 66.Dotolo R, Kim JD, Pariante P, Minucci S, Diano S. Prolyl Endopeptidase (PREP) is Associated With Male Reproductive Functions and Gamete Physiology in Mice. Journal of Cellular Physiology 2015:n/a-n/a. [DOI] [PubMed]
- 67.Huang C, Yang S, Ge R, Sun H, Shen F, Wang Y. ZNF23 induces apoptosis in human ovarian cancer cells. Cancer Lett. 2008;266(2):135–143. doi: 10.1016/j.canlet.2008.02.059. [DOI] [PubMed] [Google Scholar]
- 68.Huang C, Jia Y, Yang S, Chen B, Sun H, Shen F, et al. Characterization of ZNF23, a KRAB-containing protein that is downregulated in human cancers and inhibits cell cycle progression. Exp Cell Res. 2007;313(2):254–263. doi: 10.1016/j.yexcr.2006.10.009. [DOI] [PubMed] [Google Scholar]
- 69.Shi Y, Zheng L, Luo G, Wei J, Zhang J, Yu Y, et al. Expression of zinc finger 23 gene in human hepatocellular carcinoma. Anticancer Res. 2011;31(10):3595–3599. [PubMed] [Google Scholar]
- 70.Song Y, Li L, Ou Y, Gao Z, Li E, Li X, et al. Identification of genomic alterations in oesophageal squamous cell cancer. Nature. 2014;509(7498):91–95. doi: 10.1038/nature13176. [DOI] [PubMed] [Google Scholar]
- 71.Zhang J, Xu E, Ren C, Yan W, Zhang M, Chen M, et al. Mice deficient in Rbm38, a target of the p53 family, are susceptible to accelerated aging and spontaneous tumors. Proc Natl Acad Sci U S A. 2014;111(52):18637–18642. doi: 10.1073/pnas.1415607112. [DOI] [PMC free article] [PubMed] [Google Scholar]
- 72.Xue JQ, Xia TS, Liang XQ, Zhou W, Cheng L, Shi L, et al. RNA-binding protein RNPC1: acting as a tumor suppressor in breast cancer. BMC Cancer. 2014;14:322. doi: 10.1186/1471-2407-14-322. [DOI] [PMC free article] [PubMed] [Google Scholar]
- 73.Prives C, Lowe SW. Cancer: Mutant p53 and chromatin regulation. Nature. 2015;525(7568):199–200. doi: 10.1038/nature15212. [DOI] [PMC free article] [PubMed] [Google Scholar]
- 74.Culotta E, Koshland DE., Jr p53 sweeps through cancer research. Science. 1993;262(5142):1958–1961. doi: 10.1126/science.7903477. [DOI] [PubMed] [Google Scholar]
- 75.Seneviratne S, Campbell I, Scott N, Shirley R, Peni T, Lawrenson R. Ethnic differences in breast cancer survival in New Zealand: contributions of differences in screening, treatment, tumor biology, demographics and comorbidities. Cancer Causes Control. 2015;26(12):1813–24. doi: 10.1007/s10552-015-0674-5. [DOI] [PubMed] [Google Scholar]
- 76.Maringe C, Li R, Mangtani P, Coleman MP, Rachet B. Cancer survival differences between South Asians and non-South Asians of England in 1986–2004, accounting for age at diagnosis and deprivation. Br J Cancer. 2015;113(1):173–181. doi: 10.1038/bjc.2015.182. [DOI] [PMC free article] [PubMed] [Google Scholar]
- 77.Evers C, Maas B, Koch KA, Jauch A, Janssen JWG, Sutter C, et al. Mosaic deletion of EXOC6B: Further evidence for an important role of the exocyst complex in the pathogenesis of intellectual disability. Am J Med Genet A. 2014;164(12):3088–3094. doi: 10.1002/ajmg.a.36770. [DOI] [PubMed] [Google Scholar]
- 78.Vos T, Barber RM, Bell B, Bertozzi-Villa A, Biryukov S, Bolliger I, et al. Global, regional, and national incidence, prevalence, and years lived with disability for 301 acute and chronic diseases and injuries in 188 countries, 1990–2013: a systematic analysis for the Global Burden of Disease Study. Lancet. 2013;386(9995):743–800. doi: 10.1016/S0140-6736(15)60692-4. [DOI] [PMC free article] [PubMed] [Google Scholar]
- 79.Maulik PK, Mascarenhas MN, Mathers CD, Dua T, Saxena S. Prevalence of intellectual disability: A meta-analysis of population-based studies. Res Dev Disabil. 2011;32(2):419–436. doi: 10.1016/j.ridd.2010.12.018. [DOI] [PubMed] [Google Scholar]
- 80.Liu X, Chen Q, Tsai HJ, Wang G, Hong X, Zhou Y, et al. Maternal preconception body mass index and offspring cord blood DNA methylation: exploration of early life origins of disease. Environ Mol Mutagen. 2014;55(3):223–230. doi: 10.1002/em.21827. [DOI] [PMC free article] [PubMed] [Google Scholar]
- 81.Lopez AD, Mathers CD, Ezzati M, Jamison DT, Murray CJL. Global Burden of Disease and Risk Factors. Washington: World Bank; 2006. [PubMed]
- 82.Visser M, Kayser M, Palstra RJ. HERC2 rs12913832 modulates human pigmentation by attenuating chromatin-loop formation between a long-range enhancer and the OCA2 promoter. Genome Res. 2012;22(3):446–455. doi: 10.1101/gr.128652.111. [DOI] [PMC free article] [PubMed] [Google Scholar]
- 83.Mengel-From J, Borsting C, Sanchez JJ, Eiberg H, Morling N. Human eye colour and HERC2, OCA2 and MATP. Forensic Sci Int Genet. 2010;4(5):323–328. doi: 10.1016/j.fsigen.2009.12.004. [DOI] [PubMed] [Google Scholar]
- 84.Amos CI, Wang LE, Lee JE, Gershenwald JE, Chen WV, Fang S, et al. Genome-wide association study identifies novel loci predisposing to cutaneous melanoma. Hum Mol Genet. 2011;20(24):5012–5023. doi: 10.1093/hmg/ddr415. [DOI] [PMC free article] [PubMed] [Google Scholar]
- 85.Schroeder HE. Differentiation of human oral stratified epithelia. Switzerland: S. Karger AG; 1981. [Google Scholar]
- 86.Shetty S, Gokul S. Keratinization and its disorders. Oman Med J. 2012;27(5):348. doi: 10.5001/omj.2012.90. [DOI] [PMC free article] [PubMed] [Google Scholar]
- 87.Van Scott EJ. Keratinization and hair growth. Annu Rev Med. 1968;19:337–350. doi: 10.1146/annurev.me.19.020168.002005. [DOI] [PubMed] [Google Scholar]
- 88.McLean WH, Hansen CD, Eliason MJ, Smith FJ. The phenotypic and molecular genetic features of pachyonychia congenita. J Invest Dermatol. 2011;131(5):1015–1017. doi: 10.1038/jid.2011.59. [DOI] [PubMed] [Google Scholar]
- 89.Auluck A. Dyskeratosis congenita. Report of a case with literature review. Med Oral Patol Oral Cir Bucal. 2007;12(5):E369–373. [PubMed] [Google Scholar]
- 90.Craddock N, Owen M, Burge S, Kurian B, Thomas P, McGuffin P. Familial cosegregation of major affective disorder and Darier’s disease (keratosis follicularis) Br J Psychiatry. 1994;164(3):355–358. doi: 10.1192/bjp.164.3.355. [DOI] [PubMed] [Google Scholar]
- 91.Fuchs E. Genetic Skin Disorders of Keratin. J Investig Dermatol. 1992;99(6):671–674. doi: 10.1111/1523-1747.ep12613737. [DOI] [PubMed] [Google Scholar]
- 92.Kalinin AE, Kajava AV, Steinert PM. Epithelial barrier function: assembly and structural features of the cornified cell envelope. Bioessays. 2002;24(9):789–800. doi: 10.1002/bies.10144. [DOI] [PubMed] [Google Scholar]
Associated Data
This section collects any data citations, data availability statements, or supplementary materials included in this article.
Data Availability Statement
All data are public available from HapMap project at ftp://ftp.hgsc.bcm.tmc.edu/HapMap3-ENCODE/HapMap3/HapMap3v3.