

Abstract
Introduction:
Tamra Bhasma, one among the herbo-metallic preparations is extensively used in Ayurveda for different conditions. To make it safe to use, Tamra has to pass through a set of classical pharmaceutical procedures including a series of quenching in prescribed liquids, followed by incineration with black sulfide of mercury and herbal juice of Citrus jambhiri Lush. and corm of Amorphophallus campanulatus Linn. FTIR profiles of Tamra Bhasma at different levels is not available.
Aim:
To evaluate the chemical changes in Tamra Bhasma at different steps by following Fourier transform infrared (FTIR) spectroscopy.
Materials and Methods:
In current study, raw Tamra, intermediate samples obtained during purification, incineration and Amritikarana were analyzed using FTIR.
Results:
It was observed that Shodhana procedure leads in the formation of bonds between surface particles of Tamra and Shodhana media. These formed bonds on the surface of Shodhita Tamra samples gave various sharp peaks representing presence of many functional groups.
Conclusion:
The FTIR spectra revealed that both Bhasma samples contained organic compounds probably in the form of a complex with common functional groups like alkyl, methyl, etc., which need further studies for exact characterization of the complexes.
Keywords: Copper, Fourier transform infrared, Marana, Shodhana, Tamra Bhasma
Introduction
Ayurveda, the ancient system of medicine is being safely practiced in Indian subcontinent since ages. The drugs in this system of medicine are obtained from natural sources including plants, animals, marine and minerals that are converted into compound formulations by following specified guidelines mentioned in Ayurvedic classics. Bhasmas (calcined forms of metals and minerals) are one of such important formulations that are therapeutically useful in different disease conditions. Despite their utility, concerns are being raised regarding the safety and toxicity of traditional preparations and there is a need to address them appropriately.[1,2,3,4] Tamra Bhasma is one important Bhasma useful in many diseases.[5] If the metal is not processed properly, it may be hazardous to life.[6] It has to process through a set of classical pharmaceutical procedures known as Shodhana, Marana and Amritikarana etc., before its internal administration. Properly processed Tamra Bhasma is useful in the treatment of Udara (ascitis), Pandu (anaemia), Svasa (bronchial asthma) and Amlapitta (hyperacidity) etc. disorders.[7] Though qualitative tests to judge proper formation of Bhasma are described in Rasa classics, they are not sufficient to provide quantitative information. Standardization of each involved step is become necessary to study possible reaction. Emphasis in the present paper is to see chemical changes in Tamra Bhasma at different steps by following Fourier transform infrared (FTIR) that may highlight the importance of Ayurvedic processing methods.
Materials and Methods
Preparation of Tamra Bhasma
Tamra Bhasma was prepared by following classical guidelines as described in Ayurveda classics [Figure 1].
Figure 1.
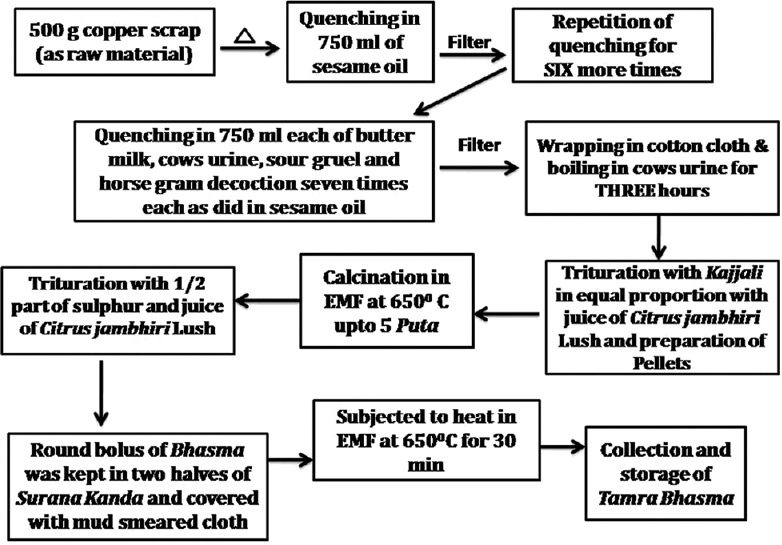
Flow sheet for preparation of Tamra Bhasma
Samanya Shodhana
Copper scraps (0.5 mm thickness) of 99.89% purity copper were procured from Bharat Bridge Plate, Jamnagar. About 500 g of metallic copper was heated to red hot stage and quenched in Tila Taila (sesame oil), Takra (buttermilk), Gomutra (cow's urine), Kanji (sour gruel), and Kulattha Kwatha (decoction of seeds Dolichos biflorus Linn.) for 7 times in each media sequentially to obtain Samanya Shodhita Tamra.[8]
Vishesha Shodhana
Samanya Shodhita Tamra was subjected to Swedana (boiling) in Gomutra (cows urine) for 3 h.[9] It was shade-dried and used for Marana (incineration).
Marana
Vishesha Shodhita Tamra was mixed with equal quantity of Kajjali (black sulphide of mercury) and levigated with Jambiri Nimbu Swarasa (juice of Citrus jambhiri Lush.). Chakrikas (pellets) were prepared, shade-dried, placed in Sharava (earthen saucer) and covered by another Sharava of similar diameter. The junctions were sealed with double folded, mud smeared cloth. It was subjected to heat in electrical muffle furnace (EMF) at the temperature of 700°C for first Puta and 650°C for subsequent four Putas for 30 mins.[10] This process of incineration was repeated for five more times to obtain Tamra Bhasma.
Amritikarana
Tamra Bhasma was triturated with ½ part of Shuddha Gandhaka (processed sulphur) and levigated with Jambiri Nimbu Swarasa. After proper levigation, a round bolus was prepared and dried in shade. This bolus was kept in the pit of Surana Kanda (corm of Amorphophallus campanulatus Linn.) made by cutting it appropriately. Two halves of the corm were joined and sealed together. The corm was covered tightly with double layered, mud smeared cloth, allowed to become dry. Subjected to heat in EMF at 650°C for 30 min, and removed after Swangasheeta (self cooling). The bolus inside was taken out, triturated, weighed and stored in airtight glass container.[11]
Analysis of samples
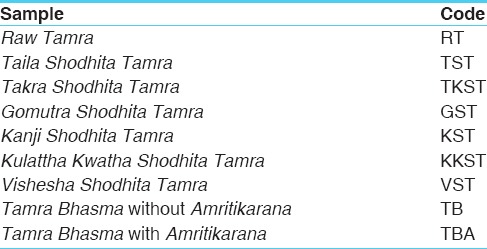
Samples of raw, Samanya Shodhita, Vishesha Shodhana, Marita and after Amritikarana were labeled and analyzed through FTIR [Table 1]. The 3000 Hyperion microscope with vertex 80 FTIR system instrument was used for the current study.
Table 1.
Sample codes for analysis
Observations and Results
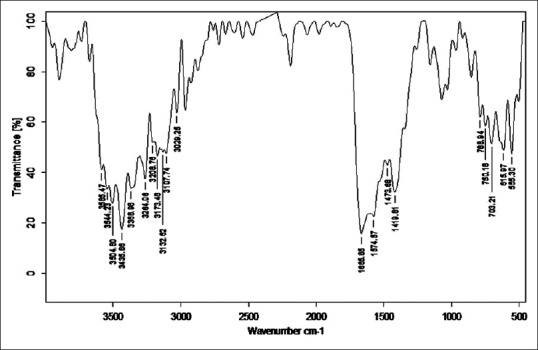
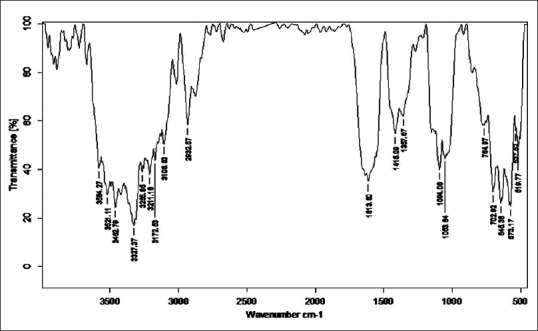
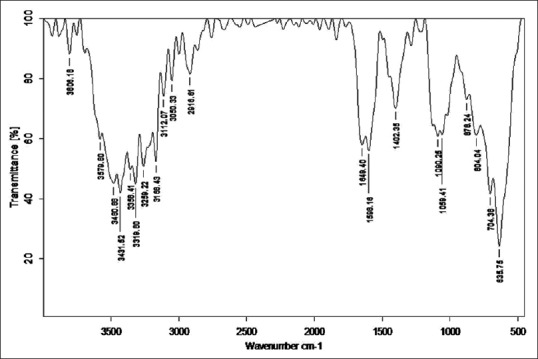
Fourier transform infrared spectroscopy was performed to detect the presence of functional groups or organic legends in different samples of Tamra. FTIR spectra are divided into four regions viz. Hydrogen stretching region (3700–2700 cm−1), triple bond region (2700–1950 cm−1), a double bond region (1950–1550 cm−1) and fingerprint region (1500–700 cm−1). FTIR spectra of all samples were taken in the region of 551.70–3941 cm−1. General overview of all the samples indicates the presence of large number of functional groups. Absorption peaks in Hydrogen stretching region (3700–2700 cm−1) are ordinary due to various O-H and N-H stretching vibrations, with the former tending to appear at higher wave numbers. Aliphatic C-H vibrations fall in between the region 3000 and 2850 cm−1. Most aliphatic compounds have a sufficient number of C-H bond to make this prominent peak [Table 2].
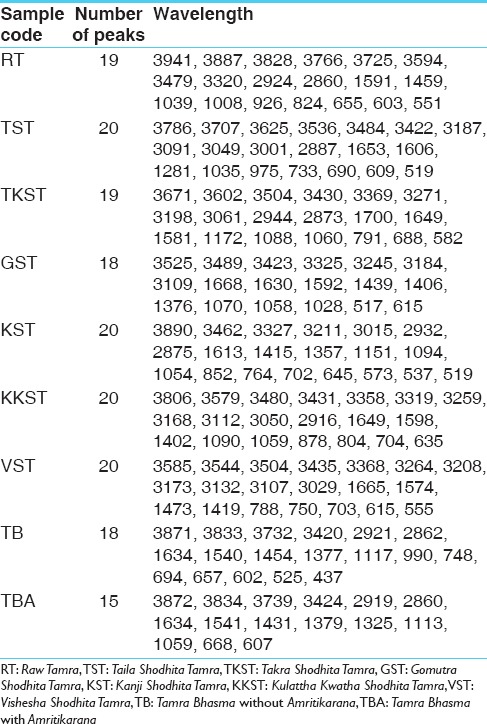
Table 2.
Number of peaks and their wavelength
Discussion
FTIR of raw and Shodhita Tamra
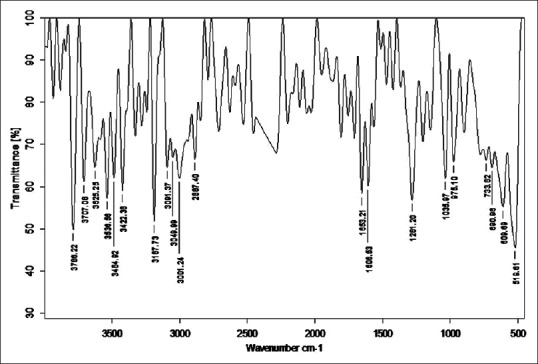
Number of peaks obtained in hydrogen stretching region in sample raw Tamra (RT), Taila Shodhita Tamra (TST), Takra Shodhita Tamra (TKST), Gomutra Shodhita Tamra (GST), Kanji Shodhita Tamra (KST), Kulattha Kwatha Shodhita Tamra (KKST) and Vishesha Shodhita Tamra (VST) are 10, 11, 10, 7, 7, 11 and 11. No peaks were observed in any of the samples in Triple bond region (2700–1950 cm−1) which may indicate absence of highly complex structure. The carbonyl stretching vibration is characterized by absorption through double bond region (1950 and 1550 cm−1). Ketones, aldehydes, acids, amides and carbonates all have absorption peaks around 1700 cm−1. Esters, chlorides and acid aldehydes tend to absorb at slightly higher wavelengths; that is 1770–1725 cm−1. Conjugation tends to lower the absorption peaks by about 20 cm−1. Absorption peaks arising from C = C and C = N stretching vibrations are located in 1690–1600 cm−1 range. The region between 1650 and 1450 cm−1 provide important information about aromatic rings. Nearly all samples showed either one or more peak in this region. All samples of Tamra gave few peaks in the fingerprint region (1500 and 700 cm−1). Small differences in the structure and constitution of a molecule result in significant changes in the distribution peaks in the fingerprint region of the spectrum. Most single bonds give rise to absorption bands at these frequencies. The C-O-C stretching vibration in ethers and esters are found at about 1200 cm−1 and the C-Cl stretching vibration at 700–80 cm−1. A number of inorganic groups such as sulfate, phosphate, nitrate and carbonate also absorb at wave numbers below 1200 cm−1.
C-H stretching vibrations near 1380 cm−1 resulted in obtaining weak peak in GST, which is assigned to alkyl specifically methyl bond. Similar C-H stretching vibrations near 2870 cm−1 wavelength gave a peak in all samples except in GST and KKST. These peaks are also representative of alkyl specifically methyl bond. There is considerable variation in obtained peaks due to stretching vibrations between C-H bonds. These C-H stretching vibrations are assigned to alkyl (methylene), vinyl (monosubstituted alkenes, cis-disubstituted alkenes, trisubstituted alkenes), aromatic benzene (monosubstituted benzene, ortho-disubstituted benzene, meta-disubstituted benzene and para-disubstituted benzene). All samples of Shodhita Tamra except KST showed peaks are raised due to C-C stretching vibrations of acyclic C–C bond. These peaks represent various forms alkene functional group such as mono-substituted, 1,1 di-substituted, cis-1,2-di-substituted, tri-substituted and tetra-substituted alkenes.
Stretching vibrations between C-C bond with C = O near 1600 cm−1 gave peak in sample RT, TST, KKST and GST, which is assigned to dienes. There are few peaks detected in all samples in the range 1640–1680 cm−1 except KST. All these peaks are due to C = C stretching vibrations. Multiple weak to strong peaks obtained near 1450 cm−1 (in RT and Tamra Bhasma without Amrittikarana), 1580 cm−1 (in TKST and VST) and 1600 cm−1 (in RT, TST, GST and KKST) are representative of C = C stretching vibrations having aromatic structure. Stretching vibrations between C = O at 1580–1690 cm−1 indicates presence of carboxylic acid and its derivatives such as unsaturated/aromatic carboxylic acids, amides, carboxylates salts and amino acid zwitterions is observed in samples of Shodita Tamra. However, these peaks are not detected in both samples of Tamra Bhasma. In the classical text of Ayurveda, Niramlatva (absence of bitter or acidic test) is especially advised test for Tamra Bhasma. Hence, absence of carboxylic acid derivatives also supports proper formation of Tamra Bhasma. One peak obtained in sample TST, and two peaks in sample TKST are raised due to O-H stretching vibrations. These peaks are in the range 3610–3670 cm−1 that is assigned to low concentrated phenol bonds. Similar O-H stretching vibrations are observed in all samples of Shodhita Tamra except in TST, which are in the range 3200–3400 cm−1 and represent high concentrated alcohol or phenol bonds. Sample TST showed a sharp peak at 3001.24 cm−1 is raised due to O-H stretching vibrations. Broad and weak to medium peak near 3000 cm−1 is representative of either high concentrated carboxylic acid or secondary amines but peak obtained in sample TST is sharp, hence exact interpretation can’t be withdrawn regarding assignment of this peak. All samples gave peaks in the range 3400–3500 cm−1 that are obtained from N-H stretching vibrations and can be assigned to primary amines. All samples showed multiple peaks in the range 2400–3200 cm−1 that are raised due to stretching vibrations between N-H bonds. These peaks indicate the presence of ammonium ions. Peak obtained below 1380 cm−1 wavelength in samples of Tamra are due various stretching vibrations such as C-O, C-N, C-F, C-Cl, C-Br and N-O. These peaks represent various functional groups such as alcohol, esters, carboxylic acids, aliphatic amines, fluroalkane, chloroalkane, bromoalkane and nitro compounds [Figures 2–8].
Figure 2.
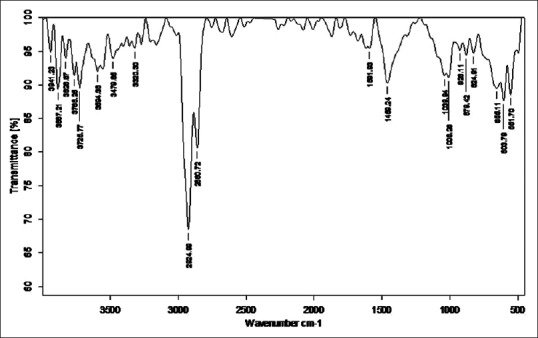
Fourier transform infrared analysis of raw Tamra
Figure 8.
Fourier transform infrared analysis of Vishesha Shodhita Tamra
Figure 3.
Fourier transform infrared analysis of Tila Taila Shodhita Tamra
Figure 4.
Fourier transform infrared analysis of Takra Shodhita Tamra
Figure 5.
Fourier transform infrared analysis of Gomutra Shodhita Tamra
Figure 6.
Fourier transform infrared analysis of Kanji Shodhita Tamra
Figure 7.
Fourier transform infrared analysis of Kulattha Kwatha Shodhita Tamra
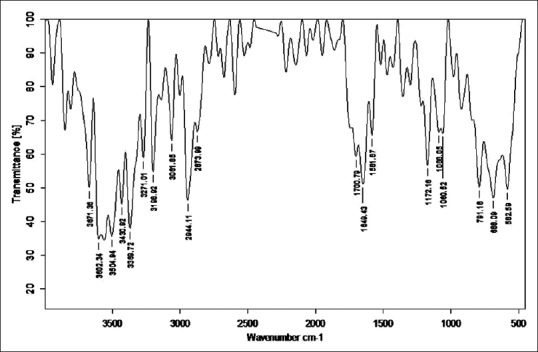
FTIR of Tamra Bhasma without Amritikarana
Total 6, 0, 1 and 5 peaks were obtained in these regions respectively. Six peaks are obtained in a region below 650 cm−1 that is not specifically classified. No peak was observed in triple bond region that indicates the absence of too much complex structure of Tamra Bhasma without Amrittikarana (TB). C-H stretching vibrations near 1380 cm−1 resulted in obtaining weak peak that is assigned to alkyl specifically methyl bond. Medium to strong intensity of C-H stretching vibrations resulted in two peaks at 2862.54 and 22921.99 cm−1 that are assigned to methyl and methylene (-CH2) type of bond. C-H stretching vibrations at 748.67, 694.67 and 748.67 resulted in obtaining three strong peaks out of these first two are assigned to aromatic specifically monosubstituted benzene bond and third peak is ortho-disub benzene bond. Three peaks (1634.56, 1634.56 and 1454.37) are due to C = C stretching vibrations. Two strong peaks (3420.39, 1634.56 cm−1) are obtained which are assigned to the stretching vibrations between N–H bonds indicate presence of primary amines. C-X stretching vibrations represent bond between carbon and halogen atoms. Such six peaks are observed which are assigned to chloroalkanes (694.67, 657.24, 602.72 cm−1), bromoalkanes (602.72, 525.77 cm−1) and fluroalkanes (1117.87 cm−1). Weaker peak obtained at 1377.49 cm−1 is raised due to N-O stretching vibrations and is assigned to aliphatic nitro compounds [Figure 9].
Figure 9.
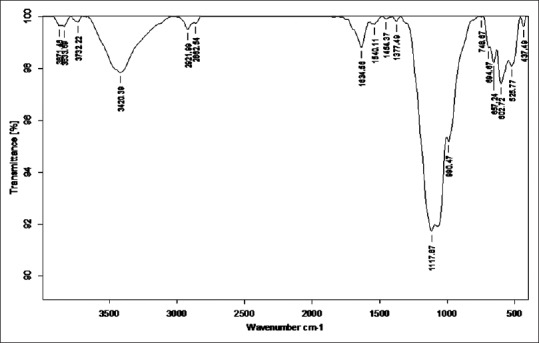
Fourier transform infrared of Tamra Bhasma without Amritikarana
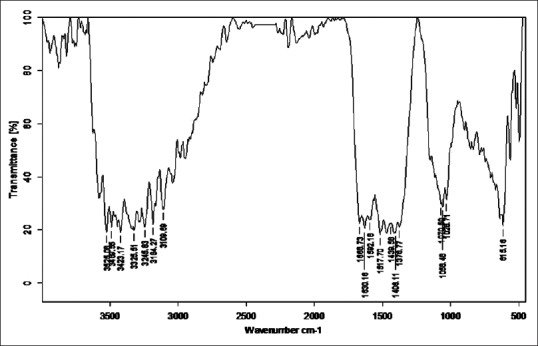
FTIR of Tamra Bhasma with Amritikarana
Total 6, 0, 1 and 5 peaks are obtained in above mentioned four FTIR regions respectively. Six peaks are obtained in an unknown region that is not specifically classified. Similar to sample TB, no peak is obtained in triple bond region. A given absorption band assigned to a functional group increases proportionately with the number of times that functional group occurs within the molecule. In this sample, Alkyl group is represented by four peaks raised due to C-H stretching vibrations at 1379.25, 2860.59 cm−1 assigned to methyl and at 2860.59, 2919.51 cm−1 to methylene. Two peaks (1634.24, 1634.24) are due to C = C stretching vibrations. Primary and secondary amines exhibit the most characteristic group frequencies, which are associated with the N-H bond. In this sample, primary amines are represented by the peak obtained at 3424.35 and 1634.24 cm−1. All these peaks are raised due to N-H stretching vibrations. However, similar N-H stretching vibrations resulted in multiple peaks at 2919.51, 2860.59 cm−1 that are assigned to ammonium ions. Three peaks 1059.24, 1113.50 and 1113.50 cm-1 were raised due to C-O stretching vibrations that are representative of alcohol, ether, ester group. Often, the frequency ranges for the different classes of carbonyl compound overlap, and the carbonyl frequency alone is not sufficient to characterize the functional group. In most cases, spectral information from the other component of the functional group is used for the characterization. Esters (C-O-C) and amides (C-N and N-H) are good examples. Three peaks at 1113.50, 1059.24 and 1634.24 cm−1 were obtained due to C-N vibrations having similar conjugation effects to C = O. Tertiary amines are very comparable to ethers, and the main diagnostic information is gathered from the C = N vibrations only. An important exception is the methylamino (and dimethylamino) group. Five peaks were observed due to C-X stretching vibrations. One weaker peak at 1377.49 cm−1 is raised due to N-O stretching vibrations similar in TB sample [Figure 10].
Figure 10.
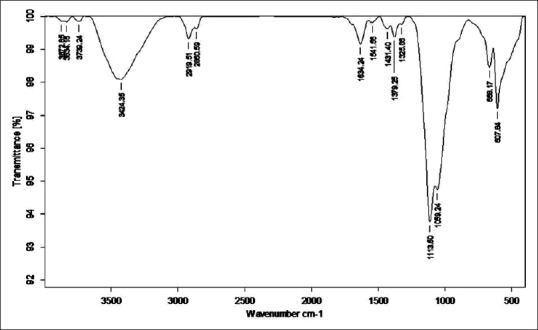
Fourier transform infrared of Tamra Bhasma with Amritikarana
Conclusion
It is evident from the present study that the treatment of raw Tamra with various treating liquids; some portion of Tamra gets converted into powder form and the surface consistency of copper changed from smooth to brittle rough. Hence, as per FTIR analysis, it can be interpreted that media used during Shodhana procedure and repeated strong heating followed by sudden cooling changes the surface consistency of Tamra. It also leads to the formation of bonds between surface particles of Tamra and atoms present in Shodhana media. These bonds on the surface of Shodhita Tamra samples gave various sharp peaks representing presence of many functional groups. FTIR analysis can be used as a tool to differentiate the Bhasmas prepared by different techniques. Present work can be considered as the first step towards identifying the followed methods through FTIR analysis. This is a preliminary analysis and exact nature of different peaks along with the characterization is to be carried-out.
Financial support and sponsorship
I.P.G.T and R.A., Gujarat Ayurved University, Jamnagar.
Conflicts of interest
There are no conflicts of interest.
References
- 1.Centers for Disease Control and Prevention (CDCP). Lead poisoning associated with ayurvedic medications – Five states, 2000-2003. MMWR Morb Mortal Wkly Rep. 2004;53:582–4. [PMC free article] [PubMed] [Google Scholar]
- 2.Dargan PI, Gawarammana IB, Archer JR, House IM, Shaw D, Wood DM. Heavy metal poisoning from Ayurvedic traditional medicines: An emerging problem? Int J Environ Health. 2008;2:463–74. [Google Scholar]
- 3.Saper RB, Phillips RS, Sehgal A, Khouri N, Davis RB, Paquin J, et al. Lead, mercury, and arsenic in US- and Indian-manufactured Ayurvedic medicines sold via the Internet. JAMA. 2008;300:915–23. doi: 10.1001/jama.300.8.915. [DOI] [PMC free article] [PubMed] [Google Scholar]
- 4.Sathe K, Ali U, Ohri A. Acute renal failure secondary to ingestion of ayurvedic medicine containing mercury. Indian J Nephrol. 2013;23:301–3. doi: 10.4103/0971-4065.114485. [DOI] [PMC free article] [PubMed] [Google Scholar]
- 5.Kulkarni DA, editor. Rasaratnasamucchaya of Vagbhatacharya, Ch. 5, Ver. 48. Reprint ed. New Delhi: Meherchand Lachamandas Publications; 2007. p. 100. [Google Scholar]
- 6.Kulkarni DA, editor. Rasaratnasamucchaya of Vagbhatacharya, Ch. 5, Ver. 47. Reprint ed. New Delhi: Meherchand Lachamandas Publications; 2007. p. 100. [Google Scholar]
- 7.Mishra VD, editor. Ayurveda Prakasha of Madhava Upadhyay, Ch. 3, Ver. 146. Reprint ed. Varanasi: Chaukhambha Bharti Acadamy; 2007. p. 373. [Google Scholar]
- 8.Kulkarni DA, editor. Reprint ed. New Delhi: Meherchand Lachamandas Publications; 2007. Rasaratnasamucchaya of Vagbhatacharya, Ch. 5, Ver. 13; p. 93. [Google Scholar]
- 9.Kulkarni DA, editor. Rasaratnasamucchaya of Vagbhatacharya, Ch. 5, Ver. 52. Reprint ed. New Delhi: Meherchand Lachamandas Publications; 2007. p. 101. [Google Scholar]
- 10.Kulkarni DA, editor. Rasaratnasamucchaya of Vagbhatacharya, Ch. 5, Ver. 53. Reprint ed. New Delhi: Meherchand Lachamandas; 2007. p. 101. [Google Scholar]
- 11.Shastri SK, translator. Rasa Tarangini of Sadanada Sharma, Ch.17, Ver. 40-42. 11th ed (Reprint) New Delhi: Motilal Banarsidas; 2009. p. 418. [Google Scholar]