Abstract
Oligonucleotides corresponding to neuraminidase (NA) stalk motifs that have been associated with enhanced influenza virulence have been identified using surface-enhanced Raman spectroscopy (SERS).. 5′-thiolated ssDNA oligonucleotides were immobilized onto a hexadecyltrimethylammonium bromide (CTAB) coated Au nanoparticles (AuNP). Three synthetic RNA sequences corresponding to specific amino acid deletions in the influenza NA stalk region were attached to the CTAB-modified AuNPs. Two of these sequences were specific to sequences with amino acid deletions associated with increased virulence, and one was a low virulence sequence with no amino acid deletions. Hybridization of synthetic matched and mismatched DNA-RNA complexes were detected based on the intrinsic SERS spectra. In addition, this platform was used to analyze RNA sequences isolated from laboratory grown influenza viruses having the NA stalk motif associated with enhanced virulence, including A/WSN/33/H1N1, A/Anhui/1/2005/H5N, and A/Vietnam/1203/2004/H5N1 strains.
Multivariate feature selection methods were employed to determine the specific wavenumbers in the Raman spectra that contributed the most information for class discrimination. A one-way analysis of variance (ANOVA) test identified 884 and 1196 wavenumbers as being highly significant in the high and low virulence spectra, respectively (p < 0.01). A post-hoc Tukey Honestly Significance Difference (HSD) test identified the wavenumbers that played a major role in differentiating the DNA-RNA hybrid classes. An estimate of the spectral variability, based on the Wilcoxon rank sum test, found the major source of variation to be predominately between the different classes, and not within the classes, thus confirming that the spectra reflected real class differences and not sampling artifacts. The multivariate classification methods partial least squares discriminant analysis (PLS-DA) and support vector machine discriminant analysis (SVM-DA) were able to distinguish between different NA stalk-motifs linked to NA-enhanced influenza virus virulence (NA-EIV) with >95% sensitivity and specificity in both synthetic RNA sequences as well as the isolated viral RNA. This study demonstrates the feasibility of SERS for direct identification of influenza NA stalk mutations associated with virulence without sample amplification or labeling.
Introduction
H5N1 avian influenza has raised global concerns due to its potential for a pandemic that could be associated with increased virulence in poultry and potentially humans. Avian influenza virus (AIV) is transmitted to hosts in part via the viral surface glycoproteins, hemagglutinin (HA) and neuraminidase (NA). HA recognizes receptors on target cells to initiate virus infection, while NA plays a critical role in assisting virus release from infected cells and entry to new cells by removing the terminal sialic acids from oligosaccharide side chains.1
The NA glycoprotein consists of four different domains, a cytoplasmic, transmembrane domain, stalk, and the globular head. The NA stalk region is located between an enzymatically and antigenically active globular head and the hydrophobic viral membrane anchored domains. This region varies in length and sequence among strains in the same subtype.2 Several studies have suggested that insertion, deletion, or mutation of amino acids in the NA stalk region correlates with increasing the virulence of virus, host range, and replication of virus.2–7 NA stalk-motifs have been shown to be linked in several cases to NA-enhanced influenza virus virulence (NA-EIV)6, 8, and have been increasingly observed in H5N1 isolates; for example, the number of NA-EIV found in highly pathogenic H5N1 influenza viruses increased ~85% from 2000 to 2007.1–6, 9–11 Thus, a better understanding of the correlation between NA-EIV and its biological characteristics related to influenza virulence is critical.
Six different stalk motifs have been described in the NA stalk region of all N1 subtype influenza virus A.12 These stalk-motifs are A/Gs/Gd/1/96/H5N1-like (with no amino acid deletion), A/WSN/33/H1N1-like (16 amino acid deletion from 57 to 72), A/Puerto Rico/8/34/H1N1-like (15 amino acid deletion from 63 to 77), A/Chicken/Italy/1067/99/H7N1-like (22 amino acid deletion from 54 to 75), and A/chicken/Hubei/327/2004/H5N1-like (20 amino acid deletion from 49 to 68). The presence of these NA-EIV stalk motifs has been associated with H5N1 pathogenicity in reverse genetics studies.6
PCR has been widely used for a rapid, sensitive, and selective screening for virulence markers. However, this method is based on the amplification of analyte for detection and relies on the design of primers, which is time-consuming and costly, and is also prone to false-positives or false-negatives caused by the carry-over contamination.13, 14 In addition, detection of new, emerging pathogens can be a problematic. For these reasons, there is a critical need for development of a biosensing tool to identify emerging influenza viruses in a rapid and sensitive manner with a high specificity.
Our research group has previously demonstrated a feasibility of surface-enhanced Raman spectroscopy (SERS) as a rapid, sensitive, and specific tool for detecting oligonucleotide probe-RNA target complexes in a direct and label-free manner.15–20 The intrinsic properties of Raman spectra provide a unique spectral signature of SERS, sensitive enough to identify the extent of hybridization between DNA and target sequences. This method has become a widely used technique for diagnostic applications. Our recent work demonstrated a detection of DNA-RNA binding by using oligonucleotide-modified Ag nanorod array based SERS and differentiated DNA probe-complementary RNA strains from the DNA probes with non-complementary RNA sequence via multivariate analysis.19, 20
The current work aims to identify potential influenza virulence factors that occur from deletion of amino acid sequences in the NA stalk region using SERS. We show that SERS-active nanostructures fabricated from modified Au nanoparticle (AuNP) films can be used for detection of NA-EIV without sample amplification or labeling. These findings show the potential use of oligonucleotide-modified SERS substrates for screening of potential influenza virulence factors.
Experimental Methods
Materials
Citrate stabilized 60 nm Au nanoparticles (AuNPs) were purchased from Ted Pella, Inc. (Redding, CA). Hexadecyltrimethylammonium bromide (CTAB), 3-mercaptopropyl trimethyoxysilane (3-MPTMS), 6-mercapto-1-hexanol (MCH), and 4-aminothiophenol (4-ATP) were purchased from Sigma-Aldrich (St. Louis, MO). All other chemicals were of analytical grade and used without any further purification.
Fabrication of AuNP Monolayers on Au Film Substrates
Silicon wafers or glass microscope slides of dimensions 1 × 1 cm2 were cleaned with heated Piranha solution (4:1 conc. H2SO4 : 30% H2O2) followed by a rinsing step deionized water and a drying step with a gentle stream of N2. A custom designed thermal evaporator was used to produce a Au film substrate prior to the fabrication of the AuNP monolayer. Uniform layers of 20 nm Cr and 200 nm Au were deposited onto the underlying Si or glass substrates. The thickness of the Au film layer was determined by a quartz crystal microbalance (QCM) in the evaporator chamber. Diamine hexaethylene glycol 11-(10′-carboxy-decyldisulfanyl)undecanoic amide, which is a bifunctional disulfide/amine linker (20 μL), was added onto each Au film substrate for 3 hours to produce amine-terminated substrates allowing attachment of the AuNPs to the underlying Au coated substrate.
The 60 nm AuNPs were centrifuged at 8000 rpm for 10 minutes to obtain the desired AuNP concentration (~1×10¹¹ particles/mL); 7 mL of this colloidal solution was placed in 5 cm petri dish. CTAB was functionalized onto AuNPs by forming self-assembled bilayers, as previously described.21 CTAB (385 μL of 5×10⁻⁶ M solution) was added to the AuNP colloidal solution. Hexane (3.5 mL) was added to the surface of the AuNP solution to provide a water/hexane interface. Ethanol (3.5 mL), used as low dielectric solvent, was added drop wise (350 μL/min) to drive the AuNPs to the water/hexane interface until a monolayer of AuNPs was formed. The AuNPs were then transferred to the thiolated Au film by dipping the film into the solution at incident angle of approximately 45°. Scanning electron microscopy (SEM) was performed on these substrates using a FEI (Hillsboro, OR) Inspect F FEG SEM at a 20 kV acceleration voltage.
Reproducibility study of CTAB-coated AuNP substrates
To access the reproducibility of the fabrication method used in this study, SERS spectra were compared from substrates fabricated from within the same batch, and between different batches. SERS measurements were carried out on a Renishaw (Hoffman Estates, IL) inVia Raman microscope. Parameters used for measurements were: 785 nm laser excitation source, 0.1% laser power, 10 second acquisition time, 1 accumulation, and a 1800 – 600 cm−1 spectral range. Ten microliters of a 1 mM 4-ATP solution in ethanol (EtOH) was dropped onto the AuNP substrate and allowed to evaporate. Three separate batches of substrates were made. Three substrates were prepared for each batch and SERS spectra were collected from eight different spots on each substrate. Ten microliters of the 4-ATP solution were also placed onto an Au coated substrate that had been functionalized with MPTMS without AuNPs for control experiments.
Immobilization of DNA probes and RNA strains onto AuNP substrates
DNA probes and synthetic RNA target sequences were purchased from Integrated DNA Technologies (IDT, Coralville, IA). The 5′C6 thiolated ss-DNA probes were lyophilized and dissolved in molecular biology grade water at concentration of 1000 nM. The high and low virulence 5′-thiol single stranded DNA (ssDNA) oligonucleotide probes were immobilized on the CTAB coated AuNP surface to detect RNA sequences corresponding to specific NA stalk motifs. Self-assembled monolayers of ssDNA probes on the AuNP substrates were formed by addition of 20 μL of the 1000 nM oligonucleotide solution to the substrate, followed by incubation overnight at room temperature. After the incubation period, any unbound oligonucleotide solution was removed from the substrate by rinsing it three times with molecular biology grade water and then dried with N2. Minimization of non-specific binding of DNA-RNA molecules was accomplished by addition of 20 μL of a 100 nM solution of the spacer molecule 6-mercapto-1-hexanol (MCH). The MCH solution was incubated for 6 hours at room temperature followed by the rinsing and drying steps. Hybridization of the various synthetic RNA targets was accomplished by addition of 20 μL of 1000 nM synthetic RNA solution diluted in the binding buffer to the oligonucleotide-functionalized AuNP substrate, and then incubated at 37°C for 2 hours under a humid environment to avoid dehydration. After the incubation, any non-specifically adsorbed RNA molecules were removed by rinsing with buffer prior to a final wash using molecular biology grade water. The rinsed substrate was then dried with a gentle stream of N2. The buffer used in the hybridization procedure was prepared by dissolving 20 mM Tris HCl, 15 mM NaCl, 4 mM KCl, 1 mM MgCl2, and 1 mM CaCl2 in molecular biology grade water at pH 7.3, and stored at 4°C when it is not in use. The buffer and working tools were DNase free. The same procedures were performed for the influenza RNA isolates to allow for the binding with DNA probe.
RNA isolates from influenza viruses
RNAs were isolated from three different influenza viruses having the NA stalk motif associated with enhanced virulence. These are the A/WSN/33/H1N1, A/Anhui/1/2005/H5N, and A/Vietnam/1203/2004/H5N1 influenza strains. Viruses were grown as previous described.19 An RNAzol protocol was used for isolation of the RNA. In this procedure, 4×200 μL tubes of each virus were thawed, and 0.5 mL RNAzol®RT was added. To homogenize, the samples were pipetted up and down 5–8 times in RNAzol and stored at −20 °C, followed by the addition of 0.2 mL of H2O to the homogenate, and then incubated for 10 min at room temperature. The resulting solution was centrifuged at 12,000×g for 15 minutes until no blue globules are floating in the supernatant. The supernatant are then transferred into a new separate tube and 700 μL of 100% isopropanol were mixed together. 1 μL of PolyAcryl Carrier was added and incubated for 15 minutes at room temperature. The supernatant was discarded after the centrifugation at 12,000×g for 10 minutes. The RNA pellet was washed twice with 0.4 mL of 75% EtOH. After the EtOH washing steps, the solution was centrifuged at 4,000×g for 3 minutes. After the reconstitution of RNA with 20 μL of H2O, virus RNA purity and concentration was quantified by UV-Vis spectrometry (Thermo Fisher NanoDrop 1000). The concentrations of the influenza samples obtained from these procedures are summarized in Table 2.
Table 2.
Sequences of the DNA probe, and corresponding RNA capture sequences, from the NA stalk region of the laboratory influenza strains
| A/Gs/Gd/1/96/H5N1 (Position 40 to 48) | |
| Thiolated DNA probe | 5′-/5ThioMC6-D/TTTTT TCC CTG TCT GAA TTG AAT GAC TGA CCC-3′ |
|
| |
| A/WSN/33/H1N1 | |
| RNA sequences | …GGATTAGCCATTCAATTCAAACCGGAA …… |
| A/Anhui/1/2005/H5N1 | |
|
| |
| RNA sequences | …GGGTCAGTCATTCAATTCAAACAGGGA….. |
| A/Vietnam/1203/2004/H5N | |
|
| |
| RNA sequences | …GGGTCAGTCATTCAATTCACACAGGGA…. |
Raman Spectroscopy
A Renishaw InVia Raman microscope (Renishaw, Inc., Hoffman Estates, IL) was used to collect SERS spectra of the DNA probes and DNA-RNA hybrids. A 785 nm near-infrared (NIR) diode laser was used for the laser excitation. The incident laser beam was directed onto the laser illumination spot with the dimension of 4.8 × 27.8 μm through a 20× objective (NA = 0.40) with the laser power of 0.5%. SERS spectra with the spectral range from 1800 to 400 cm−1 were collected by using 30-second acquisition times with one accumulation.
Data Analysis
Prior to the data analysis, the raw spectra were preprocessed by using a 1st order derivative, 15 data points, 2nd – order polynomial Savitzky-Golay algorithm, normalized to unit vector length, and then mean centered; the resulting spectra were used for all subsequent data analysis. The quality of each collected spectrum was assessed by performing principal component analysis (PCA) to find potential outliers; outliers were determined based on their corresponding PCA scores in combination with Hotelling T2 and Q residual tests.22 ANOVA along with post-hoc Tukey Honestly Significance Difference (HSD) test was used for a spectral feature selection.23, 24 A test for the sources of the spectral variability was performed based on a calculated spectral amplitude (D) in combination with a Wilcoxon rank sum test.23, 25 Multivariate analysis methods such as partial least squares discriminate analysis (PLS-DA), and support vector machine discriminate analysis (SVM-DA) were employed for classification of the SERS spectra.26–32 All data processing was performed in MATLAB R2012a (The Mathworks Inc., Natick, MA) using programs written in our laboratory.
Results and Discussion
Nanofabrication of AuNP substrates
The preparation of the AuNP films used in these experiments was primarily influenced by the concentration of CTAB and the amount of EtOH used to form the hexane/ethanol interface. CTAB reduces the negative surface charge of the AuNPs and leads to a net positive charge, thus preventing aggregation by inducing a net repulsive interaction between nanoparticles.21, 33–39 In addition, CTAB is bound to the AuNP surface by Coulombic forces,21, 40, 41 therefore it is easily displaced by self-assembling molecules such as the disulfide-modified DNA oligonucleotides used in these experiments. The concentration of AuNPs in all experiments was kept constant at 1×10¹¹ particles/ml, and the extent of aggregation was determined by analyzing the AuNP plasmon at 520 nm by UV-Vis spectroscopy. A CTAB concentration that induced AuNP aggregation, as indicated by elongated or shifted bands, was discarded. The optimal concentration of CTAB used in this study was 5×10⁻⁶ M.
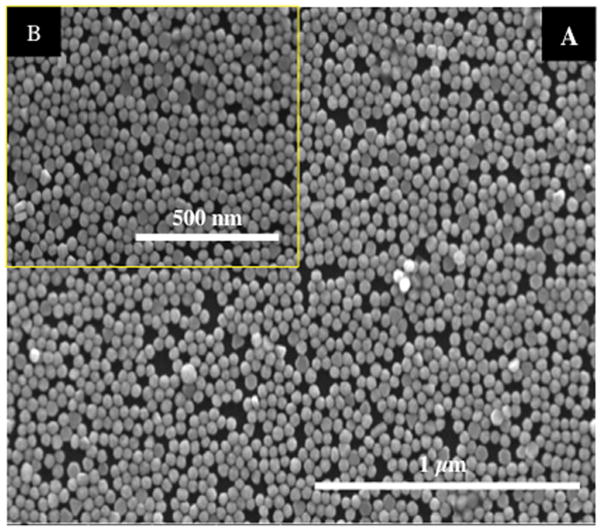
Addition of the low dielectric solvent EtOH to the aqueous phase changes the polarity of the aqueous phase and traps AuNPs at water/hexane interface.21 The addition of EtOH decreases the surface charge density of the AuNPs, causing their movement to the water/hexane interface.42 In this study, the total volume of 3.5 mL EtOH was added drop wise (350 μL/min) to the solution. SEM images of AuNP monolayer transferred from the water/hexane interface onto SEM grids are shown in Fig. 1.
Figure 1.
(A) SEM images of CTAB-immobilized AuNP on silicon wafer substrate (80,000× magnification) (B) SEM images (160,000× magnification)
Reproducibility of AuNP substrates
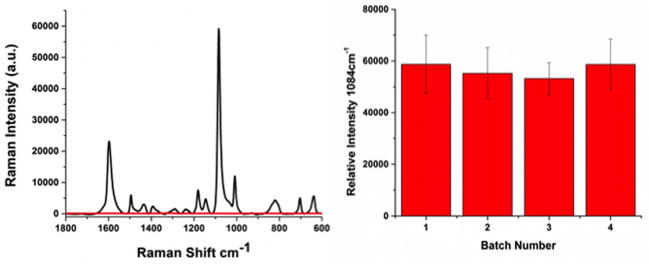
4-aminothiophenol (4-ATP) was used as a probe molecule to assess overall spectral reproducibility of these AuNP substrates. The average spectra for 1mM 4-ATP on CTAB AuNP substrates as well as a blank Si wafer are shown in Figure 2A. The characteristic bands for 4-ATP in SERS spectra match closely with what has been reported in literature.43 For determination of reproducibility, SERS spectra were baseline corrected, averaged and the standard deviation calculated. The intensity of the band at 1084 cm−1 was used as a measurement of the reproducibility of the SERS substrates. The relative standard deviation (RSD) across a signal collected from the same substrate, from substrates fabricated in the same batch, and substrates prepared in different batches are 9%, 16%, and 16% respectively, as shown in Figure 2B.
Figure 2.
Figure 2A. (A) SERS spectra of 4-ATP on AuNP monolayer (black solid line) and on bare substrate (red solid line). (B) Reproducibility of SERS signal at 1084 cm−1 from different batches
DNA probes
5′-C6 thiolated ssDNA probes were designed to capture RNA from both high and low NA-EIV determinants; the DNA probes were immobilized onto CTAB-coated AuNP substrates as described in the Methods section. NA stalk-motif strains used in the study of synthetic RNAs are listed in Table 1: i) A/Gs/Gd/1/96/H5N1-like (no amino acid deletions in the NA stalk region), ii) A/ck/Hubei/327/2004/H5N1-like (20 residues deleted between amino acids 49 and 68), and iii) A/WSN/33/H1N1-like (16 residues deleted between amino acids 57 and 72). High NA-EIV A/ck/Hubei/327/2004/H5N1 and low NA-EIV A/Gs/Gd/1/96/H5N1 were used as DNA probes to capture three different NA stalk-motif strains. In addition to these samples, a blank DNA probe-spacer complex before hybridization was used as a control oligonucleotide sequence. The pathogenesis criteria described by the OIE (Office International Des Epizooties, World Organization for Animal Health, Paris) defined highly pathogenic avian influenza virus (HPAIV) and low pathogenic avian influenza virus (LPAIV) based on an intraveneous pathogenesis index (IVPI). The virus with IVPI value greater than 1.2 is defined as HPAIV and with value lower than 1.2 is considered as LPAIV. Previously, the contribution of these NA-EIV motifs to the virulence of a H5 virus was assessed using reverse genetics. These NAs were incorporated into a H5N1 virus with a HA poly-basic cleavage site, which is a well-defined pathogenicity determinant,44 and tested for changes in virulence by IVPI and in mouse challenge studies. Based on OIE criteria, viruses containing the A/ck/Hubei/327/2004/H5N1 NA-EIV or A/WSN/33/H1N1 NA-EIV were categorized as highly pathogenic, whereas A/Gs/Gd/1/96/H5N1 NA-EIV was defined as low pathogenic. These viruses also displayed increased virulence in mice.6 While this work addresses the specific role of NA stalk deletion motifs on enhanced virulence, it is also known that pathogenicity in influenza is a multifactorial trait.44
Table 1.
Amino acid, DNA probe, and complementary synthetic RNA sequences
| High NA-EIV | A/ck/Hubei/327/2004/H5N1 (Position 51 to 59) |
|
| |
| Amino acid | N T N F L T E K A |
| Thiolated DNA probe | 5′-/5ThioMC6-D/TTTTT AAT TAG TAT TGC TGA TTG GTT CAG CTT-3′ |
| Complementary RNA target | 5′-rArArG rCrUrG rArArC rCrArA rUrCrA rGrCrA rArUrA rCrUrA rArUrU-3′ |
|
| |
| High NA-EIV | A/WSN/33/H1N1 (Position 52 to 60) |
|
| |
| Amino acid | G S I T Y K V V A |
| Complementary RNA target | 5′-rArUrA rCrUrG rGrArA rUrArU rGrCrA rArCrC rArArG rGrCrA rGrCrA-3′ |
|
| |
| Low NA-EIV | A/Gs/Gd/1/96/H5N1 (Position 40 to 48) |
|
| |
| Amino acid | T G N Q H Q A E P |
| Thiolated DNA probe | 5′-/5ThioMC6-D/TTTTT TCC CTG TCT GAA TTG AAT GAC TGA CCC-3′ |
| Complementary RNA target | 5′-rGrGrG rUrCrA rGrUrC rArUrU rCrArA rUrUrC rArGrA rCrArG rGrGrA-3′ |
In the studies on the RNA isolated from influenza lab strains, one 5′-thiol single stranded DNA (ssDNA) oligonucleotide probe was designed to detect three different NA stalk isolates. The sequence from the influenza A/Gs/Gd/1/96/H5N1-like strain with no amino acid deletions was used as the DNA probe to capture RNAs isolated from viruses having the NA stalk motif associated with high virulence, namely influenzas A/WSN/33/H1N1-like, A/Anhui/1/2005/H5N, and A/Vietnam/1203/2004/H5N1. Table 2 provides the sequence of the DNA probe used in these experiments, as well as the target sequences in the NA stalk region of the isolated influenza RNAs that were captured by this probe. Table 3 provides the concentration of the isolated influenza RNAs used in these experiments. In addition to these samples, the DNA probe-spacer complex before hybridization was used as a control in these studies.
Table 3.
Concentration of the laboratory influenza strains used in these studies
| Virus Strain | Concentration (ng/μL) | Ratio A260/A280 |
|---|---|---|
| A/WSN/33 (H1N1) | 4.7 | 1.50 |
| A/Vietnam/1203/2004 (H5N1) | 3.2 | 1.26 |
| A/Anhui/1/2005 (H5N1) | 3.0 | 1.68 |
SERS spectra
Figures 3A and 3B show representative, unprocessed spectra for the oligonucleotide complexes corresponding to the high and low NA-EIV sequences, respectively; each spectrum is an average of 20 individual unprocessed spectra for each sample. Figure 3A presents SERS spectra of high NA-EIV DNA probe-spacer complex alone (I), high NA-EIV DNA-probe hybridized with complementary high NA-EIV A/ck/Hubei/327/2004/H5N1 (II), and the spectra of high NA-EIV DNA-probe incubated with non-complementary low NA-EIV A/Gs/Gd/1/96/H5N1 (III) and non-complementary high NA-EIV A/WSN/33/H1N1 (IV). Figure 3B shows SERS spectra of low NA-EIV DNA probe-spacer complex alone (I), the spectra of low NA-EIV DNA-probe incubated with complementary low NA-EIV A/Gs/Gd/1/96/H5N1 (II), non-complementary high NA-EIV A/ck/Hubei/327/2004/H5N1 (III), and A/WSN/33/H1N1 (IV).
Figure 3.
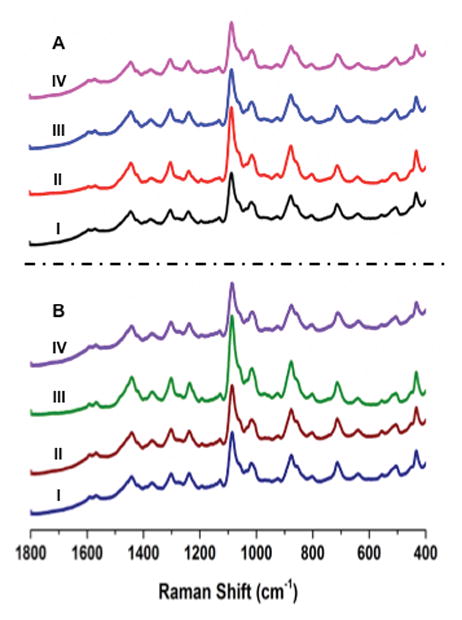
(A) SERS spectra of the high NA-EIV DNA probe with targets. Each spectrum in this figure is an average of 20 unprocessed SERS spectra.
I) High NA-EIV DNA probe with MCH spacer on AuNP substrate. Also, high NA-EIV DNA probe-spacer complex incubated with: II) high NA-EIV A/ck/Hubei/327/2004/H5N1, III) low NA-EIV A/Gs/Gd/1/96/H5N, and IV) high NA-EIV A/WSN/33/H1N1.
(B) SERS spectra of the low NA-EIV DNA probe with targets. Each spectrum in this figure is an average of 20 unprocessed SERS spectra.
I) Low NA-EIV DNA probe with MCH spacer on substrate. Also, low NA-EIV DNA probe-spacer complex incubated with : II) low NA-EIV A/Gs/Gd/1/96/H5N1, III) high NA-EIV A/ck/Hubei/327/2004/H5N1, and IV) high NA-EIV A/WSN/33/H1N1 RNA sequences.
Although the spectra in Fig. 3 were collected from different DNA-RNA hybrids, both matched and mismatched, their spectral features are very similar. The dominant features corresponding to nucleic acids, e.g. 1332, 1089, 1023, 793, and 623 cm−1, can be found in the spectra in both panels. These spectral similarities make it difficult to easily distinguish between the different hybridization classes; thus multivariate analysis is needed for detailed spectral analysis.
Feature selection
Feature selection was performed to determine the wavenumbers that contribute the most information for the best class discrimination. A one-way analysis of variance (ANOVA) followed by a post-hoc Tukey Honestly Significance Difference (HSD) test were used.23, 24 First, an ANOVA comparison between the spectral intensities of four different classes was conducted at every spectral location between 400 and 1800 cm−1. The four classes for high NA-EIV assay were: i) high NA-EIV DNA probe-MCH spacer complex before hybridization, ii) high NA-EIV DNA probe fully hybridized with complementary high NA-EIV A/ck/Hubei/327/2004/H5N1 sequence, iii) high NA-EIV DNA probe mismatched hybridization with non-complementary low NA-EIV A/Gs/Gd/1/96/H5N1, and iv) high NA-EIV A/WSN/33/H1N1. For low NA-EIV assay were low NA-EIV DNA probe with MCH spacer alone, low NA-EIV DNA probe fully hybridized with complementary low NA-EIV A/Gs/Gd/1/96/H5N1, low NA-EIV DNA probe incubated with none-complementary high NA-EIV A/ck/Hubei/327/2004/H5N1 and high NA-EIV A/WSN/33/H1N1. Consideration of the null hypothesis (Ho = μ1 = μ2 = ··· = μn, where μn represents the mean spectra of nth class) was made by means of ANOVA at every spectral location with 99% confidence limits (α = 0.01).24, 45–47
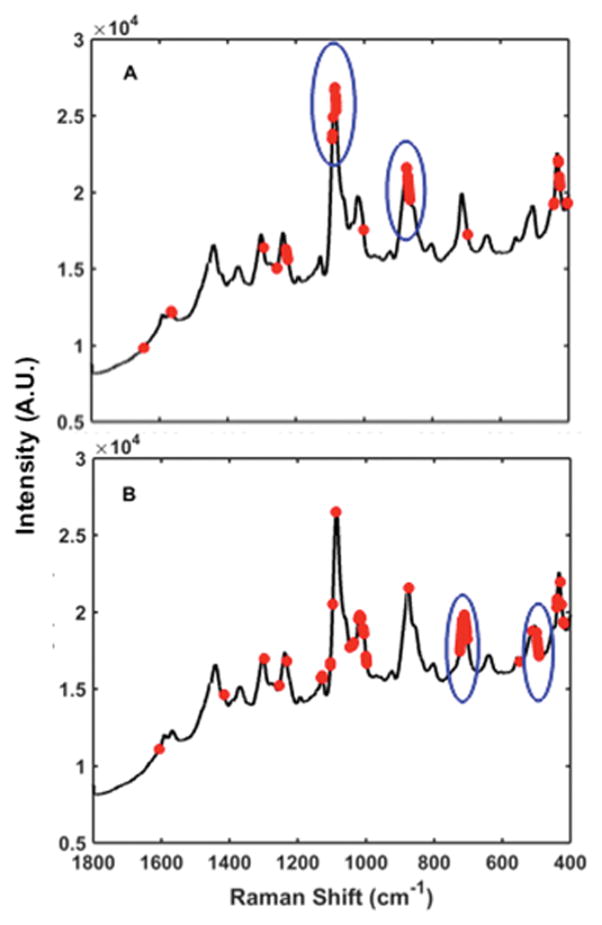
Based on the ANOVA test, 884 and 1196 spectral locations were selected as being significantly different in the high NA-EIV and low NA-EIV spectra, respectively, with p-values less than 0.01. A post-hoc Tukey HSD test23 was carried out after the ANOVA test; the HSD test consists of a statistical multiple pairwise comparisons across each wavenumber to identify the spectral locations in which the classes differ most from one another. The red dots in Figs. 4A and 4B denote the 61 and 91 wavenumbers identified by the post-hoc Tukey test as being statistically different for the high NA-EIV and low NA-EIV assay, respectively. Most notably, spectral features characteristic of the high NA-EIV assay were identified at 865 – 876 cm−1 (CCN stretching, NH bending, C-C skeletal stretching) and 1082 – 1094 cm−1 (C-C skeletal stretching, CN stretching, C-NH2), which may correspond to amino groups in cytosine and thymine/guanine, respectively. For the low NA-EIV assay, characteristic bands were located at 490 – 511cm−1 (CNC, NCC bending), which corresponding to ring bending region of thymine and 700 – 724 cm−1 (ring stretching vibration) from purines in guanine.48, 49 The bands identified in the two categories may indicate how the amino group is coordinated to the surface of the substrate, as well as the configuration of DNA-RNA binding in the different classes.
Figure 4.
SERS spectra with selected wavenumbers (red circle) of (A) High NA-EIV assay, and (B) Low NA-EIV assay. The characteristic spectral features of the high NA-EIV and low NA-EIV assay are red circled around peaks.
Spectral variability study
Assessment of the sources of spectral variability is a critical factor in this study. Examination of the source of spectral variability tests the possibility that the observed spectral differences are caused by differences in the sample, as opposed to the experimental methods. In other words, these calculations are designed to test whether the source of the variability identified by the ANOVA and post-hoc Tukey tests is among a class (i.e. dependent on the analyte), or within the classes (i.e. dependent on instrumental or experimental sources).
Spectral variability was first determined via computation of a spectral amplitude, or D metric, which is calculated using the follow equation.23–25
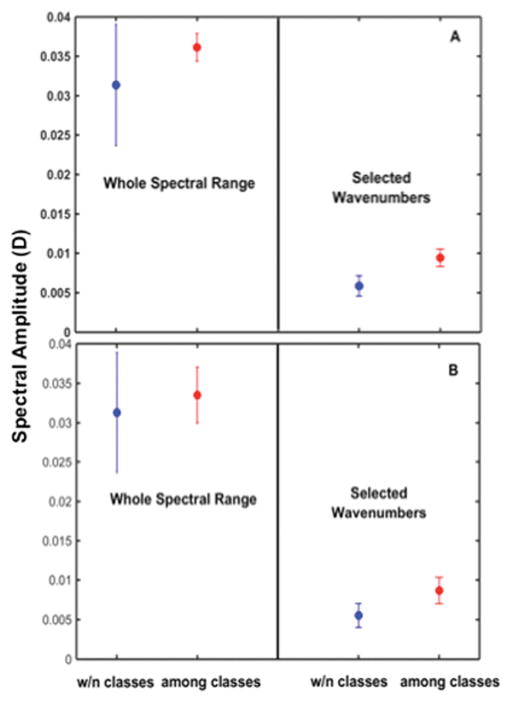
In this equation, D is the root mean squared averaged sum of the square of the differences between spectral responses S1 and S2 over the spectral interval λa and λb. The total number of pairwise combinations used to calculate D for the within-class and among-class cases were 45 and 100, respectively. The computation of the spectral amplitude D was done twice: 1) using the whole spectral range, and 2) using only the most significant wavenumbers calculated from the ANOVA and post-hoc Tukey tests, as shown in Figs. 4A and 4B for the high NA-EIV and low NA-EIV spectra, respectively.
Using the calculated values for the spectral amplitudes, D, a Wilcoxon rank sum test23 was performed for a quantitative statistical comparison between the among-class and within-class cases. The Wilcoxon’s rank sum test tests for the equality of medians in two populations, in this case, the calculated spectral amplitudes, D, of the two cases, among-classes (i.e. analyte-dependent), or within-classes (i.e. experimental dependent).
The left side panels in Figs. 5A and 5B show the results of the Wilcoxon rank sum test when the whole spectral range was used for the high NA-EIV (Fig. 5A) and low NA-EIV (Fig. 5B) complexes. In these cases, p-values were 0.91 and 0.26 illustrating no statistically significant difference in the spectral variability either among or within the classes.
Figure 5.
Comparison of spectral variability results based on the whole spectral range and selected wavenumbers: (A) High NA-EIV assay, and (B) Low NA-EIV assay.
However, when the D values were calculated based only on the wavenumbers chosen by the post-hoc Tukey feature selection method as being characteristic of each class (Fig. 4), the results dramatically differs. The right side panels in Figs. 5A and 5B show a significant difference in the spectral amplitude calculated for the among-class and within-class cases. In both the high and low NA-EIV, the Wilcoxon ranks are significant at p-values of 0.01. These values mean that the spectral variability, as indicated by the D values, are dominated by among-class (i.e. analyte) rather than within-class (i.e. non-analyte) variances. These results demonstrate that the main source of spectral variability is the DNA-RNA complex sample itself rather than any non-analyte spectral variances caused by experimental conditions, e.g. instrument, method, or substrate.
Classification
As described above, certain wavenumbers selected by ANOVA/post-hoc Tukey tests were shown to be statistically significant in assigning the source of the variability to the analytes. We have used these wavenumbers in multivariate analyses to distinguish the extent of hybridization in the spectra of the high and low NA-EIV DNA-RNA hybrids for classification. We employed two separate classification algorithms for this purpose: partial least-squares discriminant analysis (PLS-DA)30–32 and support vector machine discriminant analysis (SVM-DA).26, 27
PLS-DA was used to develop classification models to discriminate DNA-target hydridization from non-complementary RNA hybrids and control RNA. Cross-validation (Venetian blinds, 8 splits) was performed for internal validation, with 4 and 3 optimal latent variables (LVs) selected to build the classification model for the high and low NA-EIV complexes, respectively. The optimized classification model was then used for the class predictions in the validation set.
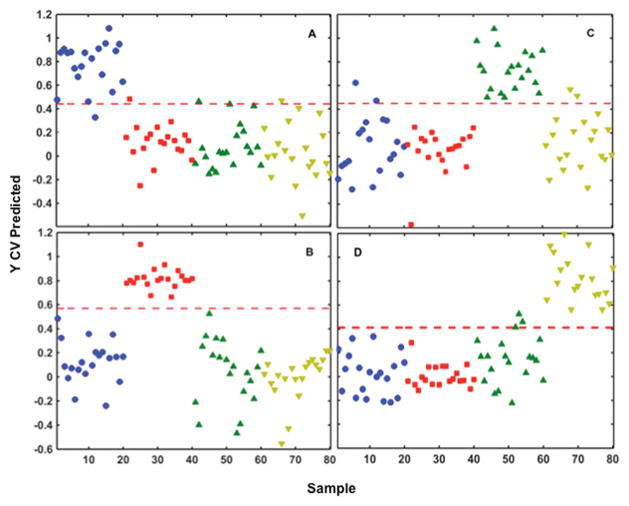
The multi-classification results from the PLS-DA calculations are shown in Figure 6. Figure 6 represents the prediction results for the high NA-EIV assay. This Figure represents the four classes as different colors/symbols, including, i) the high NA-EIV DNA probe-MCH spacer complex before hybridization (blue circle ●), ii) the high NA-EIV DNA probe fully hybridized with its complementary high NA-EIV A/ck/Hubei/327/2004/H5N1 (red square ■), and the high NA-EIV DNA probe mismatched hybridization with its non-complementary iii) high A/WSN/33/H1N1 (green triangle ▼), and iv) low NA-EIV A/Gs/Gd/1/96/H5N1 (yellow inverted triangle ▲). Each different colored symbol represents a different DNA or DNA-RNA hybrids.
Figure 6.
PLS-DA prediction plots for the high NA-EIV assay. A total of 80 spectra are represented in each plot, with 20 replicates in each group. Each colored symbol represents the PLS predicted value for an individual SERS spectrum after incubation of synthetic RNA strains at 37°C for 2 hours with the high NA-EIV DNA probe. The threshold for class discrimination is indicated by the red dashed line.
(A–D) Each colored symbol represents SERS spectra containing: the high NA-EIV RNA strains of A/ck/Hubei/327/2004/H5N1 (
 ), and A/WSN/33/H1N1 (
 ) and the low NA-EIV RNA strains of A/Gs/Gd/1/96/H5N1 (
 ) incubated with high DNA probe. High NA-EIV DNA probe with MCH spacer was used as a control (
 ).
).
In Fig. 6, the optimum PLS calculated discriminant threshold based on Bayes’ Theorem 50 is represented as red dashed line. In each panel, SERS spectra with cross validated predicted values greater than the threshold are classified as belonging to the group, while spectra that fall below the threshold were considered to be the outside of the group. Table 4 summarizes the sensitivity, specificity, class error, and root mean square error of cross-validation (RMSECV) of PLS-DA model for the high NA-EIV. The results show ~91 – 100% sensitivity and specificity with RMSECV value of 0.237, 0.219, 0.254, 0.202, respectively for each classification model.
Table 4.
PLS-DA Results for the low and high synthetic RNA NA-EIV Assays.
| Low NA-EIV | High NA-EIV | |||||||
|---|---|---|---|---|---|---|---|---|
| Full Hybridization | Partial/No Hybridization | Full Hybridization | Partial/No Hybridization | |||||
| Sensitivity (CV) | 0.950 | 1.000 | 1.000 | 1.000 | 1.000 | 0.950 | 1.000 | 1.000 |
| Specificity (CV) | 0.967 | 0.983 | 0.983 | 1.000 | 1.000 | 0.917 | 0.933 | 0.967 |
| Class Error (CV) | 0.0417 | 0.008 | 0.008 | 0.000 | 0.000 | 0.0667 | 0.033 | 0.0167 |
| RMSECV | 0.249 | 0.181 | 0.208 | 0.128 | 0.219 | 0.237 | 0.254 | 0.202 |
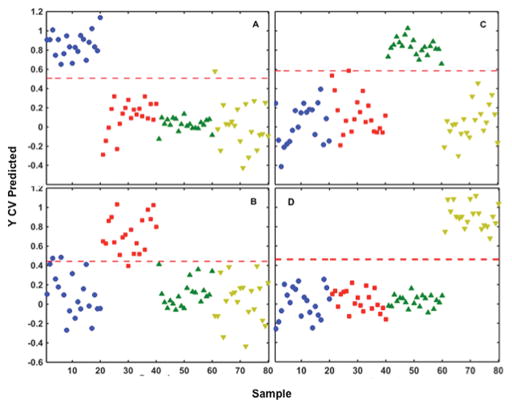
Figure 7 shows the analogous PLS-DA classification model results for the low NA-EIV model. Similar to the high NA-EIV model shown in Fig. 6, this Figure represents: i) the low NA-EIV DNA probe-MCH spacer before hybridization (blue circle ●), ii) the low NA-EIV DNA probe fully hybridized with its complementary low NA-EIV A/Gs/Gd/1/96/H5N1 (red square ■), and the low NA-EIV DNA probe mismatched hybridization with its non-complementary iii) high A/WSN/33/H1N1 (green triangle ▲), and iv) high NA-EIV A/ck/Hubei/327/2004/H5N1 (yellow inverted triangle ▼). Table 4 summarizes the PLS-DA classification results for these DNA-RNA spectra: 95 – 100% sensitivity and specificity with RMSECV value of 0.181, 0.249, 0.208, 0.128, respectively for each classification model in the low NA-EIV assay. The results from the PLS-DA classification method shown in Figs. 6 and 7, as summarized in Table 4, indicate a high classification accuracy for both high and low NA-EIV classification models, albeit with relatively high values of RMSECV.
Figure 7.
PLS-DA prediction plots for the low NA-EIV assay. A total of 80 spectra are represented in each plot, with 20 replicates in each group. Each colored symbol represents the PLS predicted value for an individual SERS spectrum after incubation of synthetic RNA strains at 37°C for 2 hours with the low NA-EIV DNA probe. The threshold for class discrimination is indicated by the red dashed line.
(A–D) The colored symbols represents SERS spectra containing: the low NA-EIV RNA strains of A/Gs/Gd/1/96/H5N1 (
 ) and the high NA-EIV RNA strains of A/ck/Hubei/327/2004/H5N1 (
 ), and A/WSN/33/H1N1 (
 ) incubated with low NA-EIV DNA probe. Low NA-EIV DNA probe with MCH spacer was used as control (
 ).
).
We have also employed SVM-DA to analyze the SERS spectra for classification. Support vector machines is a boundary classification method more suitably designed to analyze complex and nonlinear hyperspectral datasets.26–28 In this analysis, a radial basis function (RBF) kernel was used and SVM classification model was developed based on the optimal SVM parameters (C and γ). The calibration set was first compressed by using optical latent variables determined by principal least-squares (PLS) calculation. The optimized SVM parameters, penalty error (C = cost) and the radial width (γ), were selected by a cross-validation (Venetian blinds, 5 splits). The values used were γ = 0.003 and C = 100 for the high NA-EIV assay and γ = 0.0001 and C = 100 for the low NA-EIV assay. A total of 30 and 75 support vectors were used for high and low virulence assay, respectively.
Figure 8A illustrates the SVM-DA classification results for the high NA-EIV assay. Each different colored symbols represent different hybridization stages, including i) highNA-EIV DNA probe before hybridization (blue circle ●), ii) high NA-EIV DNA probe hybridized with its complementary high NA-EIV A/ck/Hubei/327/2004/H5N1 (red square ■), and the high NA-EIV DNA probe with non-complementary iii) high NA-EIV A/WSN/33/H1N1 (green triangle ▲), and iv) low NA-EIV A/Gs/Gd/1/96/H5N1 (yellow inverted triangle ▼). Figure 8 indicates extremely high accuracy of classification. Table 5 summarizes the SVM classification results for high virulence assay: a sensitivity of 1.000, 1.000, 1.000, 0.950, and specificity of 1.000, 1.000, 0.983, 1.000 for each class model with RMSECV of 0.0125. This RMSECV shows a factor of 20 lower value relative to the PLS-DA classification model.
Figure 8.
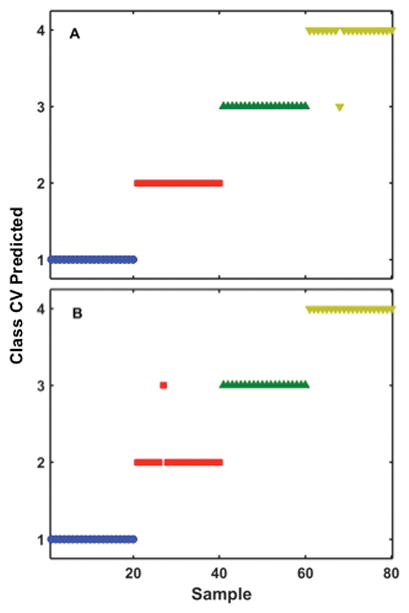
SVM-DA cross-validation (CV) predicted plots for (A) high, and (B) low NA-EIV assays. A total of 80 spectra are represented in this plot, with 20 replicates in each group. Each colored symbol represents the SVM CV predicted class membership for an individual SERS spectrum after incubation of synthetic RNA strains at 37°C for 2 hours with DNA probe. The colored symbol and sample numbers are identical to the samples described in Figures 6 and 7.
(A) The colored symbols represents SERS spectra containing: the high NA-EIV RNA strains of A/ck/Hubei/327/2004/H5N1 (
 ), and A/WSN/33/H1N1 (
 ) and the low NA-EIV RNA strains of A/Gs/Gd/1/96/H5N1 (
 ) incubated with high NA-EIV DNA probe. High DNA probe with MCH spacer was used as a control (
 ).
).
(B) The colored symbols represents SERS spectra containing: the low NA-EIV RNA strains of A/Gs/Gd/1/96/H5N1 (
 ) and the high NA-EIV RNA strains of A/ck/Hubei/327/2004/H5N1 (
 ), and A/WSN/33/H1N1 (
 ) incubated with low NA-EIV DNA probe. Low NA-EIV DNA probe with MCH spacer was used as control (
 ).
).
Table 5.
SVM-DA results for the low and high synthetic RNA NA-EIV Assays.
| Low NA-EIV | High NA-EIV | |||||||
|---|---|---|---|---|---|---|---|---|
| Full Hybridization | Partial/No Hybridization | Full Hybridization | Partial/No Hybridization | |||||
| Sensitivity (CV) | 0.950 | 1.000 | 1.000 | 1.000 | 1.000 | 1.000 | 1.000 | 0.950 |
| Specificity (CV) | 1.000 | 1.000 | 0.983 | 1.000 | 1.000 | 1.000 | 0.983 | 1.000 |
| Class Error (CV) | 0.025 | 0.000 | 0.008 | 0.000 | 0.000 | 0.000 | 0.0083 | 0.025 |
| RMSECV | 0.000 | 0.0125 | ||||||
The SVM results for calculations on the analogous low NA-EIV complexes are shown in Figure 8B. This figure again shows i) the low NA-EIV DNA probe before hybridization (blue circle), ii) the low NA-EIV DNA probe hybridized with its complementary low NA-EIV A/Gs/Gd/1/96/H5N1 (red square), and the low NA-EIV DNA probe with non-complementary iii) high NA-EIV A/WSN/33/H1N1(green triangle), and iv) low NA-EIV A/Gs/Gd/1/96/H5N1 (yellow inverted triangle). The SVM model for low NA-EIV assay provides sensitivity of 1.000, 0.950, 1.000, 1.000 and specificity of 1.000, 1.000, 0.983, 1.000 with 0.000 RMSECV. In this SVM classification model for the low NA-EIV assay, an RMSECV of 0.000 indicates an extremely high accurate prediction ability of the classification model compare to PLS-DA. These results show a significant difference between four different hybridization stages for both high and low NA-EIV assays.
Detection of RNA from influenza isolates
To test whether this SERS procedure was able to detect NA stalk mutations in real viruses, RNAs were isolated from three different influenza viruses having the NA stalk motif associated with enhanced virulence, namely the A/WSN/33/H1N1, A/Anhui/1/2005/H5N, and A/Vietnam/1203/2004/H5N1 strains. To discriminate between different the NA stalk isolates, we developed a 4-class classification model, incorporating: i) the DNA probe alone, as well as the DNA probe incubated with ii) A/WSN/33/H1N1, iii) A/Vietnam/1203/2004/H5N1 and iv) A/Anhui/1/2005/H5N1 RNA samples.
The resulting SERS spectra of the DNA/RNA complexes were analyzed via PLS-DA to discern binding of the RNAs isolated from the different influenza strains. As described above for the synthetic DNA/RNA complexes, cross-validation (Venetian blinds, 8 splits) was performed for internal validation of the calibration model. The optimal number of latent variables (LV = 4) was selected based on the cross-validated classification error in the training set; this optimized classification model was then subsequently used for the class predictions in the validation set.
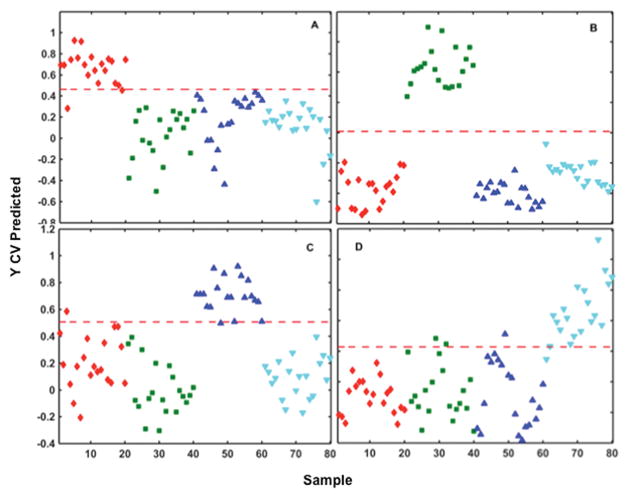
The multi-class classification results from the PLS-DA model are shown in Figure 9. The four classes in this Figure represents the DNA probe only before hybridization (red diamond ⛆), and the DNA probe incubated with RNA isolated from the influenza strains A/WSN/33/H1N1 (green square ■), A/Vietnam/1203/2004/H5N1 (blue triangle ▲), and A/Anhui/1/2005/H5N1 (cyan inverted triangle ▼).. Eighty total spectra are represented in this Figure, twenty for each class. Each symbol represents the SERS spectrum obtained from a different RNA sample. It is clear from Figure 9 that the SERS methodology described here is able distinguish the spectra of the different DNA/RNA hybrids using real viral RNA obtained from influenza strains that contain mutations associated with NA stalk enhanced virulence.
Figure 9.
PLS-DA prediction plots for the DNA/RNA hybrid complexes prepared using RNAs isolated from laboratory influenza strains containing the NA stalk mutations. A total of 80 spectra are represented in each plot, with 20 replicates in each group. Each colored symbol represents the PLS predicted value for an individual SERS spectrum after incubation of RNA strains at 37°C for 2 hours with DNA probe.
(A–D) The colored symbols represents SERS spectra containing: A/WSN/33/H1N1 (
 ), A/Vietnam/1203/2004/H5N1 (
 ) and A/Anhui/1/2005/H5N1 (
 ). DNA probe with MCH spacer was used as a control (
 ).
).
Table 6 summarizes the quantitative results obtained from Figure 9, including sensitivity, specificity, classification error, and root mean square error of cross-validation (RMSECV) from the PLS-DA model. The results show accurate sensitivity and specificity values of ~98% with consistent RMSECV values of 0.191, 0.142, 0.239, 0.131, respectively for the different classes in this classification model. These results demonstrate the ability of the method to identify NA stalk virulence genotypes from real RNA virus samples.
Table 6.
PLS-DA results for the SERS spectra obtained from DNA/RNA hybrids isolated from influenza strains with NA stalk mutations.
| DNA Probe | A/WSN/33 | A/Vietnam/1203/2004 | A/Anhui/1/2005 | |
|---|---|---|---|---|
| Sensitivity (CV) | 1.000 | 1.000 | 1.000 | 1.000 |
| Specificity (CV) | 1.000 | 1.000 | 0.983 | 1.000 |
| Class Error (CV) | 0.000 | 0.000 | 0.000 | 0.000 |
| RMSECV | 0.191 | 0.142 | 0.239 | 0.131 |
Conclusions
We demonstrated a direct method for detecting the influenza NA stalk-motif associated with influenza virulence. A SERS methodology based on 5′-thiol-modified ssDNA probes immobilized onto AuNP substrates was utilized to accurately identify the extent of DNA-RNA hybridization.
Two different types of studies were performed First, synthetic RNA model sequences corresponding to NA stalk motifs associated with enhanced virulence were used to establish proof of concept. These sequences were associated with mutated NA stalk sequences in influenza virus strains A/ck/Hubei/327/2004/H5N1, A/Gs/Gd/1/96/H5N1, and A/WSN/33/H1N1. Secondly, real viral RNAs were isolated from three different influenza viruses having the NA stalk motif associated with enhanced virulence. These are the A/WSN/33/H1N1, A/Anhui/1/2005/H5N, and A/Vietnam/1203/2004/H5N1 influenza strains. We tested the ability of the SERS platform to identify the NA stalk genotypes in both the synthetic sequences and the isolated viral RNAs. Due to similarities in the observed SERS spectra between complementary and non-complementary DNA-RNA target sequences, multivariate analysis were employed in order to accurately distinguish the extent of hybridization of DNA-RNA binding. For the synthetic RNA sequences, PLS-DA and SVM-DA resulted in ~95% sensitivity and specificity, see Figures 6–8,. For the case of the isolated viral RNAs, PLS-DA results showed ~98% sensitivity and specificity (Figure 9).
In addition to detection of specific NA-EIV motifs, these studies are the first use of CTAB-modified AuNP substrates for detection of oligonucleotides.. We determined the uniformity, robustness, and stability of these substrates in several ways. Figure 2 demonstrates that the RSD for SERS spectra collected from i) multiple spots within a single substrate, ii) multiple substrates fabricated from same batch, and iii) different batches were determined to be 9%, 16% and 16%, respectively. Spectral variability between classes was rigorously assessed to examine the source of spectral variability and the potential effect from the non-analyte spectral variances when establishing the classification model. Figure 5 showed that the spectral amplitude calculated among different classes was 2× greater than its value from within a class. This demonstrated that the dominant source of spectral variance is due to the analyte, which allows the method to be used for class separation. Feature selection was performed using ANOVA along with a post-hoc Tukey test to identify the spectral features that are significant to best discriminate between classes. The selected spectral features associated with DNA-RNA binding matched closely with amino acids Raman vibrations reported in the literature.
This study demonstrated the feasibility of an oligonucleotide-based SERS technique for an accurate and direct identification of a potential virulence factor, NA stalk-motifs, as a diagnostic tool without amplification or labeling. Future work will attempt to identify a virulence factor in the NA stalk region using various wild type RNA extracted from clinical isolates.
Supplementary Material
Acknowledgments
The diamine hexaethylene glycol 11-(10′-carboxy-decyldisulfanyl)undecanoic amide, used as the bifunctional disulfide/amine linker in preparation of the AuNP films, was a generous gift of Dr. Geert-Jan Boons of the Complex Carbohydrate Research Center, University of Georgia. This research project was supported by the U.S. Public Health Service through grant GM102546 from the National Institutes of Health.
Bibliography
- 1.Li J, Dohna Hz, Cardona CJ, Miller J, Carpenter TE. PLOS One. 2011;6:1–11. doi: 10.1371/journal.pone.0014722. [DOI] [PMC free article] [PubMed] [Google Scholar]
- 2.Luo G, Chung J, Palese P. Virus Res. 1993;29:141–153. doi: 10.1016/0168-1702(93)90055-r. [DOI] [PubMed] [Google Scholar]
- 3.Castrucci MR, Kawaoka Y. J Virol. 1993;67:759–764. doi: 10.1128/jvi.67.2.759-764.1993. [DOI] [PMC free article] [PubMed] [Google Scholar]
- 4.Munier S, Larcher T, Cormier-Aline F, Soubieux D, Su B, Guigand L, Labrosse B, Cherel Y, Quere P, Marc D, Naffakh N. J Virol. 2010;84:940–952. doi: 10.1128/JVI.01581-09. [DOI] [PMC free article] [PubMed] [Google Scholar]
- 5.Sun Y, Tan Y, Wei K, Sun H, Shi Y, Pu J, Yang H, Gao GF, Yin Y, Feng W, Perez DR, Liu J. J Virol. 2013;87:2963–2968. doi: 10.1128/JVI.02688-12. [DOI] [PMC free article] [PubMed] [Google Scholar]
- 6.Zhou H, Yu Z, Hu Y, Tu J, Zou W, Peng Y, Zhu J, Li Y, Zhang A, Ziniu Y, Ye Z, Chen H, Jin M. PLOS One. 2009;4:1–8. doi: 10.1371/journal.pone.0006277. [DOI] [PMC free article] [PubMed] [Google Scholar]
- 7.Dlugolenski D, Jones L, Saavedra G, Tompkins SM, Tripp RA, Mundt E. Arch Virol. 2011;156:565–576. doi: 10.1007/s00705-010-0891-x. [DOI] [PubMed] [Google Scholar]
- 8.Matsuoka Y. J Virol. 2009;83:4704. doi: 10.1128/JVI.01987-08. [DOI] [PMC free article] [PubMed] [Google Scholar]
- 9.Bender C, Hall H, Huang J, Klimov A, Cox N, Hay A, Gregory V, Cameron K, Lim W, Subbarao K. Virology. 1999;254:115–123. doi: 10.1006/viro.1998.9529. [DOI] [PubMed] [Google Scholar]
- 10.Matrosovich M, Zhou N, Kawaoka Y, Webster R. J Virol. 1999;73:1146–1155. doi: 10.1128/jvi.73.2.1146-1155.1999. [DOI] [PMC free article] [PubMed] [Google Scholar]
- 11.Spackman E, Swayne DE, Suarez DL, Senne DA, Pedersen JC, Killian ML, Pasick J, Handel K, Somanathan Pillai SP, Lee C-W, Stallknecht D, Slemons R, Ip HS, Deliberto T. J Virol. 2007;81:11612–11619. doi: 10.1128/JVI.01368-07. [DOI] [PMC free article] [PubMed] [Google Scholar]
- 12.Zhou H, Jin M, Chen H, Huag Q, Yu Z. Virus Genes. 2006;32:85–95. doi: 10.1007/s11262-005-5849-9. [DOI] [PubMed] [Google Scholar]
- 13.Wassenegger M. Mol Biotechnol. 2001;17 doi: 10.1385/MB:17:1:73. [DOI] [PubMed] [Google Scholar]
- 14.Atkinson TP, Balish MF, Waites KB. FEMS Microbiol Rev. 2008;32:956–973. doi: 10.1111/j.1574-6976.2008.00129.x. [DOI] [PubMed] [Google Scholar]
- 15.Driskell J, Primera-Pedrozo OM, Dluhy RA, Zhao Y, Tripp RA. Appl Spectrosc. 2009;63:1107–1114. doi: 10.1366/000370209789553183. [DOI] [PubMed] [Google Scholar]
- 16.Driskell JD, Tripp RA. Chem Commun. 2010;46:3298–3300. doi: 10.1039/c002059a. [DOI] [PubMed] [Google Scholar]
- 17.Negri P, Chen G, Kage A, Nitsche A, Naumann D, Xu B, Dluhy RA. Anal Chem. 2012;84:5501–5508. doi: 10.1021/ac202427e. [DOI] [PMC free article] [PubMed] [Google Scholar]
- 18.Negri P, Kage A, Nitsche A, Naumann D, Dluhy RA. Chem Commun. 2011;47:8635–8637. doi: 10.1039/c0cc05433j. [DOI] [PubMed] [Google Scholar]
- 19.Negri P, Choi JY, Jones C, Tompkins SM, Tripp RA, Dluhy RA. Anal Chem. 2014;86:6911–6917. doi: 10.1021/ac500659f. [DOI] [PMC free article] [PubMed] [Google Scholar]
- 20.Negri P, Dluhy RA. Analyst. 2013;138:4877–4884. doi: 10.1039/c3an00774j. [DOI] [PMC free article] [PubMed] [Google Scholar]
- 21.Pienpinijtham P, Xia X, Ekgasit S, Ozaki Y. Phys Chem Chem Phys. 2012;14:10132–10139. doi: 10.1039/c2cp41419h. [DOI] [PubMed] [Google Scholar]
- 22.Duraipandian S, Bergholt MS, Zheng W, Ho KY, Teh M, Yeoh KG, So JBY, Shabbir A, Huang Z. J Biomed Opt. 2012;17:081418. doi: 10.1117/1.JBO.17.8.081418. [DOI] [PubMed] [Google Scholar]
- 23.Ferreira MP, Grondona AEB, Rolim SBA, Shimabukuro YE. J Appl Remote Sens. 2013;7:073502. [Google Scholar]
- 24.Vaiphasa C, Ongsomwang S, Vaiphasa T, Skidmore AK. Estuar Coast Shelf S. 2005;65:371–379. [Google Scholar]
- 25.Price JC. Remote Sens Environ. 1994;49:181–186. [Google Scholar]
- 26.Brereton RG. Chemometrics for Pattern Recognition. John Wiley & Sons, Ltd; United Kingdom: 2009. [Google Scholar]
- 27.Brereton RG, Lloyd GR. Analyst. 2010;135:230–267. doi: 10.1039/b918972f. [DOI] [PubMed] [Google Scholar]
- 28.Li Y, Du G, Cai W, Shao X. Am J Anal Chem. 2011;2:135–141. [Google Scholar]
- 29.Sorich MJ, Miners JO, McKinnon RA, Winkler DA, Burden FR, Smith PA. J Chem Inf Comput Sci. 2003;43:2019–2024. doi: 10.1021/ci034108k. [DOI] [PubMed] [Google Scholar]
- 30.Hennigna SL, Driskell JD, Ferguson-Noel N, Dluhy RA, Zhao Y, Tripp RA, Krause DC. Appl Environ Microbiol. 2011;78:1930–1935. doi: 10.1128/AEM.07419-11. [DOI] [PMC free article] [PubMed] [Google Scholar]
- 31.Hennigan SL, Driskell JD, Dluhy RA, Zhao Y, Tripp RA, Waites KB, Krause DC. PLoS One. 2010;5:e13633. doi: 10.1371/journal.pone.0013633. [DOI] [PMC free article] [PubMed] [Google Scholar]
- 32.Fu HY, Huang DC, Yang TM, She YB, Zhang H. Chin Chem Lett. 2013;24:639–642. [Google Scholar]
- 33.Aguirre CM, Kaspar TR, Radloof C, Halas NJ. Nano Letters. 2003;3:1707–1711. [Google Scholar]
- 34.Dolcet C, Rodenas E. Coll Surf A. 1993;75:39–50. [Google Scholar]
- 35.Kaminska A, Inya-Agha O, Forster RJ, Keyes TE. Phys Chem Chem Phys. 2008;10:4172–4180. doi: 10.1039/b803007c. [DOI] [PubMed] [Google Scholar]
- 36.Lierop Dv, Krpetic Z, Guerrini L, Larmour IA, Dougan JA, Faulds K, Graham D. Chem Commun. 2012;48:8192–8194. doi: 10.1039/c2cc31731a. [DOI] [PubMed] [Google Scholar]
- 37.Rodenas E, Dolcet C, Valiente M, Valeron EC. Langmuir. 1994;10:2088–2094. [Google Scholar]
- 38.Sierra ML, Rodenas E. Langmuir. 1994;10:4440–4445. [Google Scholar]
- 39.Wang H, Levin CS, Halas NJ. J Am Chem Soc. 2005;127:14992–14993. doi: 10.1021/ja055633y. [DOI] [PubMed] [Google Scholar]
- 40.Park YK, Park S. Chem Mater. 2008;20:2388–2393. [Google Scholar]
- 41.Wei L, Ming Z, Jinli Z, Yongcai H. Front Chem China. 2006;4:438–442. [Google Scholar]
- 42.Park YK, Yoo SH, Park S. Langmuir. 2007;23:10505–10510. doi: 10.1021/la701445a. [DOI] [PubMed] [Google Scholar]
- 43.Hong S, Li X. J Nanomater. 2013:1–9. [Google Scholar]
- 44.Steinhauer DA. Virology. 1999;258:1–20. doi: 10.1006/viro.1999.9716. [DOI] [PubMed] [Google Scholar]
- 45.Elssied NOF, Ibrahim O, Osman AH. Res J Appl Sci Eng Technol. 2014;7:625–638. [Google Scholar]
- 46.Vaiphasa C. Isprs J Photogramm. 2006;60:91–99. [Google Scholar]
- 47.Vaiphasa C, Skidmore AK, de Boer WF, Vaiphasa T. Isprs J Photogramm. 2007;62:225–235. [Google Scholar]
- 48.Guicheteau J, Argue L, Hyre A, Jacobson M, Christesen SD. Proc of SPIE. 2006;6218:62180O-62181–62180O-62111. [Google Scholar]
- 49.Otto C, van den Tweel TJJ, de Mul FFM, Greve J. J Raman Spectrosc. 1986;17:289–298. [Google Scholar]
- 50.Ballabio D. Anal Meth. 2013;5:3790. [Google Scholar]
Associated Data
This section collects any data citations, data availability statements, or supplementary materials included in this article.


